May 2020 - U.S. Broadband Internet Access In The 2020 Pandemic: Broadband Importance, Shifts, Differences, Stresses, And Divides
←
→
Page content transcription
If your browser does not render page correctly, please read the page content below
U.S. Broadband Internet Access In The 2020 Pandemic:
    Broadband Importance, Shifts, Differences, Stresses, And Divides

                      2020 Consumer Broadband Study
                             Topline Results

                                 For The

                               May 2020

0
TABLE OF CONTENTS
I. STUDY OVERVIEW.................................................................................................... 2
II. STUDY METHODOLOGY .......................................................................................... 2
III. KEY FINDINGS ......................................................................................................... 2
A. General Pandemic Impacts Noted .................................................................... 2
B. Critical Importance Of Internet Support During The 2020 Pandemic .............. 4
C. Dramatic Internet Shifts During The Pandemic ................................................ 5
D. Broadband Differences Highlighted During The Pandemic .............................. 7
E. Broadband Stresses Highlighted During The Pandemic .................................... 9
F. The Impact Of Broadband Differences On The Digital Divide ........................ 10
IV. STUDY CONCLUSIONS ............................................................................................ 11
V. APPENDIX 1 NOTES REGARDING SPEED TEST DATA ............................................. 12
1I. Study Overview Since 2007, each Spring The Fiber Broadband Association has commissioned RVA LLC to conduct one of the most comprehensive annual consumer broadband Internet usage studies in North America. Some of the data from this study is publicly released each year, while other components are used to inform Association members. The 2020 version of the study has just finished fielding. Given the extraordinary times we are in and the importance of timely relevant information, the following key topline findings were analyzed quickly. As difficult as the current Pandemic and the associated economic shutdown has been, it is apparent from this study that broadband has been extremely important to mitigating the personal and economic damage from this event. Yet clearly, work to improve our Internet Infrastructure remains. II. Study Methodology The study was conducted among a total of 2,000 random Internet users in the United States using an online panel. In addition, a sample of Canada, and various oversampling where appropriate was obtained for a total sample size of over 3,000. This topline represents the U.S random sample. III. Key Findings A. General Pandemic Impacts Noted Based on the study, a total of 39% of households have experienced negative financial impacts as of April 9, 2020. (Negative financial impacts increased significantly even during the two weeks of fielding.) 2
Overall, 84% of respondents reported shopping trips had declined. After the shelter-in-place guidance was
initiated, the number of weekly trips out of the home for shopping declined from an average of 3.8 to 1.7
according to respondents.

3
B. The Critical Importance of Internet Support During The 2020 Pandemic
Over 90% of respondents indicated the Internet is either somewhat or very important to their household.
There was considerable response as to how Internet access has assisted during the COVID crisis. Based on an
open-end question to this end, the themes consumers most noted were communication, news and
information, provisioning, entertainment, and work.

Through new supply provisioning methods, etc., the Internet has helped facilitate successful virus
transmission mitigation efforts. The Internet has also allowed some level of continued economic activity for
non-essential workers and has assisted in maintaining mental health during a time of isolation.

4
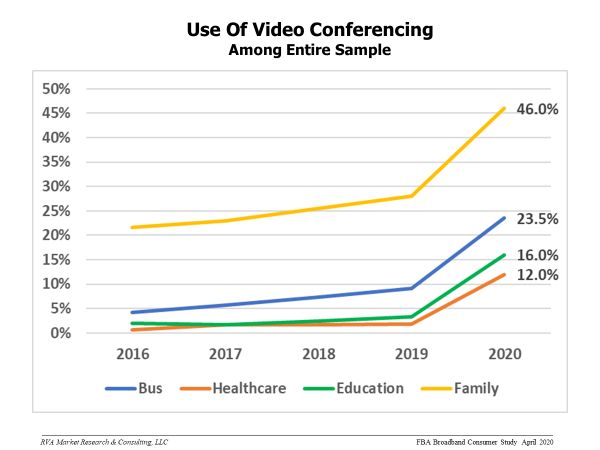
C. Dramatic Internet Shifts During The Pandemic
Key Internet usage shifts have already clearly occurred during the Pandemic. It remains to be seen exactly how
these shifts may influence long term usage patterns, but almost all such applications have increased rather
spectacularly during this period. This is especially true for applications that require heavy two-directional
transmission such as video conferencing. (Note the lines in the chart below show shifts from the last point in
time this survey was conducted in the spring of 2019. In truth of course, most of this shift has actually occurred
since about March 15, 2020.)

Though only 12% list video conferencing for medical uses as of early April, the increase in video
teleconferencing from under 2% in 2019 is significant - and is clearly still growing. This reflects both the
increased need for touchless medical services as well as significant changes in both government regulation and
insurance company policies in order to facilitate real telemedicine.
For some of these video conferencing cases, the overall use against the base of all respondents tells only part
of the story. When reviewing business video conferencing utilization against a base of those most likely to use
these tools, the current video conference consumption is even more impressive. We followed the following
methodology to analyze business video usage:
First, we reviewed a classification of U.S. workers that will be important in the future:
Site Flexible Workers: Those whose jobs allow them to at least sometimes work from home (whether they
actually do is usually determined by the employer and/ or the worker – and by background conditions).
Site Restricted Workers: Those whose jobs usually require them to be in a specific geographic place – usually
because their job involves interfacing with other people or with equipment at such a site.
The study sample indicates that about 60% of workers are currently site flexible.

5
A total of 79% of site flexible workers reported being asked to work from home full time. Over two-thirds of
this group said they utilize video conferencing solutions while working from home.
Further, over half use Virtual Private Network (VPN) at home.
The use of education video conferencing among adult residents of younger ages (for themselves or for their
children) is also high. Based on anecdotal evidence, educational video use for children will increase further.
Many school systems were just launching formal distance learning programs after this survey fielded.

Another entertainment shift occurring is increased consumption of less professionally produced and small
audience materials – often live-streamed with accompanying social comment. This live streaming for music
performances, religious services, demonstrations, and lectures has increased upload traffic from thousands of
production locations daily (many in home), even more than streaming pre-recorded video programs.

6
D. Broadband Differences Highlighted During The Pandemic
To segment broadband access quality for this review, we used our average download speed and upload speed
indexes measured automatically as respondents answered the 2020 Consumer Study questionnaire. The speed
test data was cross tabulated against many other factors measured in the study and compared with former
RVA conducted consumer studies covering 13 years.
It should be noted here that all speed tests measurement sources have advantages and disadvantages. The
speed test data collected by RVA for the Fiber Broadband Association is perhaps the most scientifically random
sample conducted among a reasonably sized sample of home users. (The advantages and limitations of the
method - and comparison to other speed test methods is noted in Appendix 1.)
For the following analysis, study speed test measurements were converted to percentiles to render them
equivalent. We then averaged the upload and download percentiles to obtain a quality measure. For
comparison purposes, we then classified five equal classes of broadband quality (Tiers) from best to worst.
The resulting classifications are presented below along with the average speeds experienced in each.
Latency (the time in milliseconds it takes an individual packet of data to move from one point to another) is
also shown. Though latency was not considered in the tier defining equation, it is also clearly correlated with
the resulting categories.
SPEED AND LATENCY MEASUREMENTS FROM THE SURVEY BY TIER:
                                                  Tier 1        Tier 2      Tier 3        Tier 4       Tier 5
                                                (Top 20%)   (Second 20%) (Third 20%)   (Fourth 20%) (Lowest 20%)
    Download speed (Mbps)    Higher is better      261           103          49            23           4
      Upload speed (Mbps)    Higher is better       47            21          14             5           1
              Latency (ms)   Lower is better        23            29          36            45          783

The tiers are heavily influenced by the type of broadband used, and to some degree by the speed/ cost level
selected from the provider.
Based on the 2019 Broadband Experience Index conducted for the Fiber Broadband Association by RVA which
was based on download speed, upload speed, latency, and reliability, the highest performing broadband type
is fiber, followed by cable/ coax. The lower performing types include DSL/ FTTN, fixed and mobile wireless,
satellite, and of course dial-up Internet service.
The two highest broadband tiers during the Pandemic are dominated by cable (available to over 90% of
Americans) and fiber (currently available to about 36% of Americans). These higher performing types represent
95% of Tier 1 broadband, but just 31% of Tier 5 broadband.
Further, it should be noted that in Tier 4 and 5, even when the delivery methods that can provide the highest
broadband exist, they may be sometimes constricted. For example, cable broadband access in these lower
tiers is often not upgraded to the latest DOCSIS 3.1 standard.

7
THE PERCENT OF BROADBAND TYPE REPRESENTED IN EACH TIER (COLOMNS ADD TO 100%):
Tier 1 Tier 2 Tier 3 Tier 4 Tier 5
(Top 20%) (Second 20%) (Third 20%) (Fourth 20%) (Lowest 20%)
Fiber 41% 29% 17% 14% 4%
Cable 55% 62% 70% 46% 27%
DSL 2% 4% 8% 31% 53%
Other (Wireless, Satellite, Dial up) 2% 5% 5% 9% 16%
THE PERCENT OF EACH BROADBAND TYPE’S SUBSCRIBERS FOUND IN EACH TIER (ROWS ADD TO 100%):
Tier 1 Tier 2 Tier 3 Tier 4 Tier 5
(Top 20%) (Second 20%) (Third 20%) (Fourth 20%) (Lowest 20%)
Fiber 39% 28% 16% 13% 4%
Cable 21% 24% 27% 18% 10%
DSL 2% 4% 8% 32% 54%
Other (Wireless, Satellite, Dial up) 5% 14% 14% 24% 43%
8E. Broadband Stresses Highlighted During The Pandemic
Many wondered if the Internet would “break” during this Pandemic. It did not, despite greatly increased usage.
Many analyses of ISP statistics show Internet traffic has increased greatly during this period. The peak usage
point is not necessarily significantly higher, but much higher traffic is evident throughout a much longer period
of the day.
Despite the Pandemic, RVA data shows an increase in both download and upload speeds from the last survey
roughly one year ago. (Further, controlled tests from independent testing firm “Sam Knows” show only about
a 2% decrease in speeds from a point just prior to the Pandemic mitigation efforts using a longitudinal panel -
the same providers and end points over time. Some other voluntary speed test companies show greater
decreases, but because their data comes from neither a longitudinal panel nor a random sample, this could
relate to other factors such as a change in the mix of home speed test home users, and of course, fewer testers
from businesses.)
While the overall Internet has been up to the challenge, the average user experience has been more stressed,
especially from the upload side of the equation. The problem of insufficient upload capacity versus demand
can impact the average user experience – especially for those with lower quality broadband connections.
To review the actual usage implications of lower performing broadband, we used the following measures:
1. Broadband rationing inside the home
Respondents were asked how significant the need for rationing has been inside their homes, such as asking
other family members not to use the Internet during work video conference calls. The question was asked
on a scale of 1-5. (The percent rating 3-5 on the scale was considered significant rationing. Only households
with 3 or more family members potentially using the Internet were analyzed for this question.)
2. Personal productivity
Respondents were asked what percent of the time they estimated they spent waiting for applications to
load. This estimate was converted to hours by multiplying the waiting percentage by the number of hours
estimated online. While such a rating is obviously subjective and subject to error, the average of many
respondents tends to provide a reasonable and comparable measure.
The study shows the broadband reflected in these tiers have real-world impacts to the user.
(It should be noted that even the top tier shows some rationing and productivity loss. The reasons are unclear
but may relate to upload constrictions from some types - even in this tier, home Wi-Fi wireless transfer
constrictions - especially from older Wi-Fi protocols, and perhaps some upward respondent bias in expressing
time lost and frustrations.)
The results of these impact measures by broadband access tiers are shown below:
Tier 1 Tier 2 Tier 3 Tier 4 Tier 5
(Top 20%) (Second 20%) (Third 20%) (Fourth 20%) (Lowest 20%)
In-home rationing
% significant rationing 18.7% 22.5% 28.6% 34.3% 48.7%
Online time waiting Est. Hrs lost per wk 5.0 5.3 5.6 6.8 11.0
The impact of lower quality broadband was very evident. For example, comparing Tier 1 Internet to Tier 5,
there was over twice as much in-home rationing and hours per week of lost time. (Consider such
implications: 6 hours x 52 weeks equals 312 hours – or 18 waking days per year of lost productivity.)
9F. The Impact Of Broadband Access Differences On the Digital Divide Most today are aware of the digital divide, which can be segmented into an urban low-income digital divide and the rural digital divide. We analyzed respondent results by zip code density and determined the weight of the five broadband tiers within each zip code density group. We can see below that the most-dense urban areas of the country have a roughly equal amount of both high- quality Tier 1 broadband and low-quality Tier 5 broadband. In this urban/ dense category, we hypothesize that the difference relates in part to extreme differences in affluence within urban areas, and the associated differences in Internet adoption. On, the other end of the spectrum, the lowest density (rural) groups are dominated by the lower quality - especially Tier 5 (which registered under 5 Mbps down and extremely high latency). We hypothesize that higher quality broadband access is simply not currently available to most of those in low density areas. (This lack of true broadband service is also confirmed via FCC data collected from providers, and from other sources.) 10
IV. Study Conclusions and Implications
1. The country is obviously currently reeling from the Coronavirus Pandemic. Negative economic impacts
   were confirmed in this study.
2. It is apparent that citizens are grateful for the Internet and high-performance broadband access in this
   crisis. It also seems clear that if the same circumstances of Pandemic and shutdown occurred several years
   ago, with a much lower quality broadband access, there would have been far more severe impacts from
   the crisis. Pandemic spread could have been faster given less ability to retreat from traditional contact,
   economic impacts almost certainly would have been heightened, and mental health impacts would be
   more acute.
3. The use of specific Internet applications has increased dramatically during this crisis – especially two-
   directional bandwidth and latency-dependent video use for socialization, employment, and medical
   consultations. Small audience live streaming of entertainment events has also increased considerably.
   Both these applications highlight the need to look beyond download speeds and focus equally on higher
   upload speeds and lower latency.
4. While the internet backbone has held up well during this crisis, more concerns have been seen at the point
   of final access to customers. The differentiation of broadband access during these times is now more
   apparent – both in terms of speeds and latency delivered to the end user. It is further evident that such a
   variance results in significant real-world impacts to many users, such as more rationing of Internet services
   in the home and more lost time/ lower productivity. These impacts can be especially problematic when
   the Internet is truly needed in the home for both formal education and official work activities.
5. The differentiation of broadband quality is especially evident within groups impacted by the “Digital
   Divide”.
     In urban low-income areas, high quality access is sometimes available, but based on a 2019 Low Income
      Urban Digital Divide study from RVA, security concerns, affordability, equipment costs, and lack of
      experience can be barriers to adoption. Further, many in this category start with Smartphone service and
      then move to home service. The perceived need for higher quality in-home service has probably been
      heightened for low income groups during this crisis, but again, barriers have probably increased as well.
      Efforts to assist low income broadband adoption should be encouraged during these times.
     In rural areas, many lack the availability of high-quality broadband, even though the underlying need for
     access is even greater. The real-world impacts of lower quality broadband access for those in truly rural
     areas are readily apparent in the study and demonstrates the need to provision all areas of the country as
     quickly as possible.
     This study would seem to further imply that in the best interest of both rural citizens and taxpayers, any
     government subsidization of rural low-density infrastructure builds should only occur once – awarding
     government funds only for broadband delivery methods that will provide high quality results and have long
     term viability.

11
V. Appendix 1: Notes Regarding Speed Test Data A few notes are relevant regarding speed test data. In general, it is usually difficult to directly compare speed test data from different sources because of different testing procedures and sampling methodologies. Another variable can be whether speed test data is expressed as an average or median. As noted earlier, various sources for speed test data have different advantages and disadvantages. The three major current types are noted below: Data from Voluntary Speed Test Providers: The primary advantage for this data is the volume of speed test data that is collected and the fact that it is collected every day. This provides the ability to review speeds in small geographic areas, for specific providers, and between small points in time. Primary disadvantages include the fact that it is a “convenience sample” in that users self-select their interest in taking a speed test. This can result in systematic bias, which can also vary over time. (For example, at one point those paying for the highest speed tiers may have been most interested in testing speeds, while now a broader group of consumers may be interested.) Other disadvantages include the fact that speed tests are influenced by in-home factors such as Wi-Fi routers. Tests from homes versus businesses may also be hard to differentiate. Data from Scientific Market Research (such as RVA): The primary advantage for this data is the fact that it comes from a scientific “random” sample. Thus, compared to other methods, it provides a valued sample of the real-world experience in the entire nation via a random sample of the many Internet service providers – large and small. Data comes from speed testing logic embedded within our online survey programing. Primary disadvantages include a typical small percentage “sampling error” versus the real population and the fact that the sample, while relatively large (over 2,000), can only be subdivided for analysis to a point. Further, the sampling typically only covers one two-week time period each year. Finally, as above, tests can be influenced by in-home factors such as Wi-Fi routers. (Potential disadvantages such as transcription errors from the respondent have been eliminated by using automatic tests during the survey. Problems of speed data coming from a point outside the home, such as a coffee shop or business location, have largely been eliminated by asking the respondent where the test was being conducted… at two different points during the survey.) Data from Scientifically Controlled Tests (such as The FCC in collaboration with Sam Knows): The primary advantage for this data is that it is developed from controlled tests that eliminate in-home factors, such as Wi- Fi, and utilizes a more standardized, thorough, and realistic testing methodology. Thus, for example, by using a longitudinal panel – i.e. the same providers and end points over time, the method is the best of the three for comparing actual changes in speeds during the Pandemic. The primary disadvantage is that the method has some limitations in the number of providers and end points (home locations) that can be tested in this manner, though efforts are currently underway to increase the number of end points with testing technology. 12
You can also read