FIRE BACKGROUND - InciWeb
←
→
Page content transcription
If your browser does not render page correctly, please read the page content below
East Troublesome Fire Forest Service Burned Area Emergency Response
                             Executive Summary
          Arapaho-Roosevelt and Medicine Bow-Routt National Forests
                              December 9, 2020

FIRE BACKGROUND
The East Troublesome Fire was reported the afternoon of October 14 on a portion of the Arapaho
National Forest administered by the Medicine Bow-Routt National Forests; the cause is still under
investigation. Within three days, high winds and low humidity allowed the fire to spread to over 10,000
acres. Between Oct. 20-23, the fire exploded from 18,550 acres to 187,964 acres. The fire crossed
Highway 125 on the afternoon of Oct. 21 and spread eastward into the Rocky Mountain National Park
on Oct. 22, crossing the Continental Divide and reaching the western edge of Estes Park on Oct. 23.

The fire was fueled by wide-spread drought, numerous dead and down beetle-killed trees, red flag
weather conditions created by high winds and dry conditions, and poor humidity recovery overnight.
The combination of these factors led to unprecedented, wind-driven, active fire behavior with rapid
spread during the overnight hours. A winter storm from Saturday, Oct. 24 through the morning of Oct.
26 brought very cold temperatures, precipitation in the form of snow and lighter winds, resulting in a
dramatic drop in fire behavior with smoldering and reduced fire spread, resulting in a final total fire
acreage of 193,812. Impacted areas included the Arapaho & Roosevelt National Forests, Medicine Bow-
Routt National Forests, Bureau of Land Management, Rocky Mountain National Park, and private lands.

The BAER assessment for the East Troublesome fire was completed by two BAER teams. The National
Park Service (NPS) mobilized a team to assess the burned area within Rocky Mountain National Park,
which is approximately 23,000 acres of the total burned area. The US Forest Service (USFS) mobilized a
BAER team to assess the remaining portion of the burned area. This report will focus on the 171,209
acres assessed by the USFS BAER team.

Early season snowfall prevented the USFS BAER team from conducting a field survey in most of the
burned area. The USFS team mapped soil burn severity for the entire fire outside of Rocky Mountain
National Park. The assessment of threats to critical values focused on human life/safety and trails on
National Forest System (NFS) lands. A significant assessment workload of other critical Forest Service
values remains and will be resumed in late spring 2021.

                                                Page 1 of 9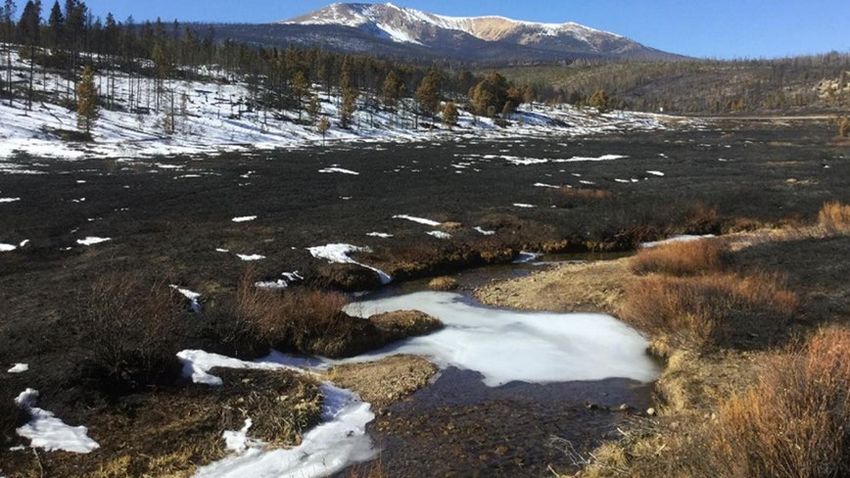
Figure 1: East
                                                                                        Troublesome burn
                                                                                        area partially obscured
                                                                                        by snow. View is from
                                                                                        the NFSR 123 bridge
                                                                                        over Pass Creek,
                                                                                        looking north towards
                                                                                        Parkview Mountain.

BAER PROCESS
USFS BAER assessments focus on imminent post-fire threats to life and safety, property, natural
resources, and cultural resources on NFS lands. Threats include determining where post-fire snowmelt
and precipitation events could increase runoff and flooding, erosion and sediment delivery, debris flows,
and high-risk areas for the spread of invasive weeds.

Hydrologists, soil scientists, engineers, recreation and weed specialists, archaeologists, wildlife and
fisheries biologists, and GIS support all contribute to the BAER assessment. Additionally, the US
Geological Survey (USGS) models post-fire debris flow potential; results are available at
https://landslides.usgs.gov/hazards/postfire_debrisflow/.

The first step in identifying post-fire threats is development of a Soil Burn Severity (SBS) map to
document the degree to which soil properties changed as a result of the fire. Fire damaged soils have
low strength, high root mortality, and increased rates of water runoff and erosion. Soil burn severity is
classified according to the Field Guide for Mapping Soil Burn Severity (Parsons et al, 2010). Primary soil
characteristics considered in soil burn severity classification are forest floor cover, ash color, integrity of
roots, integrity of structure, and water repellency 1.

Areas of low and unburned SBS have minimal effects to soil properties, and therefore little to no post-
fire effects. Moderate SBS indicates that some soil properties have been affected and the duff and litter
layer that acts as a sponge to absorb precipitation has mostly been consumed. High SBS areas have
significant alterations to soil properties such as complete consumption of littler and duff, loss of root
viability and changes to soil structure than often drive substantial watershed response including
increased erosion and runoff following precipitation events.

1
    Water repellent soils have reduced infiltration which results in increased runoff

                                                        Page 2 of 9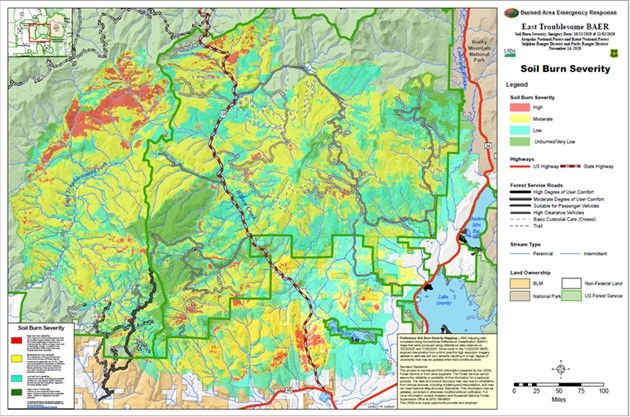
Figure 2: Comparison of low soil burn severity with roots
                                           and structure (top of shovel) vs. high soil burn severity with
                                              no soil structure or roots to help bind soil (bottom of
                                                                      shovel)

The U.S. Forest Service Geospatial and Technology and Applications Center provided the BAER team
with an initial Burned Area Reflectance Classification (BARC) maps derived from satellite imagery that
compares pre and post fire images. The team conducted limited field verification surveys to adjust the
BARC to create the final SBS map (Figure 3).

                                                                                         Figure 3. East
                                                                                         Troublesome
                                                                                          fall 2020 Soil
                                                                                         Burn Severity
                                                                                               map

                                                Page 3 of 9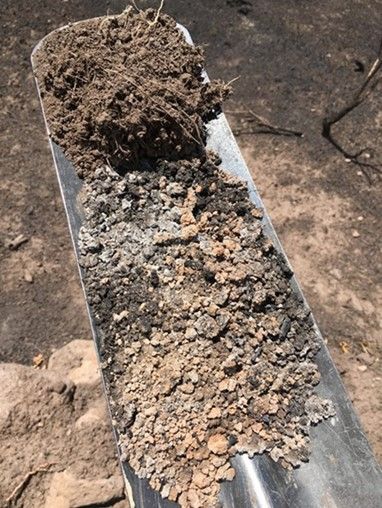
ANALYSIS SUMMARY
SOILS
Fire behavior played a large role in the severity of impacts to soil in the East Troublesome fire. Longer
residence times in the west side of the fire resulted in comparatively higher SBS. The east portion of the
fire experienced a running crown fire due to the intense winds and was quickly cooled by a snow event.
As a result, there was a decrease in forest floor cover, but soil structure and root health were largely
intact, leading to lower SBS on the portion east of the Troublesome basin.

Snow cover complicated use of a BARC image which covered the entire burned area resulting in the use
of two BARC images and high-resolution Worldview imagery to develop the SBS map. The first image
was from 10/22/2020 and covered the majority of the fire mapped by the USFS BAER team, but gaps
existed on the northern and southern edges. The 11/2/2020 image was used in combination with high
resolution post-fire Worldview imagery to interpolate SBS in those areas not covered by the 10/22/2020
BARC image. As a result, there is a high degree of uncertainty in the accuracy of these areas, particularly
around Willow Creek Reservoir. Table 1 summarizes acres of soil burn severity by ownership for the aer
mapped by the USFS BAER team based on the fall 2020 SBS mapping. Updates to the SBS map are
possible following additional assessment in spring 2021, particularly in areas with a high degree of
uncertainty.

Table 1: Acres of soil burn severity by ownership.

        Soil Burn       NFS          BLM            State         Private        Total       % within the
        Severity                                                                             BAER
                                                                                             Analysis
                                                                                             Perimeter
        Unburned        13,974       721            2             1,583          16,280      10%
        Low             43,057       7,654          381           12,578         63,670      37%
        Moderate        68,650       8,725          434           4,910          82,719      48%
        High            7,235        758            15            532            8,540       5%
        Total           132,916      17,858         832           19,603         171,209     100%

The BAER team members use the SBS to run models to estimate erosion potential, changes in stream
flows from snowmelt and summer thunderstorm events, and the USGS uses the SBS map to model
debris flow potential. The models compare pre-fire conditions to predicted post-fire conditions to
determine relative changes as a result of the fire effects.

An estimated 53% of the area within the East Troublesome Fire perimeter had high or moderate SBS
indicating increased erosion and flood flow potential. Erosion potential post-fire is contingent on a
variety of site characteristics including soil texture, rock fragment content, slope, soil burn severity and
the distribution of soil burn severity. Soil erosion modelling predicts that post-fire erosion rates range

                                                  Page 4 of 9
from negligible amounts similar to pre-fire conditions in areas with low erosion potential and minimal
fire impacts (eg 0.06 tons/acre/year in the Trail Creek Watershed), to 0.285 tons/acre/year and
potentially even higher rates in localized areas of high soil burn severity on steep slopes. The reported
erosion rates for given watershed combine areas of high erosion rates with lower erosion areas in lower
soil burn severity and/or slopes.
The predicted erosion rates are not expected to affect long-term soil productivity. For perspective, one
acre of soil equal to the thickness of one sheet of paper is equal to one ton of sediment. The increased
erosion can result in downstream sediment delivery that bulks flows and results in increased flooding
effects. Increased erosion can also block culverts and other infrastructure and degrade water quality.
HYDROLOGY
The East Troublesome Fire burned high elevation, snowmelt-dominated watersheds tributary to the
Upper Colorado River. Snowmelt peak flows occur each spring (April-June), followed by the summer
monsoon season (July-August), which brings short duration high intensity thunderstorms.
Watershed response within the burned area will likely include an initial flush of ash, rill and gully erosion
in headwater drainages and on steep slopes, areas with snowmelt peak flows elevated over 50% relative
to pre-fire, sediment-laden flash floods following high-intensity rain events, and potentially debris flows.
Water quality will be diminished during seasonal peak runoff, as well as after high-intensity summer
rains, due to elevated ash, fine sediment, and nutrient loading. This elevated post-fire response will
gradually diminish as vegetation and groundcover levels recover each growing season, although some
impacts including elevated snowmelt runoff are likely to persist for a decade or longer. The degree of
watershed response is commensurate with soil burn severity; Table 2 summarizes acres burned by sixth
level watershed.
Table 2: Summary of 6th Level HUC watersheds burned by East Troublesome fire.
HUC (12-Digit) NAME Watershed Acres % of Watershed
Acres Burned Burned
140100010102 Upper Willow Creek 37835 35654 94
140100010603 East Fork Troublesome Creek 35917 30212 84
140100010103 Middle Willow Creek 20436 20436 100
140100010501 Drowsy Water Creek-Colorado River 29179 16979 58
140100010104 Lower Willow Creek 18044 15488 86
140100010303 Onahu Creek-Colorado River 24369 13236 54
140100010306 Stillwater Creek 11229 10160 90
140100010101 Headwaters Willow Creek 14274 8660 61
140100010601 Corral Creek-Colorado River 22452 8144 36
140100010602 Middle Fork Creek 12536 5802 46
140100010308 Lake Granby 44898 3334 7
140100010309 Smith Creek-Colorado River 14553 1220 8
140100010504 Ute Bill Creek-Colorado River 16620 851 5
Page 5 of 9140100010301 Baker Gulch 13150 689 5
140100010305 North Inlet 29334 143 0.5
101800010403 East Branch Willow Creek-Willow Creek 19863 109 0.5
140100010604 Rabbit Ears Creek-Troublesome Creek 36169 46 0.1
101800010402 Headwaters Illinois River 25027 30 0.1
Hydrologic Modelling: Snowmelt-runoff peak flow estimates and rainfall runoff were modeled for
select watersheds in the burn area. The USGS regional regression peak flow equations for Colorado
(Mountain Region) were used with a BAER modifier to estimate snowmelt-runoff response across
delineated watersheds. Wildcat5 and WEPP-PEP were used to model rainfall-runoff response in smaller
watersheds (approx. 500 to 5000 acres) from a 5 Year, 1 Hour thunderstorm event. While the estimated
quantity of post-fire flow is difficult to predict, the modeling provides some scale for the magnitude of
runoff and the relative percent increase from pre-fire to post-fire peak flows for different watersheds
affected by the fire. This information is used during a rapid post-fire assessment to indicate where
downstream critical values may be threatened by peak snowmelt or sediment-laden flash-flooding from
damaging thunderstorms.
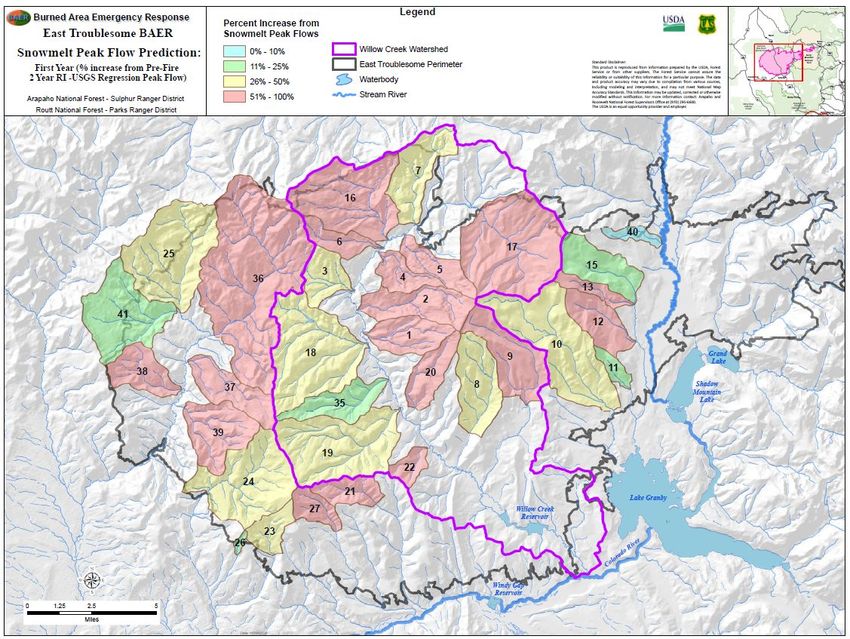
Snowmelt runoff: The snowmelt-runoff peak flows were estimated for the first year following the fire.
The percent increase in peak flows typically provides the best insight into how a watershed may respond
during snowmelt, whereas the magnitudes themselves are less precise. Snowmelt peak flow increases
were highest in watersheds where >25% of the watershed was high and moderate soil burn severity
(Figure 3).
Figure 3: USGS Regional Regression modeled snowmelt-runoff peak flow response
Page 6 of 9Rainfall-Runoff Peak Flows (WildCat5 Model): The Wildcat5 model simulated pre- and post-fire rainfall-
runoff peak flows in small catchments ranging in size from approximately 500 to 5000 acres. One
interpretation of these results compares the post-fire rainfall-runoff peak flow to the pre-
fire bankfull flows (estimated using the 2-Year Recurrence Interval USGS regional regression equation).
This provides some scale for the magnitude of runoff. Another interpretation is to compare the percent
increase from pre-fire to post-fire peak flows of an individual watershed to all the watersheds affected
by the fire. Together, scale for the magnitude and percent increase indicate where downstream critical
values may be at risk of sediment-laden flows or flash flooding from damaging thunderstorms; results
are presented in Table 3.
Rainfall-Runoff Peak Flows (WEPPcloud-PeP): Similar to the Wildcat5 model, the WEPPcloud-Post-Fire
Erosion (WEPP-PEP) model was used to estimate increases in rainfall-runoff peak flows in watersheds of
approximately 500 to 5,000 acres. These results provide a second layer to the rainfall-runoff peak flow
analysis; results are presented in Table 3.
Table 3: Comparison of post-fire peak flows across the three models used: WEPP-PEP, Wildcat, and USGS
Regional Regression. The percent increase was calculated from the pre-fire 2-Year recurrence interval peak flow.
WILDCAT USGS USGS
% WEPP 5yr, 1hr 2-YR RI 2-Yr RI
High 5 yr, 1hr Post- Pre- Post-
& Post-Fire Fire Fire Fire USGS WEPP WILDCAT
Area Mod Q Q Q Q 2-Yr RI 5yr 1hr 5yr 1hr
ID Name (ac) SBS (CFS) (CFS) (CFS) (CFS) % Incr. % Incr. % Incr.
1 Denver Cr 2323 63 211 134 36 58 63 492 278
2 Kauffman Cr 3130 73 124 200 54 94 73 130 269
3 Trail Cr 1 1869 45 48 94 27 39 45 78 252
4 Bronco Cr 1440 56 61 82 21 32 56 195 297
5 Elk Cr 1830 72 82 135 35 59 72 137 292
6 Mulstay Cr 1434 63 68 97 31 51 63 119 211
7 Trout Cr 3309 50 97 168 52 78 50 87 222
8 Gold Run 3430 48 115 184 52 77 48 123 255
9 Trail Cr 2 3699 56 145 235 63 99 56 130 272
12 South Supply Cr 2349 86 153 316 44 81 86 250 622
13 Middle Supply Cr 960 63 53 133 27 45 63 95 388
27 Kinney Cr 1229 63 75 105 32 52 63 136 231
33 Willow Cr HWs 5408 44 308 341 121 175 44 155 182
34 Stillwater Cr 123 4858 59 150 366 93 147 59 62 294
35 Sawmill Gulch 2413 24 50 51 37 45 24 38 39
37 Ethel Cr 2682 55 171 153 37 57 55 362 314
38 Hay Park Cr 2221 86 249 243 28 51 86 801 780
40 Trib CO River 646 0 8 12 15 15 0 n/a n/a
Page 7 of 941 Middle Fork Cr 4979 21 190 114 60 73 21 217 90
In addition to the increase in volume of flows, the time for summer thunderstorm flood flows to reach a
downstream area will also be more rapid following the fire. This shorter duration in the time to flood
flows being translated downstream means less time to respond to these flood events.
It is important to note that these are relative increases for summer thunderstorms as this is when the
most damaging post-fire effects are likely to occur. In addition to these model results, there is a chance
that debris will collect and create debris dams which can subsequently dislodge during later storms.
These debris dam outburst floods could pose additional risk to life and property downstream during high
flow events since they carry logs, rocks, and a deluge of mud.
Sediment, minerals and nutrients from the burned area will likely pose an elevated threat to municipal
water quality for the next several years as widespread soil erosion as well as ash and sediment
deposition are expected throughout and downstream of the burned area. These processes will
attenuate over time and should recover to pre-fire conditions over the next several years. The greatest
impacts are most likely to occur in the first year or two following the fire, though a low-probability
rainstorm any time in the next 5-7 years will have the potential of triggering a major
erosion/sedimentation runoff event. Over this time, there is high potential for degradation of source
water quality.
Debris Flow Potential
Debris flows are among the most hazardous consequences of rainfall on burned hillslopes. Debris flows
pose a hazard distinct from other sediment-laden flows because of their unique destructive power.
Debris flows can occur with little warning and can exert great impact loads on objects in their paths.
Even small debris flows can strip vegetation, block drainage ways, damage structures, and endanger
human life. Additionally, sediment delivery from debris flows can “bulk” the volume of flood flows,
creating an even greater downstream flooding hazard. The U.S. Geological Survey (USGS) used the SBS
to inform their model and the results of the modelling effort are available at:
https://landslides.usgs.gov/hazards/postfire_debrisflow/
Treatments to Address Post-fire Threats
Due to the limited burned area access, the BAER assessment focused on actions to mitigate post-fire
threats to human life and safety, trails, and campgrounds. Unacceptable risk to these critical Forest
Service values were identified and treatments to reduce the risk to an acceptable level were identified.
Additional assessment and treatment prescriptions for the road system, noxious weeds, cultural sites,
and other critical values will be conducted in the spring of 2021 when the burned area is accessible.
Human Life and Safety
Threats to human life and safety have increased due to hazard trees. Even trees that still appear green
may have a weakened root system due to smoldering at the base of the tree. In addition, hazard trees
Page 8 of 9are likely to fall across motorized trails creating a safety hazard for fast moving vehicles. Warning signs
will be placed to warn Forest users of these hazards. Some roads and motorized trails will be closed
until a detailed evaluation of the risk from hazard trees and/or increased flood and debris flow potential
can be conducted and hazards reduced to an acceptable level.
Recreation Facilities
Actions will be taken to improve trail drainage to accommodate increased erosion and flood flows so
that debris and flood flows are able to pass without washing out the trail prism. The campground
infrastructure from approximately 20 low-lying sites in the west loop of Denver Creek Campground will
be temporarily removed and the sites closed to prevent damage or loss during flood events in Willow
Creek.
CONCLUSION
The BAER team has identified some imminent threats to critical values based limited field assessment.
The assessment was conducted using the best available methods to analyze the potential for erosion,
flooding, debris flows, and hazard trees in a rapid manner. Options for reducing post-fire peak stream
flows, soil erosion, and debris flow potential are limited due to the nature of the burn and slope
characteristics. As a result, treatment recommendations focus on mitigation measures to minimize
life/safety threats, and damage to property. These mitigations include road and trail closures, trail
stabilization, campground treatments, and warning signs. Additional road and weed treatments, and
other treatments to protect natural and cultural resources may be identified during a follow up
assessment in the spring/early summer 2021.
The soil erosion, hydrology, and debris flow modelling results indicate that post-fire there will be an
increase in watershed response. This means:
• Increased erosion and sedimentation
• Areas that flood or have debris flows pre-fire will have larger magnitude events
• Areas that occasionally flood or have debris flows will see more frequent events
• Areas that previously did not have streamflow or debris flows may now flood or have debris
flows
The findings provide information that can assist other agencies and landowners in preparing for post-fire
threats. The US Forest Service will continue to participate in interagency efforts to address threats
resulting from the East Troublesome Fire.
References
Parson, Annette; Robichaud, Peter R.; Lewis, Sarah A.; Napper, Carolyn; Clark, Jess T. 2010. Field guide
for mapping post-fire soil burn severity. Gen. Tech. Rep. RMRS-GTR-243. Fort Collins, CO: U.S.
Department of Agriculture, Forest Service, Rocky Mountain Research Station. 49 p.
Page 9 of 9You can also read