FIRE BACKGROUND - InciWeb
←
→
Page content transcription
If your browser does not render page correctly, please read the page content below
East Troublesome Fire Forest Service Burned Area Emergency Response
                         Executive Summary- Update
          Arapaho-Roosevelt and Medicine Bow-Routt National Forests
                                 July 21, 2021

FIRE BACKGROUND
The East Troublesome Fire was reported the afternoon of October 14 on a portion of the Arapaho
National Forest administered by the Medicine Bow-Routt National Forests; the cause is still under
investigation. Within three days, high winds and low humidity allowed the fire to spread to over 10,000
acres. Between Oct. 20-23, the fire exploded from 18,550 acres to 187,964 acres. The fire crossed
Highway 125 on the afternoon of Oct. 21 and spread eastward into the Rocky Mountain National Park
on Oct. 22, crossing the Continental Divide, and reaching the western edge of Estes Park on Oct. 23.

The fire was fueled by wide-spread drought, numerous dead and down beetle-killed trees, red flag
weather conditions created by high winds and dry conditions, and poor humidity recovery overnight.
The combination of these factors led to unprecedented, wind-driven, active fire behavior with rapid
spread during the overnight hours. A winter storm from Saturday, Oct. 24 through the morning of Oct.
26 brought very cold temperatures, precipitation in the form of snow and lighter winds, resulting in a
dramatic drop in fire behavior with smoldering and reduced fire spread, resulting in a final total fire
acreage of 193,812. Impacted areas included the Arapaho & Roosevelt National Forests, Medicine Bow-
Routt National Forests, Bureau of Land Management, Rocky Mountain National Park, and private lands.

The BAER assessment for the East Troublesome fire was completed by two BAER teams. The National
Park Service (NPS) mobilized a team to assess the burned area within Rocky Mountain National Park,
which is approximately 23,000 acres of the total burned area. The US Forest Service (USFS) mobilized a
BAER team to assess the remaining portion of the burned area. This report will focus on the 171,209
acres assessed by the USFS BAER team.

Early season snowfall in Fall, 2020 prevented the USFS BAER team from conducting a field survey in
most of the burned area. In 2020, the USFS team mapped soil burn severity for the entire fire outside of
Rocky Mountain National Park and shared the soil burn severity information with agency partners. The
team documented potential issues with the accuracy of the 2020 soil burn severity map based on cloud
and/or smoke cover and lack of adequate field validation. In 2020, the assessment of threats to critical
values focused on human life/safety and trails on National Forest System (NFS) lands. The task of
updating and finalizing the assessment was resumed in late spring 2021. Work included updating the
soil burn severity map and watershed response model outputs, inventorying other critical Forest Service
values and making treatment recommendations.

                                               Page 1 of 11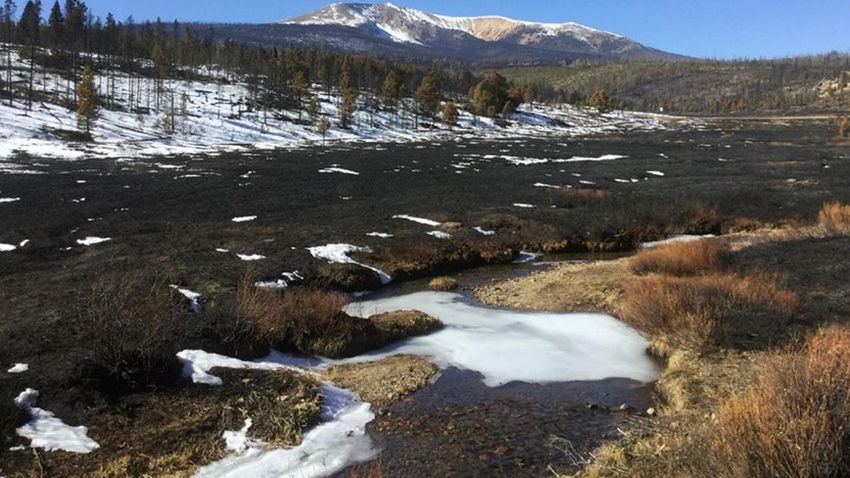
Figure 1: East Troublesome burn area partially obscured by snow. View is from the NFSR 123 bridge
over Pass Creek, looking north towards Parkview Mountain.

BAER PROCESS
USFS BAER assessments focus on imminent post-fire threats to life and safety, property, natural
resources, and cultural resources on NFS lands. Threats include determining where post-fire snowmelt
and precipitation events could increase runoff and flooding, erosion and sediment delivery, debris flows,
and high-risk areas for the spread of invasive weeds.

Hydrologists, soil scientists, engineers, recreation and weed specialists, archaeologists, wildlife and
fisheries biologists, and GIS support all contribute to the BAER assessment.

The first step in identifying post-fire threats is development of a Soil Burn Severity (SBS) map to
document the degree to which soil properties were impacted by the fire. Fire damaged soils have low
strength, high root mortality, and increased rates of water runoff and erosion. Soil burn severity is
classified according to the Field Guide for Mapping Soil Burn Severity (Parsons et al, 2010). Primary soil
characteristics considered in soil burn severity classification are forest floor cover, ash color, integrity of
roots, integrity of structure, and water repellency 1.

Areas of low and unburned SBS have minimal effects to soil properties, and therefore little to no post-
fire effects. Moderate SBS indicates that some soil properties have been affected and the duff and litter

1
    Water repellent soils have reduced infiltration which results in increased runoff

                                                        Page 2 of 11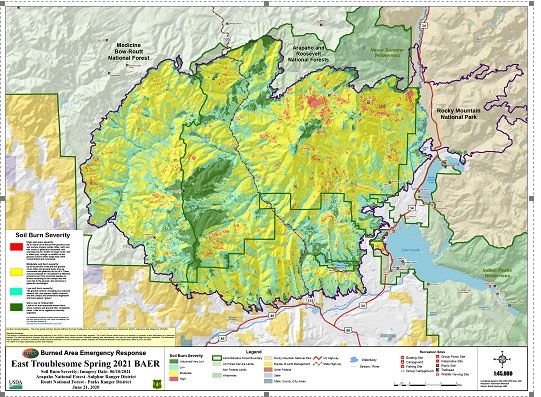
layer that acts as a sponge to absorb precipitation has mostly been consumed. High SBS areas have
significant alterations to soil properties such as complete consumption of littler and duff, loss of root
viability and changes to soil structure than often drive substantial watershed response including
increased erosion and runoff following precipitation events.

  Figure 2: Comparison of low soil burn severity with roots and structure (top of shovel) vs. high soil
            burn severity with no soil structure or roots to help bind soil (bottom of shovel)

The U.S. Forest Service Geospatial and Technology and Applications Center provided the BAER team
with an initial Burned Area Reflectance Classification (BARC) maps derived from satellite imagery that
compares pre and post fire images. The team conducted extensive field verification surveys in 2021 to
validate the BARC to create the final SBS map (Figure 3).

                                                 Page 3 of 11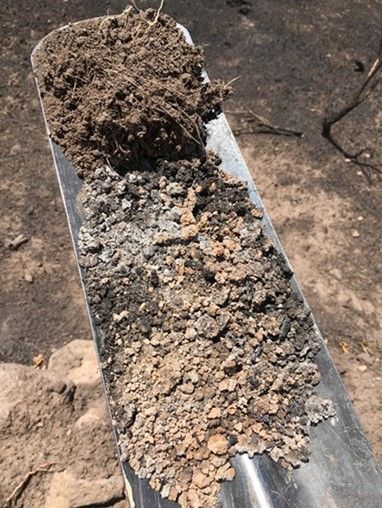
Figure 3. East Troublesome Spring 2021 Soil Burn Severity map

ANALYSIS SUMMARY
SOILS
Fire behavior, fire weather, forest type, and vegetation size and density influenced severity of impacts to
soil in the East Troublesome fire. The east portion of the fire experienced a running crown fire due to
the intense winds and was quickly cooled by a snow event. All the factors listed above influenced soil
burn severity. In many places mapped as moderate, soil structure and root health are largely intact but
erosion risk is greatly exacerbated due to loss of forest floor cover.

The SBS map was updated using a BARC image from June 10, 2021 and field validated June 10-11, 2021.
Field assessment was conducted the week of June 14, 2021 for all critical values except trails which were
assessed in the all 2020 effort.

Table 1: Acres of soil burn severity by ownership.
         Soil Burn        NFS          BLM         State           Private       Total      % within the
         Severity                                                                              BAER
                                                                                              Analysis
                                                                                             Perimeter
        Unburned       15,520       969           22.5           3951          20,462      12%
        Low            37,505       8026          382            10,138        56,050      33%
        Moderate       75,212       8618          388            5265          89,482      52%
        High           4,588        230           217            217           5075        3%
        Total          132,826      17843         17,842         19,570        171,070     100%

                                                Page 4 of 11
The BAER team members used the SBS as one input variable in models to estimate erosion potential,
changes in stream flows from snowmelt and summer thunderstorm events. The USGS used the SBS map
to model debris flow potential. The hydrologic models compare pre-fire conditions to predicted post-fire
conditions to determine relative changes as a result of the fire effects.
An estimated 55% of the area within the East Troublesome Fire perimeter had high or moderate SBS
indicating increased erosion and flood flow potential.
Erosion potential post-fire is contingent on a variety of site characteristics including soil texture, rock
fragment content, slope, soil burn severity and the distribution of soil burn severity. While higher rates
of erosion are anticipated on steep slopes with moderate or high soil burn severity, impacts to long term
soil productivity are not expected over most of the burned area. Increased erosion can result in
downstream sediment delivery that bulks flows and results in increased flooding effects. Increased
erosion can also block culverts and other infrastructure and degrade water quality.
HYDROLOGY
The East Troublesome Fire burned high elevation, snowmelt-dominated watersheds tributary to the
Upper Colorado River. Snowmelt peak flows occur each spring (April-June), followed by the summer
monsoon season (July-August), which brings short duration high intensity thunderstorms.
Watershed response within the burned area will likely include an initial flush of ash, rill and gully erosion
in headwater drainages and on steep slopes, areas with snowmelt peak flows elevated over 50% relative
to pre-fire, sediment-laden flash floods following high-intensity rain events, and potentially debris flows.
Water quality will be diminished during seasonal peak runoff, as well as after high-intensity summer
rains, due to elevated ash, fine sediment, and nutrient loading. This elevated post-fire response will
gradually diminish as vegetation and groundcover levels recover each growing season, although some
impacts including elevated snowmelt runoff are likely to persist for a decade or longer. The degree of
watershed response is commensurate with soil burn severity; Table 2 summarizes acres burned by sixth
level watershed.
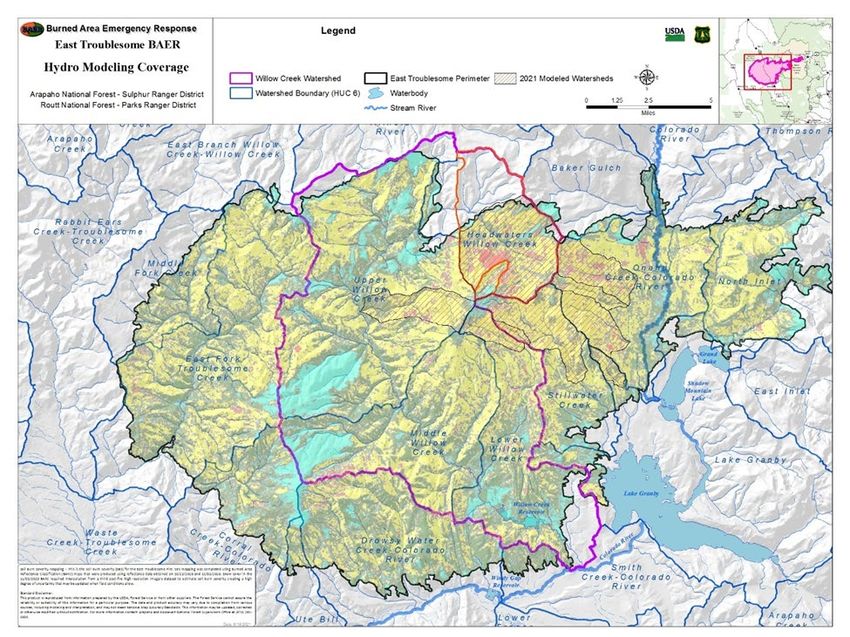
Table 2: June 2021 Soil Burn Severity by Modeled Catchments
WS_I Name Total Unburned Low Moderate High Mod/High Fall 2020
D acres % analysis
2 Kauffman Cr Outlet 3130 65 768 2169 127 73% 73%
11 Soda Cr at FB 651 4 253 391 3 61% 22%
12 South Supply Cr at 2346 5 188 2004 147 92% 86%
Confluence
13 Middle Supply Cr at 961 19 208 709 24 76% 63%
Confluence
14 N. Supply Cr at 120 1567 43 97 1100 302 89% 20%
Rd
Page 5 of 1116 Pass Cr Outlet 6161 908 1207 2918 82 49% 63%
17 Upper Willow Creek 8300 606 1274 4992 1067 73% 58%
18 Buffalo Cr Outlet 7324 2803 1941 2518 62 35% 47%
33 Willow Cr 5407 501 832 3278 559 71% 44%
Headwaters
34 Stillwater Cr above 4860 232 913 3611 103 76% 59%
123
Newly modeled catchments June 2021
WS_I Name Total Unburned Low Moderate High Mod/High Fall 2020
D acres % analysis
100 Trail Creek at 190.1 1247 150 175 850 71 74% -----
101 Upper Willow Creek 637 144 86 341 66 64% -----
at 123
104 Base of Willow Cr 11840 655 1299 5010 1067 51% -----
103 123 at Gilsonite 337 1 24 302 10 93% -----
Page 6 of 11Figure 4: June 2021 Wildcat5 modeled catchments for rainfall-runoff peak flow response to a 5-year, 1-
hour event.
Updated Comparison of Peak Flows
Additional modeling was completed for areas identified by the team during the June 2021 field
assessment as well as for some of the watersheds analyzed initially that had a significant change due to
the updated burn severity map. The same variables and methodology that were used in the original
report were used in the updates to reflect the changes in soil burn severity mapping.
Table 3: June 2021 Wildcat5 modeled catchments for rainfall-runoff peak flow response to a 5-year, 1-
hour event.
Modeled Watersheds -- Fall 2020 June 2021
Wildcat Peak Flow Wildcat Peak Flow
WS_ID Name Total Pre- Post- %Increase Pre- Post- %Increase
Drainage Fire Fire Fire Fire
Area (acres) (cfs) (cfs) (cfs) (cfs)
2 Kauffman Cr 3130 3.8 200 5150% 3.8 198 5111%
Outlet
11 Soda Cr at FB 653 7.8 36 361% 7.8 81.4 944%
12 South Supply Cr 2349 27.8 316 1038% 27.8 478 1619%
at Confluence
Page 7 of 1113 Middle Supply Cr 960 13.7 133 873% 13.7 154 1024%
at Confluence
14 N. Supply Cr at 1568 23 294 1178%
120 Rd
16 Pass Cr Outlet 6163 18.8 313 1568%
17 Upper Willow 8320 79 734 829%
Creek
18 Buffalo Cr Outlet 7296 4.5 177 3840%
33 Willow Cr 5408 61 341 461% 61 497 715%
Headwaters
34 Stillwater Cr 4858 48 366 662% 48 454 846%
above 123
Newly Modeled Catchments
WS_ID Name Total Pre- Post- %Increase Pre- Post- %Increase
Drainage Fire Fire Fire Fire
Area (acres) (cfs) (cfs) (cfs) (cfs)
102 Lowest Willow Cr 11840 -- -- -- 76 589 675%
at 123
103 NFSR 123 at 337 -- -- -- 2.8 38 1257%
Gilsonite
100 Trail creek at 1246 -- -- -- 7.2 110 1428%
190.1
101 Upper Willow 637 -- -- -- 11.59 89 668%
creek at 123
In addition to the increase in volume of flows, the time for summer thunderstorm flood flows to reach a
downstream area will also be more rapid following the fire. This shorter duration in the time to flood
flows being translated downstream means less time to respond to these flood events.
It is important to note that these are relative increases for summer thunderstorms as this is when the
most damaging post-fire effects are likely to occur. In addition to these model results, there is a chance
that debris will collect and create debris dams which can subsequently dislodge during later storms.
These debris dam outburst floods could pose additional risk to life and property downstream during high
flow events since they carry logs, rocks, and a deluge of mud.
Sediment, minerals and nutrients from the burned area will likely pose an elevated threat to municipal
water quality for the next several years as widespread soil erosion as well as ash and sediment
deposition are expected throughout and downstream of the burned area. These processes will
attenuate over time and should recover to pre-fire conditions over the next several years. The greatest
impacts are most likely to occur in the first year or two following the fire, though a low-probability
rainstorm any time in the next 5-7 years will have the potential of triggering a major
erosion/sedimentation runoff event. Over this time, there is high potential for degradation of source
water quality.
Page 8 of 11DEBRIS FLOW POTENTIAL
Debris flows are among the most hazardous consequences of rainfall on burned hillslopes. Debris flows
pose a hazard distinct from other sediment-laden flows because of their unique destructive power.
Debris flows can occur with little warning and can exert great impact loads on objects in their paths.
Even small debris flows can strip vegetation, block drainage ways, damage structures, and endanger
human life. Additionally, sediment delivery from debris flows can “bulk” the volume of flood flows,
creating an even greater downstream flooding hazard. The U.S. Geological Survey (USGS) used the SBS
to inform their model and the results of the modelling effort are available at:
https://landslides.usgs.gov/hazards/postfire_debrisflow/
Treatments to Address Post-fire Threats
Threats to human life and safety have increased due to hazard trees. Even trees that still appear green
may have a weakened root system due to smoldering at the base of the tree. In addition, hazard trees
are likely to fall across motorized trails creating a safety hazard for fast moving vehicles.
Threats to human life and safety have also increased due to increased flood and debris flow potential.
Closure and/or warning treatments are proposed at many locations throughout the burned area until
hazard trees risk can be evaluated and mitigated and/or until flooding/debris flows hazards are reduced
to an acceptable level through natural recovery of the burned hillslopes
Specific Developed Campground Recommendations:
• Infrastructure from approximately 20 low-lying sites in the west loop of Denver Creek
• Administrative closure of Denver Creek Campground
• Pumping a vault and sealing a vault toilet in Willow Creek Campground
Specific Dispersed Camping Recommendations:
High risk, based on hazardous trees and/or flooding/debris flow, was identified at dispersed campsites
throughout the burned area. Particular areas of concern included Highway 125, Stillwater Pass (NFSR
125) and Cabin Creek (NFSR 112). Risk ratings have not been completed for all dispersed camping
locations within or immediately downstream from the burned area.
Trail, Trailhead and Road Recommendations
• Stabilization treatments on roads and trails throughout the burned area
• Administrative closure of the Trail Creek Trailhead.
Natural Resources:
• Water on NFS lands within and downstream of the burn scar that is used for municipal and
agriculture supply is threatened due to potential water quality impacts from increased sediment
and nutrient loading following runoff producing events. Treatments are not recommended for
water quality on NFS lands as there are no cost-effective measures that would reduce the threat
to an acceptable level.
Page 9 of 11• Soil productivity in areas of high SBS is threatened by post-fire erosion and loss of soil horizons.
Soil hydrologic function in areas of moderate and high SBS is threatened due to the presence of
hydrophobic soils, loss of ground cover, and reduced infiltration.
• Suitable occupied Lynx habitat is threatened by the loss of vegetative cover across all burn
severities.
• Native plant communities are at risk of invasion by known populations of Colorado State listed
noxious and other non-native invasive weeds adjacent to areas of high and moderate SBS, and
areas disturbed by suppression activities. Noxious weed infestations pose a serious threat to the
composition, structure, and function of native plant communities. In noxious weed ecology, any
reduction in competition for available nutrients, space, or light is considered an advantage to
noxious weeds growth and establishment. Treatments to minimize noxious weed establishment
or spread are recommended.
• Green lineage cutthroat trout: The Green lineage was decoupled from the ESA protections
under the Greenback Cutthroat Trout in mid-2020 due to further genetic analysis. The Green
Lineage was newly identified and is currently under scientific evaluation and has yet to be
classified. There are only three pure genetic strains of Green Lineage within the Colorado
Headwaters and the Trail creek population within the East Troublesome burn scar is the only
population directly located off the Colorado River. The other two populations are isolated on the
Williams Fork drainage and contain a different set of haplotypes. Although the Green lineage
has been decoupled from ESA protections it is in fact a smaller genetic population than the ESA
listed Greenback. Once the Green lineage has been scientifically identified it will most likely
qualify for separate ESA protections within the next year
• Cultural and Heritage Resources: Treatments for protection of cultural and heritage resources
are recommended in one location
A. Emergency Treatment Objectives: Raise awareness of post-fire hazards throughout the burned
area, minimize post-fire damage to NFS trails and NFS campground infrastructure, restrict access to
NFS roads with untreated threats that pose unacceptable risks to human life and safety.
a. Minimize threats to life/safety to the extent possible through administrative closures,
signing, monitoring, and pumping/sealing of the exposed vault toilet.
b. Storm proof and stabilize roads to protect Forest Service property. These treatments would
also help minimize road/trail adjacent erosion and associated impacts on water quality and
fish habitat.
c. Promote revegetation and soil stabilization by native plant communities through early
detection/rapid response surveys to minimize the spread of Colorado State listed noxious
weeds.
d. Strategically address the highest concern areas of the green lineage cutthroat trout habitat
in Trail Creek with focused streambank stabilization with support from Trout Unlimited
e. Minimize threats to cultural resources from risk of looting and disturbance
Page 10 of 11CONCLUSION
The BAER team identified threats to BAER critical values based limited field assessment. The assessment
was conducted using the best available methods to analyze the potential for erosion, flooding, debris
flows, and hazard trees in a rapid manner. Options for reducing post-fire peak stream flows, soil
erosion, and debris flow potential are limited due to the nature of the burn and slope characteristics. As
a result, treatment recommendations focus on mitigation measures to minimize life/safety threats, and
damage to property. These mitigations include road and trail closures, trail stabilization, campground
treatments, and warning signs.
The soil erosion, hydrology, and debris flow modelling results indicate that post-fire there will be an
increase in watershed response. This means:
• Increased erosion and sedimentation
• Areas that flood or have debris flows pre-fire will have larger magnitude events
• Areas that occasionally flood or have debris flows will see more frequent events
• Areas that previously did not have streamflow or debris flows may now flood or have debris
flows
The findings provide information that can assist other agencies and landowners in preparing for post-fire
threats. The US Forest Service will continue to participate in interagency efforts to address threats
resulting from the East Troublesome Fire.
References
Parson, Annette; Robichaud, Peter R.; Lewis, Sarah A.; Napper, Carolyn; Clark, Jess T. 2010. Field guide
for mapping post-fire soil burn severity. Gen. Tech. Rep. RMRS-GTR-243. Fort Collins, CO: U.S.
Department of Agriculture, Forest Service, Rocky Mountain Research Station. 49 p.
Page 11 of 11You can also read