Enhanced Paracetamol Oxidation and Its Determination using Electrochemically Activated Glassy Carbon Electrode
←
→
Page content transcription
If your browser does not render page correctly, please read the page content below
Int. J. Electrochem. Sci., 16 (2021) 150864, doi: 10.20964/2021.01.12

 International Journal of
 ELECTROCHEMICAL
 SCIENCE
 www.electrochemsci.org

Enhanced Paracetamol Oxidation and Its Determination using
Electrochemically Activated Glassy Carbon Electrode
Mohamed I. Awad1,2,*, Ali Sayqal1, Rami Adel Pashameah1, Ahmed M. Hameed1, Moataz Morad1,
Hussain Alessa1, Reem Kamal Shah1, Mohammed. A. Kassem1,2,*
1
 Chemistry Department, Faculty of Applied Science, Umm Al-Qura University, Makkah, Saudi
Arabia.
2
 Chemistry Department, Faculty of Science, Cairo University, Cairo, Egypt
3
 Chemistry Department, Faculty of Science, Benha University, Benha13518, Egypt
*
 E-mail: miawad@uqu.edu.sa & mawad70@yahoo.com, maa_kassem@hotmail.com &
makassem@uqu.edu.sa

Received: 25 August 2020 / Accepted: 11 October 2020 / Published: 30 November 2020

Herein, the impact of electroactivation of glassy carbon electrode on the paracetamol drug
electrochemical behavior is investigated for the first time. The morphology of the GC electrode surface
was investigated using SEM. The extent of oxidation of GC as well as the pH of the supporting
electrolyte has been investigated. The oxidation of GC results in the formation of several containing
oxygen functional groups which increases with increasing the number of potential cycles for oxidation.
The extent of GC oxidation was quantified by calculating the number of surface’s quinone units (S), as
calculated from the voltammetric measurements in 1.0 M H2SO4. Then the S was correlated with the
extent of electrocatalytic oxidation of PC. Based on the voltammetric studies, it has been found that the
oxidation of PC is controlled by both diffusion and adsorption processes. Finally, the activation of GC
electrode was used for the quantitative determination of PC in a suitable rectilinear range with a standard
devation and relataive standard deviation (RSD) of 0.17 mM and 2.4%, respictively.

Keywords: Oxidized glassy carbon; Paracetamol; Cyclic voltammetry; Electrocatalysis; Analytical
determination.

1. INTRODUCTION

 Paracetamol (p-hydroxy acetanilide or N-acetyl-p-aminophenol, PC) of chemical structure
shown in Fig. 1, is one of analgesic and antipyretic compound commonly used for fever and headache
relief in addition to several applications in pharmaceutical industries. It can be used as an alternative to
aspirin for some patients who cannot tolerate aspirin. Overdoses are associated with hepatotoxicity and
can cause organ failure within short time, so it be used in the safe dose. It is believed that the man source
Int. J. Electrochem. Sci., Vol. 16, 2021 2

of danger of acetaminophen is its metabolite whereas it is considered as actual hepatotoxic agent [1-9].
Accumulation of toxic metabolites often accompany overdose of PC, and a severe hepatotoxicity and
ephrotoxicity occur. Thus, for the sake of quality assurance of pharmaceutical industry and related
industries, estimation of PC is vital for the healthcare industry [10-12]. Several methods have been
reported for the estimation of PC in drug formulations. It includes, for instance, spectrophotometry [13-
15], reverse phase high performance liquid chromatography [16-24], capillary electrophoresis [25-27]
and chemiluminescence [28-30]. Some of these methods are tedious as they require several preliminary
steps before the determination, and some is time-consuming. In general, these methods are not suitable
for the routine analysis of PC as they require expensive instruments or the need of sample pre-treatment
steps for analysis. Thus, simpler procedures performed in relatively shorter times without using
numerous chemicals are preferable. Electrochemical methods found their way for analysis of
paracetamol specially at modified electrodes which introduce the selectivity as well as the sensitivity
[31-35]. PC is electrochemically active, and its response has been reported on various types of electrodes,
both solid, bare and modified as well as mercury electrode [36-40]. However, the behavior at
electrochemically activated glassy carbon (EAGC) electrode has not been reported, even though glassy
carbon electrode is the first choice for such species as it is characterized by wide potential range as well
as the simple control of the surface and the possible derivatization with functional groups. The present
study aims at the enhancement of PC oxidation in aqueous solutions using EAGC, and the subsequent
application for PC quantification. The extent of oxidation of GC as well as the pH of the supporting
electrolyte has been investigated.

 H
 N CH3

 O
 HO
 Figure 1. The structure of paracetamol (PC)

2. EXPERIMENTAL

2.1. Materials and Reagents:

 Chemicals used were of analytical grade and were used as received. Sulfuric acid (H2SO4, Omni
Trace Ultra) was purchased from Sigma-Aldrich. Sodium hydroxide (NaOH, 99.8% purity) was
purchased from BDH. Phosphate buffer solutions of different pHs were prepared using
NaH2PO4/Na2HPO4 couples according to the reported method [41]. A pure powder of paracetamol (PC)
was gifted from Amriya Pharmaceutical Industries, Egypt. A freshly stock solution of suitable
Int. J. Electrochem. Sci., Vol. 16, 2021 3

concentration of PC was prepared by dissolving a suitable amount of the powder in bi-distilled water.
Prior to electrochemical measurements, electrolyte solutions were de-aerated by N2-bubbling.

2.2. Glassy carbon electrodes electroactivation:

 The GC electrode (3 mm diameter) was mechanically polished with fine alumina powder and then
rinsed with water before sonication process to remove physically adsorbed species. Then, GC was either
used directly or after being electro-activated. The activation process was optimized by cycling of
potential in the potential range -0.2 to 2 V for suitable number of potential cycles. The anodic oxidation
of GC in H2SO4 increase the percentage of functional groups bearing –OH group onto the electrode
surface. The electrode after oxidation was assigned as GCox.

2.3. Measurements:

 Electrochemical measurements were performed using a PGSTAT30 potentiostat/galvanostat
(Netherlands) controlled by General Purpose Electrochemical Systems (GPES) and Frequency Response
Analyzer (FRA) software. A conventional three-electrode cell of around 20 ml and equipped with
Ag/AgCl (KCl sat.) reference electrode and Pt spiral wire auxiliary electrode was used for the cyclic
voltammetric measurements. All electrochemical measurements were conducted under nitrogen
saturated solutions. SEM was taken using a Hitachi microscope of accelerating voltage of 20 kV.

3. RESULTS AND DISCUSSION

 SEM images of bare and oxidized glassy carbon electrodes are shown in Fig. 2. GC was oxidized
by applying 5 potential cycles in 0.5 M H2SO4 as mentioned in the experimental section. As shown in
the figure, the roughness of the oxidized electrode is significant (image b) compared with the bare GC
electrode of smooth surface (image a). It has been reported that roughness could be used as indication
of the extent of oxidation of the GC electrode, increasing the extent of oxidation increases the roughness
of GC[42]. The oxidation of GC electrode results in the formation of several oxygen-containing
functional groups that changes the surface properties of the thus oxidized electrode [37].
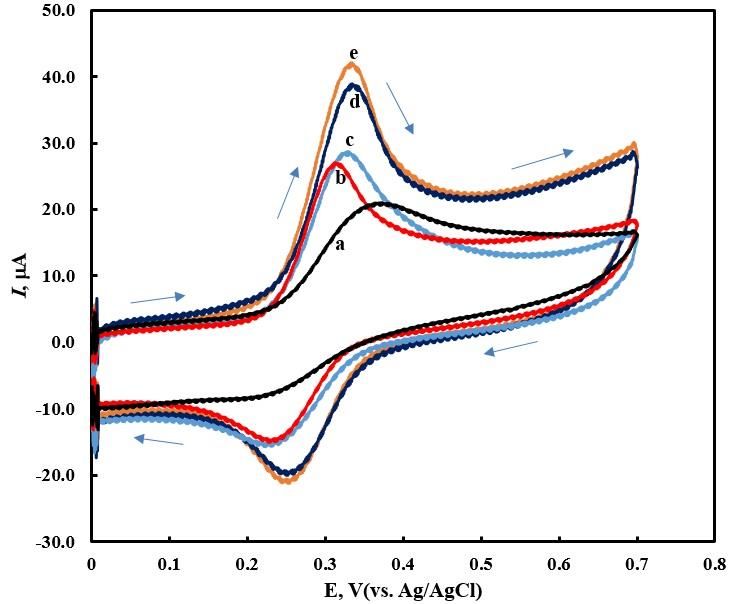
Int. J. Electrochem. Sci., Vol. 16, 2021 4

 a

 b

Figure 2. SEM images for (a) bare GC and (b) GCox electrodes. GC was oxidized by applying 5
 potential cycles in 0.5 M H2SO4 with scan rate 100 mV/s.

3.1. The electrochemical behavior of PC on activated GC

 Fig. 3 shows cyclic voltammograms obtained at (a) bare and (b-e) electrochemically pretreated
GC in PB containing 12.5 mM PC. GC was oxidized as mentioned in the experimental section.
Parameters extracted from this figure are given in Table 1. Interestingly, the response of PC obtained at
bare GC is significantly changed at the oxidized GC; the anodic peak is obtained at relatively large
potential (curve a) compared with that obtained at the electrochemically pretreated one (curves b-e) and
the cathodic one at ca. 0.2 V is ill defined as previously reported [43]. At the oxidized GC, the well
anodic peak coupled with the well-defined cathodic one is revealed. The extent of catalysis is dependent
on the extent of oxidation of the GC electrode; when the electrode is subjected to one potential cycles
for activation the response of PC is significantly changed, and the ∆E = 85 mV is obtained. Upon
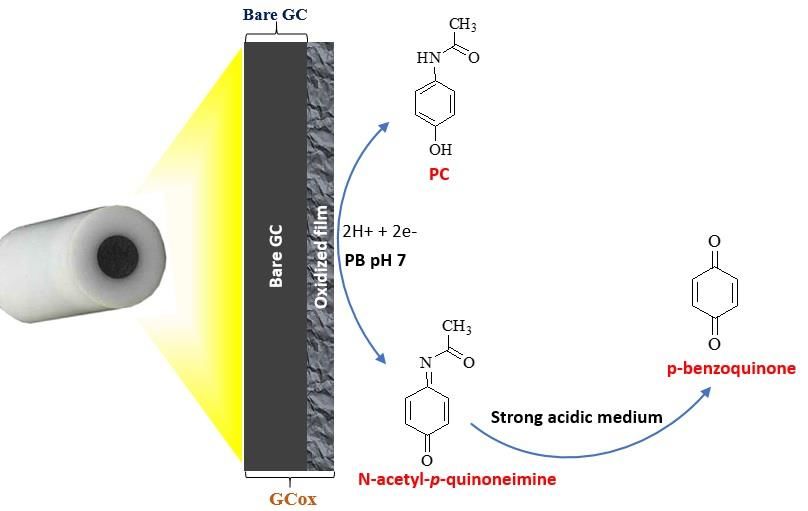
Int. J. Electrochem. Sci., Vol. 16, 2021 5

increasing the number of potential cycles for oxidation of GC electrode, the behavior does not change
significantly with respect to ∆E = 85 mV.

Figure 3. CVs obtained at a) bare and (b-d) oxidized GC in PB (pH 7) containing 12.5 mM PC. Number
 of cycles used for oxidation of GC was b) one, c) three, d) five and e) six cycles. Scan rate = 100
 mV/sec.

 However, the current response for the oxidation and reduction continue in increasing. This points
to the increase in the surface area of the electrode. A point which is useful for the sake of analysis of PC.
It seems that the oxidation of GC results in the formation of several oxygen-contained functional groups
upon the first cycles and with increasing the number of cycles, the roughness increases resulting in
increasing the surface area as represented above in the SEM images. Under the studied pH range, PC is
oxidized to N-acetyl-p-quinoneimine in an electrochemical step involving two electrons and two protons
to produce N-acetyl-p-quinoneimine. This step is followed by non-electrochemical reaction steps which
are pH dependent. In strongly acidic media, PC is oxidized finally to benzoquinone [43-45] according
to the following mechanism:
Int. J. Electrochem. Sci., Vol. 16, 2021 6

 Figure 4. The proposed mechanism for oxidation of PC at GCox

Table 1. Electrochemical parameters for oxidation of PC at GC and GCox in PB at scan rate 100 mV/s

 Electrodes Ipa (μA) Ipc (μA) Epa (mV) Epc (mV) ∆E (mV)
 Bare GC 14.5 6.1 365 200 165
 GCox (one cycle) 22.0 13.1 320 235 85
 GCox (3 cycles) 24.3 13.6 340 235 105
 GCox (5 cycles) 31.3 15.9 335 250 85
 GCox (6 cycles) 34.1 17.0 335 250 85

 The enhancement of the PC electrochemical behavior is thought to be related to the quinone (Q)
functional groups formed upon oxidation of GC. It has been reported that quinone functional groups to
enhance the oxygen reduction [46]. However, in the present case the confined quinone redox couple
appears at much lower positive potential compared with the electrooxidation peak of PC. Thus, the
possible reason for activation of PC oxidation is the enhancement of interaction of PC with the generated
functional group on the GC surface, possibly by hydrogen bond. Similar behavior reported that adsorbed
quinone mediates some reactions. However, for the same reaction the Q groups generated
electrochemically did not mediate it [47,48]. The increase in enhancement upon increasing the extent of
oxidation is related to the number of surface quinone units, calculated by the following equation;
Int. J. Electrochem. Sci., Vol. 16, 2021 7

 = … … … (1)

 where N is the Avogadro number, n is the number of electrons included in the following
equation:
 Q + 2H + + 2e ↔ QH2 … … … . (2)
 and F is the Faraday constant. C is the charge obtained by the integration of the CV of the
(Q/QH2) redox couple obtained for the oxidized GC in 1 M H2SO4 (data are not shown). The number
of active sites for GC oxidized by one, three, five and six cycles equals 7.0×10¹⁴, 9.3×10¹⁴, 2.1×10¹⁶ and
2.7×10¹⁶, respectively. The relation between log S and the anodic peak current for paracetamol is given
in Fig. 5. It is clearly shown that the peak current is related to the number of surface’s quinone units.
It becomes clear that electrooxidation of GC critically catalyzes the oxidation of PC via the generation
of functional groups which enhances the interaction of PC with such generated groups, as represented in
the following scheme;

 Scheme 1. The proposed interaction between PC and the generated functional groups on GCox
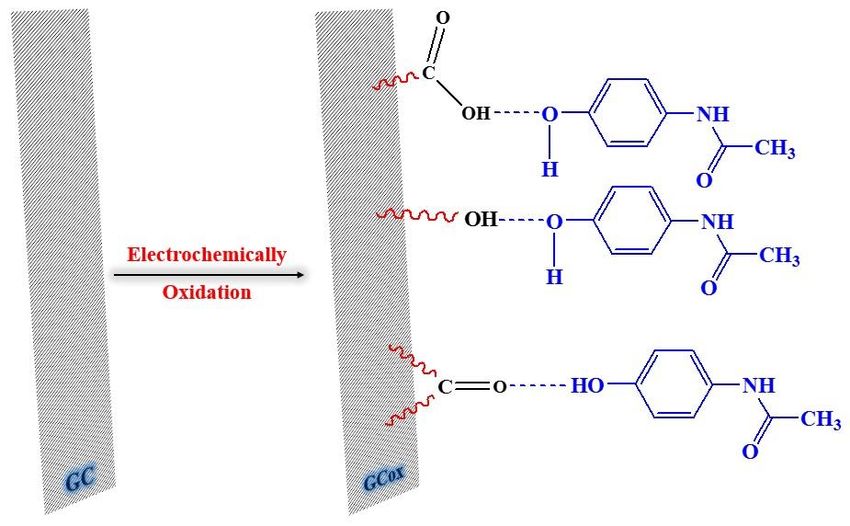
Int. J. Electrochem. Sci., Vol. 16, 2021 8

 42

 40

 38

 36

 34
 Ipa

 32

 30

 28

 26

 24
 14.6 14.8 15.0 15.2 15.4 15.6 15.8 16.0 16.2 16.4 16.6

 log S
Figure 5. The relation between log S and the anodic peak current for PC. The number of surface’s
 quinone units (S) was estimated using equation 1.

Figure 6. Effect of pH on the voltammetric behaviour of 12.5 mM PC at GCox. GC was oxidized by
 applying 5 potential cycles in 0.5 M H2SO4 with scan rate 100 mV/s.
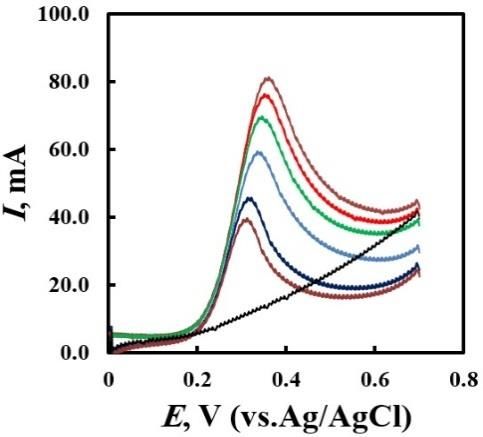
Int. J. Electrochem. Sci., Vol. 16, 2021 9

3.2. The influence of pH on the electrochemical behavior of PC on activated GC

 The pH of the supporting electrolyte for reaction containing protons as a reactant or product is
critical in electroanalysis as the pH largely affects the electrode–solution interface, and consequently the
kinetics of the charge transfer process. The pH dependence of PC oxidation at GCox is shown in Fig. 6
and Table 2. Within the studied pH range, the redox couple is obtained with a negative shift as expected
upon increasing the pH. The peak current for the anodic (Ipa) and cathodic (Ipc) peaks as well as their
peak potentials are plotted against pH and shown as Figs. 7 and 8, respectively. In Fig. 7, it is obvious
that, the effect on the anodic peak current is larger compared with that of the cathodic one. Ipc decreases
regularly with increasing the pH, while the dependence of Ipc on the pH is not regular. Regarding the
effect on the peak potential, parallel straight lines for both peaks are obtained. At pH 7, an acceptable
response is obtained, and thus it was chosen for the following measurements. Linear relationships of the
peak potential of PC as a function of pH following Nernst’s equation;
 2.3
 p = formal − pH … … . . (3)

 where m and n represent the number of protons and electrons, respectively. Slopes around 60
mV per pH is obtained for both peaks indicating Nernstian behaviour. This indicates that PC oxidation
is accompanied by the transfer of (2e-/2H+), i.e., equal number of protons and electrons [49]. It has been
reported that PC oxidation and the oxidation product is pH dependant. It is noteworthy to mention the
large dependence of Ipa/Ipc on the pH (shown in Fig. 9); it changes from around 1.4 at pH 9.9 to 5.8 at
pH 3. This points to the increase in the reversibility with decreasing pH as reflected on the significant
change in the values of the difference in peak potential between anodic and cathodic peaks (∆E); it equals
80 mV at pH 9.9 and 60 mV at pH 3.

 80
 Ipa
 60 Ipc

 40
 I, mA

 20

 0

 -20

 -40
 0 2 4 6 8 10 12
 pH

Figure 7. Relation between pH and peak currents for 12.5 mM PC at GCox activated by five oxidation
 cycles. Data were extracted from Fig 6.
Int. J. Electrochem. Sci., Vol. 16, 2021 10

 0.8

 0.7
 y = -0.0652x + 0.9123

 0.6

 0.5
 Ep, V

 0.4
 y = -0.0663x + 0.8481

 0.3

 0.2
 Epa
 Epc
 0.1

 0
 0 2 4 6 8 10 12
 pH

Figure 8. Relation between pH and peak potentials for 12.5 mM PC at GCox activated by five oxidation
 cycles. Data were extracted from Fig 6.

 7

 6

 5

 4
 Ipa/Ipc
 3

 2

 1

 0
 0 2 4 6 8 10 12
 pH

Figure 9. Relation between pH and Ipa/Ipc for 12.5 mM PC on GCox after five oxidation cycles. Data
 were extracted from Fig 6.
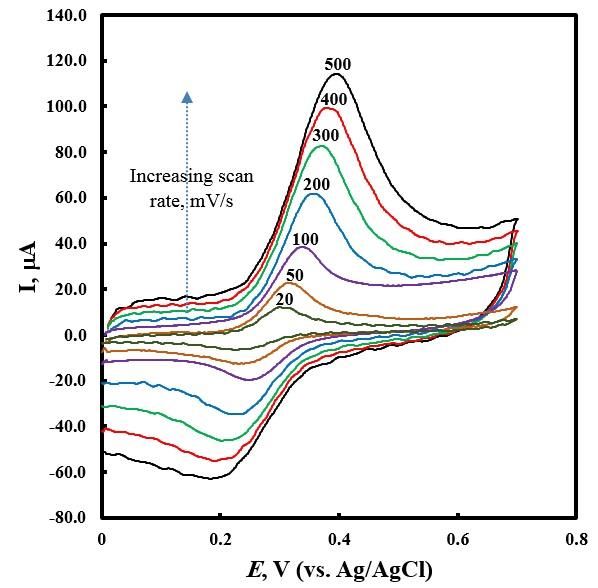
Int. J. Electrochem. Sci., Vol. 16, 2021 11

Table 2. Relation between pH and peak potentials and peak currents for electrochemical behavior of PC
 on GCox at scan rate 100 mV/s

 pH Ipa Ipc Epa Epc Epa-Epc Ipa/Ipc log(Ipa/Ipc)
 3.0 66.3 11.4 0.7 0.64 60 5.82 0.76
 4.1 60.6 18.3 0.65 0.59 60 3.3 0.52
 4.8 44.6 20.6 0.615 0.54 75 2.17 0.34
 5.9 53.7 26.3 0.54 0.45 90 2.04 0.31
 6.5 54.9 27.4 0.5 0.41 90 2 0.3
 7.0 43.4 19.4 0.45 0.38 70 2.24 0.35
 7.6 46.9 22.9 0.4 0.34 60 2.05 0.31
 8.0 44.6 24 0.37 0.33 40 1.85 0.27
 8.7 37.7 19.4 0.35 0.26 90 1.94 0.29
 9.9 26.3 18.3 0.275 0.2 75 1.44 0.16

3.3. Scan rate dependence

Figure 10. CVs obtained at EAGC electrode in PB (pH 7) containing 12.5 mM PC at various scan rates
 (Numbers of scan rates are in mV/s). GC was oxidized by applying 5 potential cycles in 0.5 M
 H2SO4 with scan rate 100 mV/s.
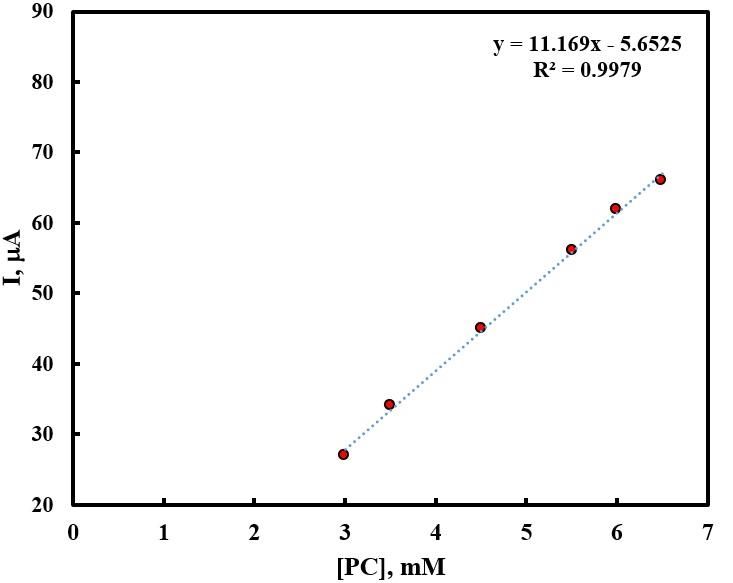
Int. J. Electrochem. Sci., Vol. 16, 2021 12

 2.2
 y = 0.6495x + 0.2258
 2.0 R² = 0.9959
 log Ia
 log Ic
 1.8

 1.6
 log I, mA

 1.4
 y = 0.6499x - 0.0976
 R² = 0.9813
 1.2

 1.0

 0.8

 0.6

 0.4
 1.5 1.7 1.9 2.1 2.3 2.5 2.7 2.9
 log u , mV/s

 Figure 11. Relation between log scan rate and log peak current. Data were taken from Figure 10.

 The effect of scan rate on the peak current and peak potential is utilized in evaluating the type of
mass transport process as well as the electrode kinetics for a certain reaction. Fig. 10 shows the effect of
scan rate on CVs of the oxidation of PC at GCox electrode. As clearly shown, anodic and cathodic peaks
are shifted with increasing the scan rate pointing that the process is not reversible one. The log-log plot
for Ipa and scan rate is shown in Fig. 11. The peak current dependence on scan rate is linear. The linear
regression equation was = 0.6495 + 0.2258 with a correction coefficient of 0.9959. Based on the
obtained equation, a slope of 0.6495 reveals that the process is controlled by both diffusion and
adsorption processes with the former is the predominant.

3.4 Electroanalytical determination of PC using the oxidized GC

 Under the above optimum EAGC electrode, Fig. 12 represented the calibration curve for the
determination of PC (inset, the linear sweep voltammetry (LSV) for the determination of PC at different
concentrations). The linear dynamic range for the determination of PC was found to be 3.0-6.5 mM with
a good correlation coeffecient R2 = 0.9979. To measure the precision of the developed method, both
standard devation and relataive standard deviation (RSD) for five mesaurments for 7.0 mM PC were
calculated and found to be 0.17 mM and 2.4%, respectrively. The regresion equation for this method is
as the following:

 I(µA) =11.169 [PC](mM) – 5.6525 …….(4)
Int. J. Electrochem. Sci., Vol. 16, 2021 13

 To test the validity of the proposed method and its significence, F-test was performed by
comparing the variance of our method with that of reference one [31], at 95% confidence level. Results
as seen in Table 3 indicated that results obtained by the present methods are significant.

Figure 12. Calibration curve for determination of PC using EAGC. (Inset, the linear sweep
 voltammetry). GC was oxidized by applying 5 potential cycles in 0.5 M H 2SO4 with scan rate
 100 mV/s.

Table 3. Parameters for the electrochemical determination of PC by GCox electrode using LSV.

 Parameters PC
 Type of buffer Phosphate
 pH 7.0
 Potential of measurment, V 0.3-0.35
 Scan rate, mV/s 100
 Linear concentration range, mM 3.0-6.5
 Regression equationa
 Slope, µA/mM 11.169
 Intercept, µA -5.6525
Int. J. Electrochem. Sci., Vol. 16, 2021 14

 Correlation coefficient, R2 0.9979
 Standard deviation, SD (n=5), mM 0.17
 b
 Relative Standard deviation, RSD , % 2.4
 LOD, mM 0.281
 LOQ, mM 0.842
 SD of slope 0.19
 SD of intercept 0.95
 F-testc 3.11
 a
 I(µA) =slope [PC](mM) ± Intercept
 b
 Average of five consecutive measurements.
 c
 The theoretical value for F at n = (8,5) at 95% confidence level is 6.09

4. CONCLUSIONS

 Using EAGC electrode, paracetamol oxidation was significantly enhanced. The
electrooxidation of GC electrode in 0.5 M H2SO4 changed the electrode surface by the formation
of several oxygen-containing functional groups that changes the surface properties of the thus
oxidized electrode. The electrooxidation of PC using this electrode was found to be controlled
by both diffusion and adsorption processes. A correlation of the electroactivity of EAGC
electrode with the number of generated quinone sited is figured. Next, EAGC was successfully
used for the determination of PC.

ACKNOWLEDGEMENT
The Authors would like to thank the Deanship of Scientific Research at Umm Al-Qura University for
supporting this work by Grant Code: 19-SCI-1-01-0004

References

1. C.M. Kuskur, K.B. Swamy and H. Jayadevappa, Ionics, 25 (2019) 1845.
2. N. Wangfuengkanagul and O. Chailapakul, J. Pharm. Biomed. Anal., 28 (2002) 841.
3. P.I. Dargan and A.L. Jones, Drug Saf., 25 (2002) 625.
4. Y. Nademi, S.A. Iranagh, A. Yousefpour, S.Z. Mousavi and H. Modarress J Chem Sci, 126 (2014)
 637.
5. J.G. O’Grady, G.J.M. Alexander and K.M. Hayllar, Gastroenterology, 97 (1989) 439.
6. J.A. Vale and A.T. Proudfoot, Lancet, 346 (1995) 547.
7. D.C. Dahlin, G.T. Miwa, A.Y.H. Lu and S.D. Nelson, Proc. Natl. Acad. Sci., 81 (1984) 1327.
8. H. Dong, R.L. Haining, K.E. Thummel, A.E. Rettie and S.D. Nelson, Drug Metab. Dispos., 28
 (2000) 1397.
9. Q. Wan, X. Wang, F. Yu, X. Wang and N. Yang, J. Appl. Electrochem., 39 (2009) 785.
10. M.M. Soliman, M.A. Nassan and T.A. Ismail, BMC Complementary Altern. Med., 14 (2014) 457.
11. W.J. Holubek, S. Kalman and R.S. Hoffman, Hepatology, 43 (2006) 880.
12. H. Jaeschke, C.D. Williams, A. Ramachandran and M.L. Bajt, Liver Int., 32 (2012) 8.
13. N. Erk and F. Onour, Anal. Lett., 30 (1997) 1201.
14. B.D.A. Elik and N. Altunay, Microchem. J., 154 (2020) 104645.
15. S. Glavanović, M. Glavanović and V. Tomišić, Spectrochim. Acta, Part A, 15715 (2016) 258.
Int. J. Electrochem. Sci., Vol. 16, 2021 15

16. F. Canada-Canada, A. Espinosa-Mansilla, A.M. and de la Pena, J. Sep. Sci., 30 (2007) 1242.
17. K. Srogi, Anal. Lett., 39 (2006) 231.
18. İ.M. Palabıyık and F. Onur, Chroma, 66 (2007) 93.
19. S. Abbasi, S.A. Haeri and S. Sajjadifar, Microchem. J., 146 (2019) 106.
20. M. Attimarad, Pharm. Methods, 2 (2011) 61.
21. E.A. Abdelaleem, I.A. Naguib, E.S. Hassan and N.W. Ali, J. Pharm. Biomed. Anal., 11410 (2015)
 22.
22. E.A. Abdelaleem and N.S. Abdelwahab, Anal. Methods, 5 (2013) 541.
23. I. Baranowska and B. Kowalski, Water Air Soil Pollut., 211 (2010) 417.
24. G.M. Hadad, S. Emara and W.M. Mahmoud, Talanta, 79 (2009) 1360.
25. T. Perez-Ruiz, C. Martinez-Lozano, V. Tomas and R. Galera, J. Pharm. Biomed. Anal., 38 (2005)
 87.
26. A. Alnajjar, H.H. AbuSeada and A.M. Idris, Talanta, 72 (2007) 842.
27. S. Azhagvuel and R. Sekar, J. Pharm. Biomed. Anal., 43 (2007) 873.
28. J. Lopez-Flores, M.L.F.D. Cordova and A. Molina-Diaz, Anal. Chim. Acta, 535 (2005) 161.
29. E. Wolyniec, U. Niedzwiedzka and A. Kojlo, Instrum. Sci. Technol., 35 (2007) 219.
30. A. Waseem, M. Yaqoob and A. Nabi, Talanta, 71 (2007) 56.
31. M. Boopathi, M.S. Won and Y.B. Shim, Anal. Chim. Acta, 512 (2004) 191.
32. R.M. Carvalho, R.S. Freire, S. Rath and L.T. Kubota, J. Pharm. Biomed. Anal., 34 (2004) 871.
33. C.L. Devi and S.S. Narayanan, Ionics, 25 (2019) 2323.
34. S.F. Wang, F. Xie and R.F. Hu, Sens. Actuators B, 123 (2007) 495.
35. R.N. Goyal and S.P. Singh, Electrochim. Acta, 51 (2006) 3008.
36. Z.A. Alothman, N. Bukhari, S.M. Wabaidur and S. Haider, Sens. Actuators B, 146 (2010) 314.
37. F.G. Bidkorbeh, S. Shahrokhian, A. Mohammadi and R. Dinarvand, Electrochim. Acta, 55 (2010)
 2752.
38. N.F. Atta and M.F. El-Kady, Talanta, 79 (2009) 639.
39. F.S. Felix, C.M.A. Brett and L. Angnes, J. Pharm. Biomed. Anal., 43 (2007) 1622.
40. E. Keskin and A.S. Ertürk, Ionics 24 (2018) 4043.
41. D.D. Perrin, B. Dempsey, Buffers for pH and Metal Ion Control, John Wiley & Sons, Inc, New
 York (1974) pp 138.
42. A. Dekanski, J. Stevanovic, R. Stevanovic, B.Z. Nikolic and V.M. Jovanovic, Carbon, 39 (2001)
 1195.
43. D.J. Miner, J.R. Rice, R.M. Riggin and P.T. Kissinger, Anal. Chem., 53 (1981) 2258.
44. P.T. Kissinger, D.A. Roston, J.J. Van Benschoten, J.Y. Lewis and W.R. Heineman, J. Chem. Educ.,
 60 (1983) 772.
45. T. Skeika, M.F. de Faria, N. Nagata and C.A. Pessoa, J. Braz. Chem. Soc., 19 (2008) 762.
46. M.G. Sullivan, R. Kotz and O. Haas, J. Electrochem. Soc., 2000, 147 (2000) 308.
47. T. Nagoaka, T. Sakai, K. Ogura and T. Yoshino, Anal. Chem. 58 (1986) 1953 .
48. T. Nagoaka and T. Yoshino, Anal. Chem., 58 (1986) 1037.
49. A.J. Bard, L.R. Faulkner, Electrochemical Methods, Fundamentals and Applications, 2nd ed.; John
 Wiley & Sons: New York, 2000.

© 2021 The Authors. Published by ESG (www.electrochemsci.org). This article is an open access
article distributed under the terms and conditions of the Creative Commons Attribution license
(http://creativecommons.org/licenses/by/4.0/).
You can also read