Global warming, and ice sheets
←
→
Page content transcription
If your browser does not render page correctly, please read the page content below
Global warming, and ice sheets*

                                    Richard B. Alley

                          Evan Pugh Professor of Geosciences
                           The Pennsylvania State University
                           University Park, PA 16802, USA
                                  ph. 814-863-1700
                                  fax 814-863-7823
                                    rba6@psu.edu

The United States National Academy of Sciences, the United Nations Intergovernmental
Panel on Climate Change, and numerous leading professional societies such as the
American Geophysical Union and the American Association for the Advancement of
Science Board of Directors, have attested to the strong scientific evidence that human
activities (especially burning of fossil fuels) are changing the composition of the
atmosphere, that this is contributing to warming and other climate changes, that the
changes so far are small compared to those expected under business as usual, that impacts
of the climate changes on economies and ecosystems will be notable, and that mitigation
and adaptation options exist. Here, in question-and-answer format, is a synopsis of some
of the relevant science, with special attention to ice sheets.

*Any opinions, findings, conclusions, or recommendations expressed in this document
are those of the author and do not necessarily reflect those of the Pennsylvania State
University, the Intergovernmental Panel on Climate Change, the National Research
Council, or other organizations. My remarks neither prejudge nor presage the contents of
Synthesis and Assessment Product 1.2 of the U.S. Climate Change Science Program, now
in preparation and for which I am one of the lead authors. Some of the figures attached
may be subject to copyright protection.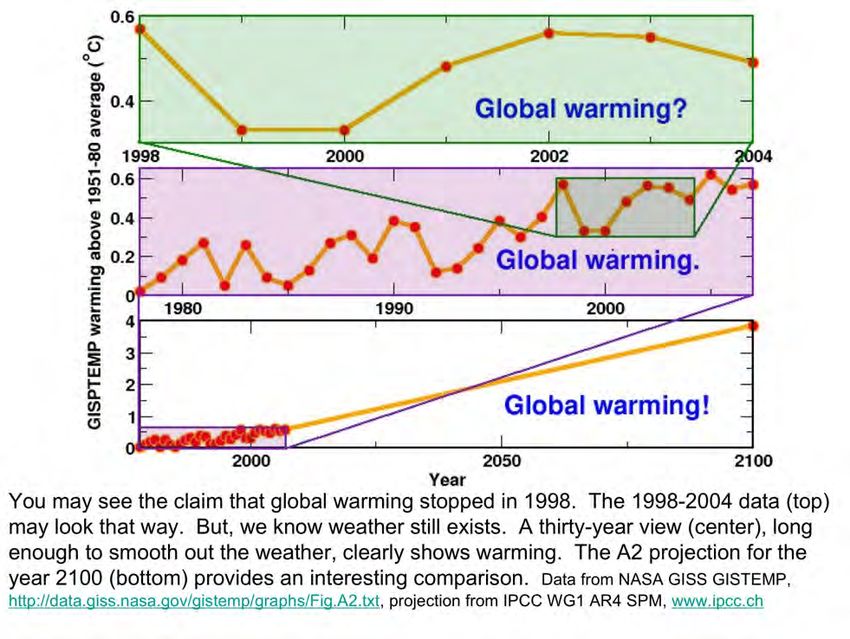
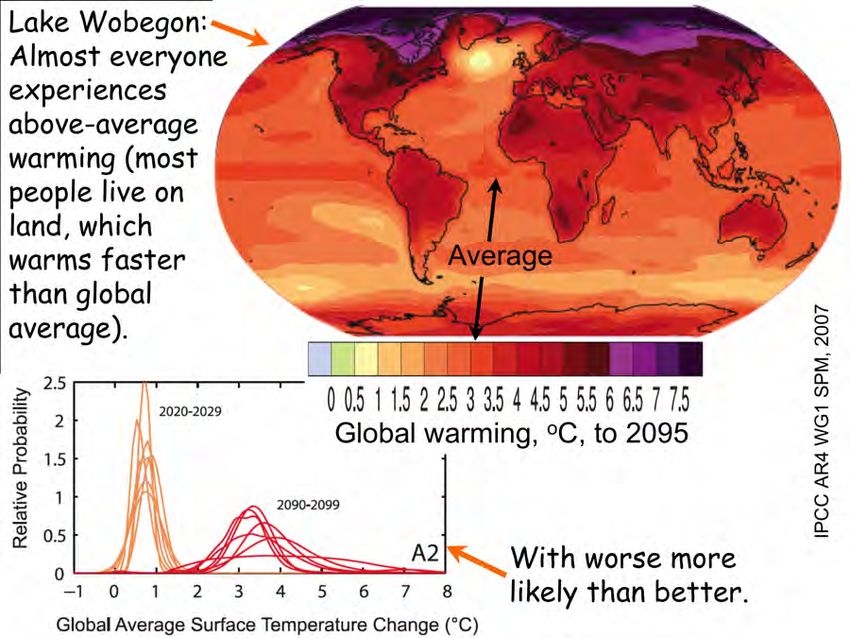
GLOBAL WARMING

Q1: Is climate changing?
A: Yes. Warming is shown by thermometers in the air, including those far from cities,
thermometers taken aloft by balloons or looking down from space, thermometers placed
in the ocean and in boreholes in rock, and by changes in where and when biological
events happen and ice thaws. Note that weather still exists—chilly days and weeks do
happen, and a La Nina event in the Pacific or other natural events can make a whole year
colder than the previous one. But if you take any of the major measures of global
temperature, and any time long enough to smooth out the bumps from weather, you find
that warming is occurring.

Figure 1. History of globally averaged surface temperature, showing a six-year interval
(top) that is too short to average over the weather, a thirty-year interval (center) that
reveals the recent warming, and a comparison of these recent changes to changes that
may occur this century.
Q2: Climate has always changed. What’s the big deal now?
A: Indeed, natural changes have happened, with continental drift altering atmospheric
CO2 over tens of millions of years, wiggles in the orbit causing ice ages and CO2 changes
over tens of thousands of years, and other natural changes. Earth and life are still here. If
we didn’t have a special concern for humans, and for the other species that we know,
climate change might not be a big deal.

Figure 2. Shown here is the history of three trace gases that warm the planet (carbon
dioxide or CO2, nitrous oxide and methane) over the last thousand years, together with
“acid rain” that cools the planet, from the IPCC WG1 Third Assessment Report in 2003.
Further back in time, natural changes have occurred in these, and in the climate, but the
recent changes are mostly due to us. Water vapor is not shown, although it is an
important greenhouse gas. Water vapor put into the air rains or snows out quickly, in just
over a week on average, so we cannot put it up fast enough to make much difference.
The only way we know to change water vapor a lot is to change the temperature, because
warmer air picks up more water vapor from the ocean.
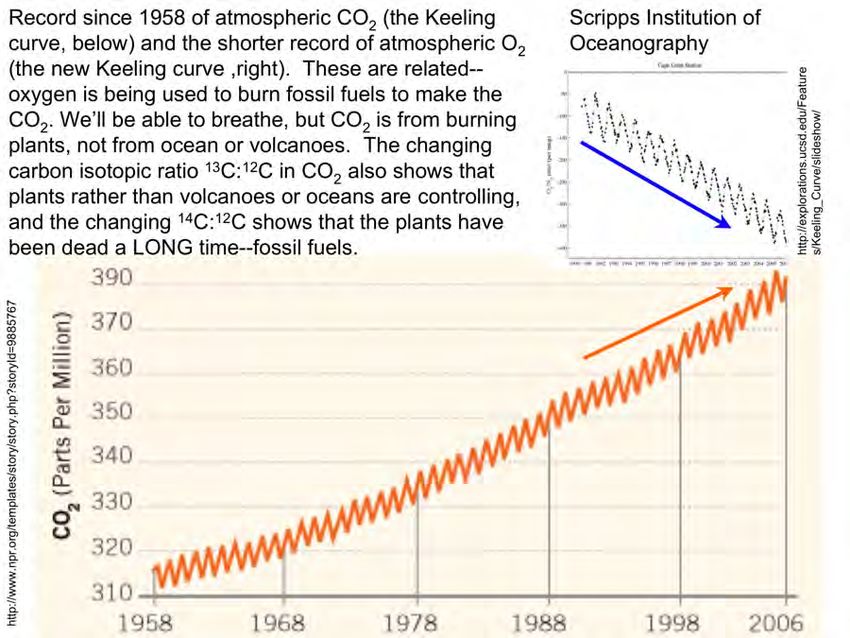
Q3: So why blame the recent changes on us?
A: The human cause of rising CO2 is very clear—we know from oil-tanker shipments and
coal trains how much fossil fuel is being burned, burning uses oxygen and the drop in
atmospheric oxygen is of the size expected to explain the burning (but with plenty of
oxygen left to breathe), and other isotopic indicators agree that we are responsible for the
rising CO2. The warming effect of CO2 has been known for over a century, and was
clarified especially well by military research linked to World War II—the hot exhaust
makes a target of a high-altitude bomber but must be viewed through the “haze” of CO2
and other greenhouse gases in the atmosphere, so the US military did a really good job of
studying the interactions of gases and heat radiation. And, the warming now has the
“fingerprint” of CO2—where and when the climate changed was following a natural
pattern in the early part of the 20th century, but switched to a mostly human pattern more
recently.

Figure 3A. The bottom of this figure shows the recent rise in CO2. If the CO2 comes
from burning, rather than from volcanoes or the ocean, then O2 in the atmosphere should
be dropping to supply the O2 in the CO2. The upper panel shows the dropping oxygen.
Charles David Keeling (CO2), and Ralph Keeling (O2), both of the Scripps Institution of
Oceanography, generated the curves.
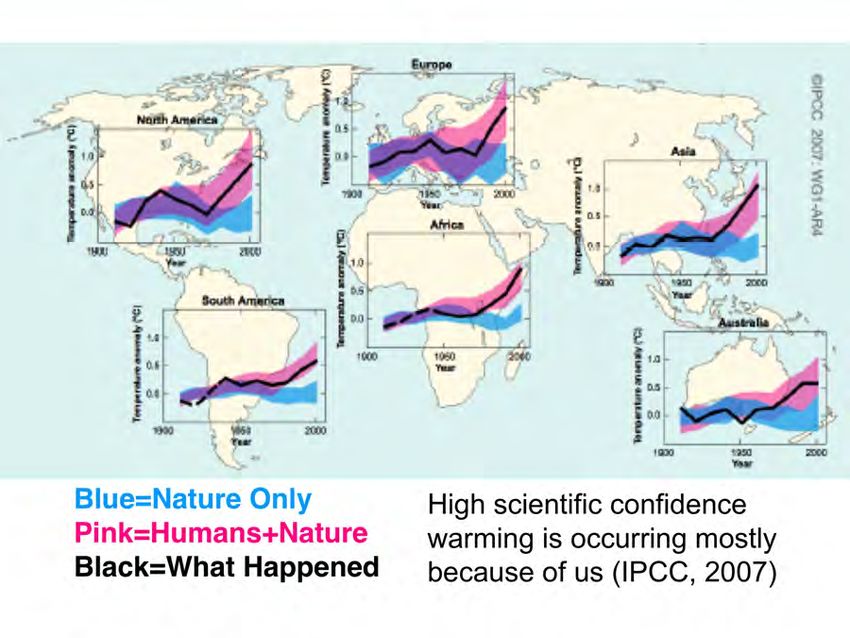
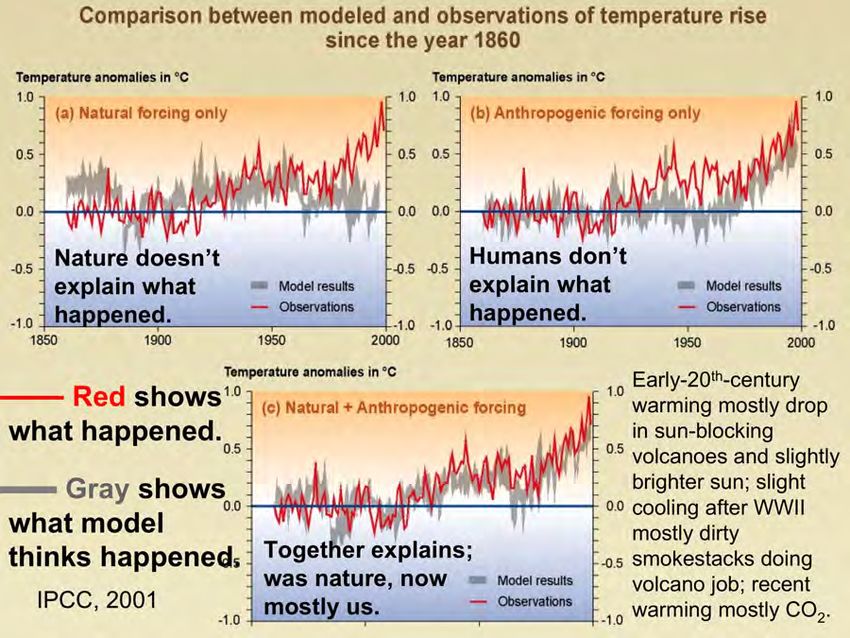
Figure 3B. The “fingerprint” of changing climate in time and space looks like that
expected from human influence recently, but from natural influence further back in time
before there were so many humans doing so much. This figure from the IPCC WG1
Third Assessment Report, 2001, summarizes part of the “attribution” exercise. The red in
each panel is the history of global average surface temperature from 1860 to 2000. The
gray is model output. For the upper left, the model was told only about the natural causes
of climate change. The latter part of the cool Little Ice Age in the late 1800s had a lot of
sun-blocking volcanic action and a slightly dim sun, with warming in the early 20th
century as these returned to normal. These do not explain the more-recent changes, but
the sun-blocking effect of our post-WWII dirty smokestacks doing the volcano job, and
the warming effect of our CO2, together explain the more-recent changes (upper right), so
that nature and humans are sufficient to explain the whole history (bottom). Similar
fingerprinting exercises look at the pattern of climate change across the surface of the
planet, and going up in the atmosphere, and similarly find that humans are now primarily
responsible, with high scientific confidence.
Q4: But isn’t the claim about human causes based on untested computer models?
A: No. Very simple, fundamental physic principles point to the human influence at least
since the latter part of the 20th century—temperature has been rising as expected for CO2,
at a time when satellites show that the sun has not been getting brighter, and other likely
causes of climate change are similarly not contributing to warming. Computer models
are used to provide additional support for the role of CO2 in warming, but those models
are tested extensively, with the model-builders checking themselves many, many times
and finding much skill. (“Do our models agree with fundamental physical law? When
given simple problems for which we already know the answer, do our models get it
correct? Do our models reproduce climate changes of the past, for times hotter and colder
than the present, without “cheating” by “tuning” the model to give the right answer?”)

Figure 4. Our understanding of the climate system is now rather good, and the models
show a lot of skill, reconstructing the history of climate change if given information on
human and natural causes of change, but failing to reconstruct the history of climate
change from natural causes alone. This is the updated version of the previous figure,
from the IPCC WG1 AR4 SPM, in 2007. The models have NOT been “tuned” to match
the history of climate change. Instead, any model tuning that is required is focused on
matching the climate for one time interval. One of the tests of the models is whether they
can then match the changing climate over time. As shown here, the models are now
skillful not only for the globe, but also for smaller regions. Modeling has been going on
long enough to show that earlier projections have been skillful (e.g., Rahmstorf et al.,
Science, 2007).
Q5: But aren’t the human-caused changes in climate small?
A: Yes. Although the recent warming is scientifically unequivocal, and has caused other
changes in the Earth system noticed by many people, other people who are not paying
close attention may not have noticed, and not every point on the planet has warmed. But,
the planet is still warming from what we have done already (the ocean takes a while to
heat up), and there is enough fossil fuel left to make a much bigger perturbation to the
planet than what we have done so far, with much bigger warming expected as a result.
We have just started down this path.

Figure 5A. Plotted properly, the recent rise in CO2 looks very impressive, because it is far
larger and faster than the changes of the previous millennium, and far larger than our
uncertainties in estimating that history. But if we continue working hard to find and burn
fossil fuels, the coming changes could be much, much larger than those that have
occurred so far. We’re not sure how high CO2 might go; this graph goes up to 1000
ppmv, but something above 2000 ppmv is not impossible. The effect of CO2 is such that
each doubling has roughly the same influence on temperature, so moving from the pre-
human level of ~280 ppmv to 560 ppmv will cause some warming (probably 5-6oF at
equilibrium), with an additional doubling (to 1120 ppmv) needed to get another 5-6oF,
and one more doubling (to 2240 ppmv) not impossible, to give another 5-6oF warming.
If CO2 comes down really rapidly, the full warming won’t be realized.
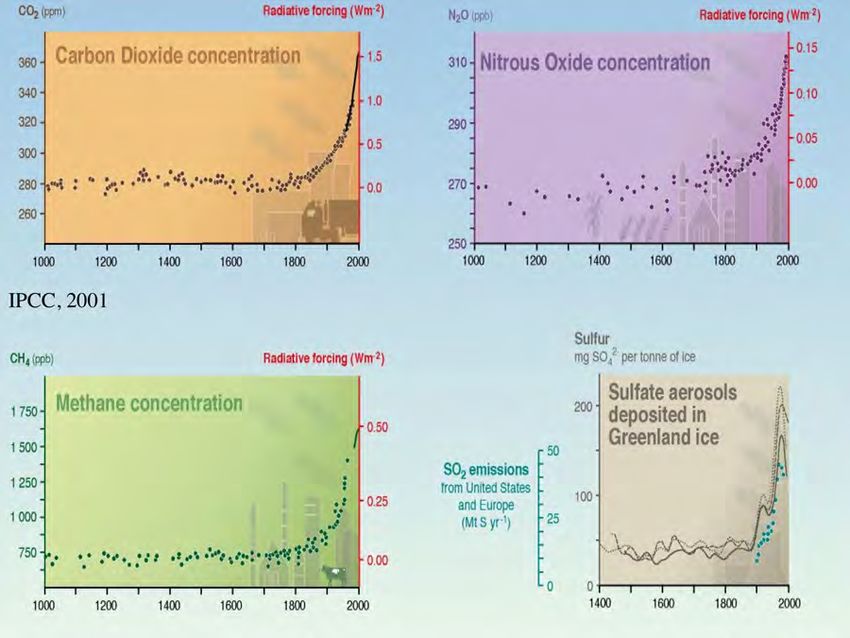
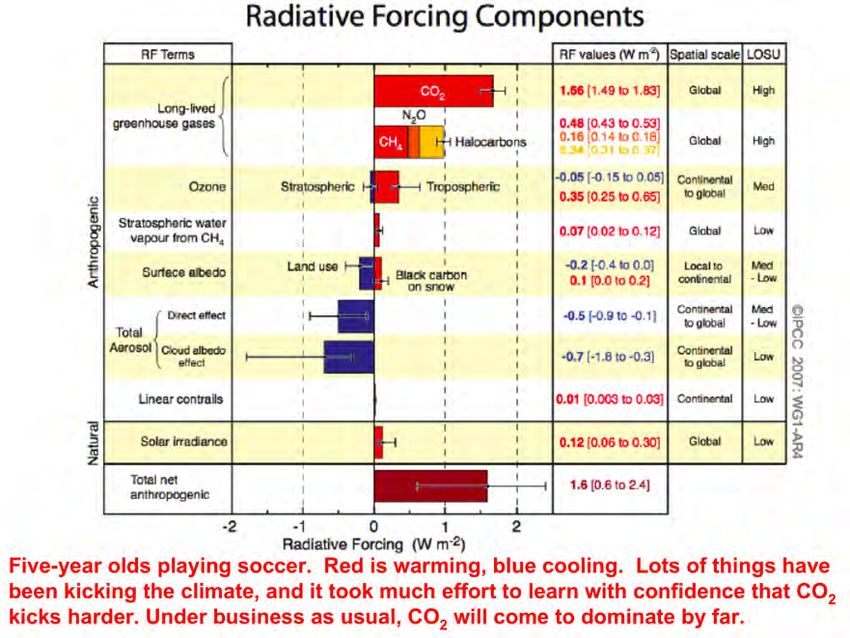
Figure 5B. Particles (aerosols) or water vapor put into the lower part of the atmosphere
stay for a week or two before falling out, methane may last a decade or so, contrails an
afternoon, but much of the CO2 will stay up for centuries or longer. If we continue to
raise CO2, it will come to dominate over the other causes of climate change. The human
contributions so far (plus the very small solar contribution) are shown here, in a figure
from the IPCC WG1 AR4 SPM.
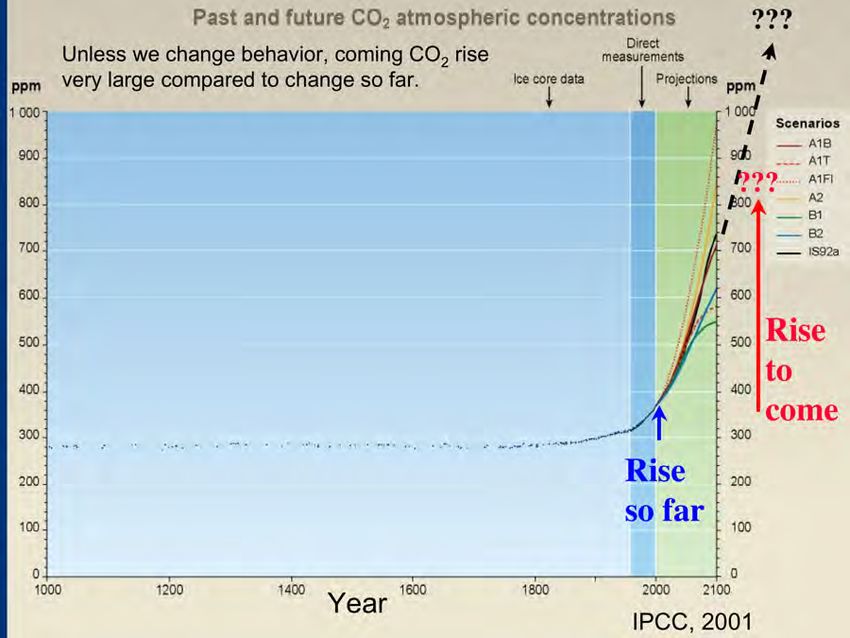
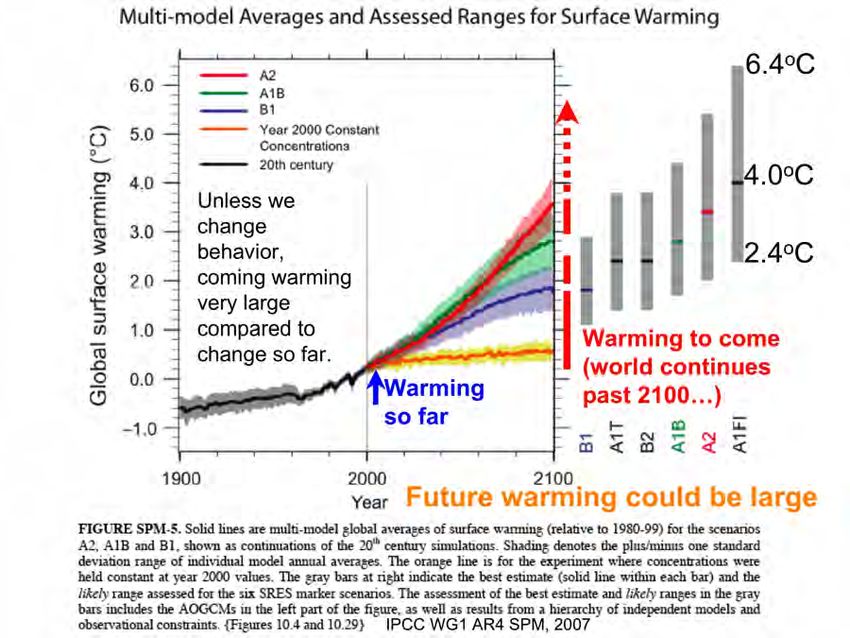
Figure 5C. The warming so far, while scientifically unequivocal, has not been noticed by
everyone everywhere, and cold days do still occur. If we continue business as usual, the
warming is expected to become much larger. The lower orange curve is the warming “in
the pipeline” if the atmospheric composition were stabilized now. The other curves are
the warming for various scenarios of future emissions. Uncertainties arise from what we
don’t know about nature, and what we don’t know about human behavior, with human
behavior more important than nature now. As noted in the figure, the world does not end
in the year 2100, and all of the curves are rising as they cross 2100. Also notice that the
uncertainties are mostly on the more-warming side of the central estimates.
Q6: But what if you’re wrong, and the warming is natural?
A: If nature is causing warming, is that a reason to turn up the thermostat? The climate
over the last century has moved a bit like a soccer ball in a game of five-year-olds as
noted with Figure 5B, and while CO2 has been the most forceful kicker, sun and
volcanoes and particles from smokestacks and other players have also moved the ball
around the field, so it has taken a while for the scientists watching to gain confidence that
CO2 is the prime mover. But under business as usual, CO2 is expected to grow in
strength without a coupled increase in the strength of the other players. Let one of the
five-year-olds grow to become a member of the US national soccer team while the rest of
the kids stay the same size and strength, and you have much more confidence which way
the ball will go. Let CO2 grow unchecked into the future, without beefing up any of the
other players, and the influence of the CO2 will similarly grow.

Figure 6. The globally averaged surface temperature rise is often reported, but that may
be misleading, because the land is expected to warm more than the ocean, and we mostly
live on the land. The uncertainties are also such that the warming may be less than
indicated here, but there is more possibility of a larger warming than of a smaller
warming.
ICE SHEETS.

Q7: Why all this excitement about the Antarctic and Greenland Ice Sheets, when they are
changing only a little bit?
A: Sea level has been rising just over an inch per decade recently, primarily because the
recent warming is causing ocean water to expand, and mountain glaciers in Alaska,
Patagonia, the Alps and elsewhere to melt. Although measurements show that the big ice
sheets of Greenland and Antarctica are contributing to the sea-level rise, they are still not
the major players. But, the ice sheets grossly dominate possible sea-level rise because
they are so big. The little warming that has happened so far seems to have caused a little
melting of the big ice sheets, so if more warming occurs, many people would like to
know whether more sea-level rise will result.

Q8: Haven’t the ice sheets survived warming in the past?
A: Yes. The ice sheets have grown when the climate cooled, and shrunk when the
climate warmed. For a little warming, the shrinkage seems to have been small; for too
much warming, the Greenland ice sheet seems to have largely or completely disappeared,
and even more warming seems to have done the same to parts or all of the Antarctic ice
sheet. Unfortunately, just how much warming is “too much” remains unclear. We might
reach a temperature this century that, if maintained, would melt the Greenland ice sheet
and important parts of the Antarctic ice.

Q9: But won’t that melting take a long time?
A: Yes, although we don’t know how long. Drop an ice cube in a glass of tea, and unless
you put the glass in the freezer, the ice cube is doomed, after a while. Too much
warming, and Greenland’s ice will melt, but such a large “ice cube” will not melt quickly.
However, Greenland and coastal Antarctica have also exhibited flow instabilities. At
places including the Larsen B Ice Shelf along the Antarctic Peninsula, Pine Island Bay in
West Antarctica, and Jakobshavn Glacier in Greenland, warming has caused shrinkage or
break-up of floating extensions of the ice sheet called ice shelves, “unplugging” the not-
yet-floating ice behind to flow faster (as much as eight-fold) to the sea to make icebergs.
Although loss of the floating ice shelves did not raise sea level, the delivery of additional
icebergs from the flow acceleration did raise sea level. In Greenland, additional
meltwater has reached the bed of the ice sheet to lubricate faster flow that lowers more of
the ice into warmer air. In considering these processes, the UN IPCC in 2007 wrote
“understanding of these effects is too limited to… provide a best estimate or an upper
bound for sea level rise”. (So, the IPCC did not somehow reduce their estimate of total
sea-level rise.) Even so, losing an ice sheet is not expected in decades, although whether
centuries or millennia, and how many of each, we just don’t know. Notice that the
ongoing sea-level rise of just over an inch per decade contributes to coastal retreat (as do
other processes), and that about three-quarters of the US coastline is estimated to be
retreating. If Greenland were to melt in a millennium, it would add about 3 inches per
decade on average, dominating the current sources of sea-level rise; were the larger
Antarctic ice sheet to contribute as well, much larger rates are possible.
Q10: Are there tipping points for ice sheets?
A: Quite possibly. Transferring an ice cube from your freezer to your glass of iced tea is
surely a tipping point for the ice cube; even if you take it out of the tea and put it back in
the freezer, you won’t immediately have the whole ice cube again. Too warm, and an ice
sheet melts unless you can get it back in the “freezer” in a hurry, and if the faster flow
lowers the ice sheet, the cold central region will become warmer, favoring melting.
Many times in the past, ice sheets have been well-behaved, changing slowly in response
to changing climate, but sometimes large and rapid ice-sheet changes have occurred and
huge ice sheets have disappeared completely.

Q11: What about all the uncertainties?
A: This is science, not revealed Truth, so there are uncertainties. But, that often provides
little comfort to people worried about large future changes. In many ways, the scientific
evidence indicates that there is a central estimate of what will happen, that things could
be a little better or a little worse than the central estimate, or things could be a lot worse.
We don’t expect an ice sheet to fall apart really rapidly, or for the meltwaters to greatly
change the currents in the north Atlantic and bring drought to huge regions as happened
during the warming from the last ice age, but while such events may be highly unlikely,
they are not impossible. We wish we could find “a whole lot better” to offset the “whole
lot worse” possibility, but that usually does not appear. The estimates of how much
warming we will get from a given amount of CO2 usually have a similar pattern—a
central estimate, and the possibility of a little less, or a little more, or a lot more.

Q12: So where does that leave us?
A: The best available scientific evidence shows that human fossil-fuel burning and other
activities are altering the composition of the air, causing warming, sea-level rise, and
other climatic changes, and that human decisions will determine whether or not future
changes are much larger than those that have already occurred.
Some relevant references:

National Academy of Sciences. 2001. Climate Change Science: An Analysis of Some
Key Questions. National Academies Press, Washington, DC.
http://books.nap.edu/openbook.php?isbn=0309075742

Intergovernmental Panel on Climate Change. Climate Change 2007. Cambridge
University Press, Cambridge, UK. www.ipcc.ch

American Geophysical Union. 2007. Human impacts on climate. Washington, DC.
http://www.agu.org/sci_soc/policy/positions/climate_change2008.shtml

American Association for the Advancement of Science Board of Directors, 2006, AAAS
Board Statement on Climate Change. Washington, DC,
http://www.aaas.org/news/press_room/climate_change/

Karl, T.R., S.J. Hassol, C.D. Miller and W.L. Murray, Eds. 2006. Temperature Trends in
the Lower Atmosphere: Steps for Understanding and Reconciling Differences. A Report
by the Climate Change Science Program and the Subcommittee on Global Change
Research, Washington, DC.

Rahmstorf, S., A. Cazenave, J.A. Church, J.E. Hansen, R.F. Keeling, D.E. Parker and
R.C.J. Sommerville. 2007. Recent climate observations compared to projections. Science
316, 709.
You can also read