Tsunami Damage Area Estimation for the 2010 Maule, Chile Earthquake Using ASTER DEM and PALSAR Images on the GEO Grid
←
→
Page content transcription
If your browser does not render page correctly, please read the page content below
8th International Workshop on Remote Sensing and Disaster Response on Sept. 30- Oct. 1, 2010, Tokyo, Japan

 Tsunami Damage Area Estimation for the 2010 Maule,
  Chile Earthquake Using ASTER DEM and PALSAR
               Images on the GEO Grid
                     Masashi Matsuoka                                                          Shunichi Koshimura
        Information Technology Research Institute                                        Disaster Control Research Center
   National Institute of Advanced Industrial Science and                                  Graduate School of Engineering
           Technology (AIST), Tsukuba, Japan                                             Tohoku University, Sendai, Japan
                   m.matsuoka@aist.go.jp                                              koshimura@tsunami2.civil.tohoku.ac.jp

Abstract—We propose using satellite remote sensing technology               service and data from the “GEO (Global Earth Observation)
with a modified damage detection model based on the regression              Grid” system administered by the National Institute of Advanced
discriminant function for severe building damage ratios as a                Industrial Science and Technology (AIST), Japan [7]. The GEO
method to quickly estimate damaged areas due to tsunamis                    Grid also contributes by providing large-scale archived data
anywhere in the world. The model was developed using a data set             related to earth observation including not only ASTER but also
from JERS-1/SAR images of the aftermath of the 1995 Kobe                    Phased Array L-band Synthetic Aperture Radar (PALSAR)
earthquake and its detailed ground-truth data, and was applied to           images.
ALOS/PALSAR images acquired before and after the 2010 Maule,
Chile earthquake tsunami. The modified model considers the                      Among the remote sensors, SAR is remarkable for its ability
backscattering characteristics of tsunami-damaged buildings and             to record the physical value of the Earth's surface [8]. Unlike
scattered debris in the affected areas and the ground elevation as          passive optical sensors, SAR enables observation of surface
measured by Terra/ASTER stereoscopic observations. The                      conditions day or night, even through clouds. SAR
accuracy of the proposed damage estimation model is examined by             interferometric analyses using phase information have
comparing it with the results of field survey data and interpretation       successfully provided quantification of relative ground
of high-resolution satellite optical images taken after the event.          displacement levels due to natural disasters [9]. More importantly,
                                                                            intensity information obtained from SAR represents a physical
Keywords- Synthetic Aperture Radar; DEM; Tsunami Damage;
                                                                            value (backscattering coefficient) that is strongly dependent on
          ALOS/PALSAR; Terra/ASTER; GEO Grid
                                                                            the roughness of the ground surface and the dielectric constant,
                                                                            but independent of observation conditions such as the baseline
                          I.    INTRODUCTION                                length of satellite orbits [10]. Based on this idea, we have
    It is quite difficult to get an accurate overview of large-scale        developed models for satellite C- and L-band SAR data to map
natural disasters such as earthquakes, tsunamis, windstorms,                building damage areas by clarifying the relationship between the
floods, and landslides. We expect damage assessment to take                 change in the backscattering coefficient before and after
longer the greater the extent of the damaged area. In order to              earthquakes, and building damage assessment based on detailed
properly respond to a disaster, observations of the damaged area            field investigations following the 1995 Kobe earthquake [11, 12].
by helicopters, airplanes, and satellites may be able to fill the               In this paper, we introduce an example application, mapping
time lag of field damage assessment. In particular, remote                  tsunami-induced damage due to the 2010 Maule, Chile
sensing by satellites can provide observation of a wide area with           earthquake using the ASTER DEM and PALSAR images on a
a single image and it may be possible to use this technology to             GEO Grid data set. We evaluate tsunami inundation
improve the estimation accuracy for large-scale damage [1, 2].              susceptibility based on a DEM derived from pre-tsunami ASTER
For assessing affected areas due to tsunamis, landforms are a               images. PALSAR is used for post-event assessment. We examine
significant factor in determining the extent of tsunami run-up [3].         the backscattering characteristics of damaged areas in the
Generally, global-based digital elevation models (DEMs), which              PALSAR images taken before and after the tsunami and then
are generated from stereoscopic pairs of optical sensor images              apply a modified model based on Matsuoka and Nojima [12] in
like SPOT DEM [4] and ASTER (Advanced Spaceborne                            order to extract severely damage areas. The results of the damage
Thermal Emission and Reflection Radiometer) GDEM [5], or                    estimation are examined by comparing the results of field survey
using interferometric approaches using Synthetic Aperture Radar             data and interpretation of high-resolution satellite optical images
(SAR) images like Shuttle Radar Topography Mission (SRTM)                   taken after the event.
[6], can be employed to map the susceptibility of areas to large-
scale tsunami inundation. In order to access higher resolution
DEMs, it is possible to use the ASTER on-demand processing

                                                                        1
8th International Workshop on Remote Sensing and Disaster Response on Sept. 30- Oct. 1, 2010, Tokyo, Japan

    II.     ASTER DEM AND INUNDATION SUSCEPTIBILITY MAP                           resolution is 15 m, can be generated by this function without any
                                                                                  ground control points (GCPs). The standard deviations of original
A. GEO Grid and ASTER DEM                                                         geolocation accuracy are better than 20 m in the horizontal plane
    The GEO Grid system aims at providing an e-infrastructure                     and 10 m along the vertical axis [15].
and large-scale archived data related to earth observation to                         The GEO Grid system provides several useful options in
understand our Earth more precisely and with more insight, as                     creating higher quality DEMs and in making them useful in
well as being faster and easier to access by the worldwide earth                  practice [7]. One of the options is geometric correction based on
sciences community [13]. One of the most potentially useful                       a reference DEM. It performs a geolocation correction of the
archives in GEO Grid is more than 1.8 million ASTER scenes                        DEM by calculating the horizontal and vertical offsets between
from the Terra earth-observation mission satellite compiled since                 the ASTER DEM and a reference DEM. The relative geolocation
its launch in 1999. ASTER can cover a wide spectral region                        accuracy is examined by template matching in the horizontal
covering the visible to thermal ranges with 14 spectral bands. It                 plane and vertical differences from the reference DEM in a flat
has three bands in the visible and near-infrared (VNIR) range, six                area. When using SRTM as the reference DEM, the standard
bands in the shortwave infrared (SWIR) range, and five bands in                   deviation of the geolocation accuracy improves to less than 7.5 m
the thermal infrared (TIR) range with 15, 30, and 90 m ground                     horizontally and 3.3 m vertically [16].
resolutions [14]. The ASTER instrument also has an along-track
stereoscopic capability using two telescopes in a near-infrared
band, one for nadir-viewing and another for backward-viewing,
with a base-to-height ratio of 0.6 [15]. The DEM, whose spatial

          Figure 1. (a) ASTER false color composite and (b) DEM images of the Concepcion, Talcahuano, and Dichat areas. Image taken February 5, 2001

               Figure 2. (a) ASTER false color composite and (b) DEM images of the Arauco, Llico, and Lebu areas. Image taken January 20, 2001

                                                                              2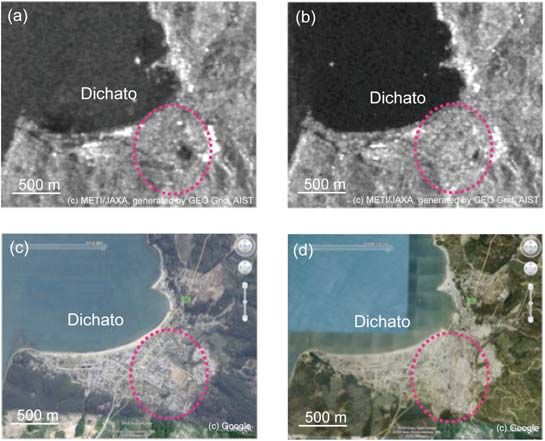
8th International Workshop on Remote Sensing and Disaster Response on Sept. 30- Oct. 1, 2010, Tokyo, Japan

          Figure 3. Map of estimated susceptibility to tsunami inundation (blue region) based on the ASTER DEM. (a) Concepcion area, (b) Arauco area.

                                                                                 observed the Concepcion area in the same beam mode. Figures 4
B. The 2010 Chile Earthquake Tsunami and Inundation                              and 5 show the pre- and post-tsunami images by PALSAR. The
    Susceptibility                                                               images acquired on March 11, 2009 for Concepcion and January
    A moment magnitude 8.8 earthquake struck the central region                  15, 2010 for Arauco were used for the data prior to the event.
of Chile on February 27, 2010. The earthquake produced a                         These PALSAR data are also stored in the GEO Grid archives
tsunami that caused major damage in locations spanning over 500                  and the image processing, including orthorectification, was
km of coastline, from Tirúa to Pichilemu. Coastal locations were                 carried out using the GAMMA Software in the system [20].
affected by both ground shaking and the tsunami. As of May                           Figures 6 and 7 show zoomed-in pre- and post-tsunami
2010, 521 people had died and 56 persons were still missing. The                 PALSAR images used to examine the backscattering
earthquake and tsunami destroyed over 81,000 houses, and                         characteristics of tsunami damage in typical areas in Dichato and
another 109,000 were severely damaged [17].                                      Llico cities, where totally collapsed buildings are identified in the
    In order to understand the topographic characteristics of                    optical sensor images on Google Earth. Typically, man-made
affected areas, we searched and selected cloudless ASTER                         structures show comparatively high reflection due to the cardinal
images of the Biobio region from the GEO Grid ASTER archives,                    effect of structures and the ground. Open spaces or damaged
then generated orthorectified images and DEMs with 15 m                          buildings have comparatively low reflectance because
ground resolution. Figures 1 and 2 show the false color                          microwaves are scattered in different directions. Buildings may
composite images and DEM in the areas of Concepcion (Feb. 5,                     be reduced to debris by earthquake ground motion, and in some
2001) and Arauco (Jan. 20, 2001), respectively. We found that                    cases, the debris of buildings may be removed, leaving the
there are cities located on small plains along the coast with                    ground exposed. Thus, the backscattering coefficient determined
several valley bottom lowlands. According to the tsunami                         after collapse is likely to be lower than that obtained prior to the
surveys [18] and simulation [19], the maximum expected tsunami                   event [11, 12]. However, the reverse occurred in the damaged
height is approximately 25 m above sea level. So, as a first stage               areas marked by dotted red circles in figs. 6 and 7. To explain
estimate, areas where the elevation is lower than 25 m are                       these anomalies in the PALSAR images, several factors need to
considered to be susceptible to tsunami inundation as shown in                   be considered such as the relationship among the illumination
Fig. 3. According to this simple estimation, most of the major                   direction of microwaves transmitted from the satellite, the
cities in the region are at risk of inundation.                                  longitudinal direction of buildings, the built-up density of
                                                                                 buildings, and changes of earth surface materials. For Dichato
                                                                                 city (Fig. 6), it seems that scattered debris from collapsed
        III.   PALSAR IMAGES AND DAMAGE DETECTION                                buildings, visible in open spaces such as roads and bare ground in
                                                                                 the post-tsunami image, shows brighter reflections than in the
A. Backscattering Characteristics in Damaged Areas                               pre-tsunami image. For Llico city (Fig. 7), it seems that the
    Two days after the event, the PALSAR unit on the Advanced                    tsunami-induced mud soils covered the paddy fields with water.
Land Observing Satellite (ALOS) observed the Arauco area in                      These kinds of characteristics that affect the backscattering echo
fine-beam-mode, which captures the earth surface with                            were identified in the tsunami-affected areas in the PALSAR
approximately 10-meter resolution. Then, two weeks later, it                     images.

                                                                             3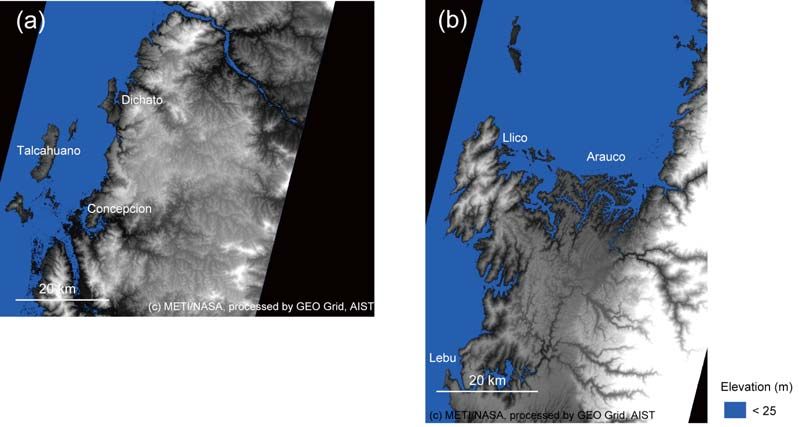
8th International Workshop on Remote Sensing and Disaster Response on Sept. 30- Oct. 1, 2010, Tokyo, Japan

       Figure 4. PALSAR images of the Concepcion, Talcahuano, and Dichato areas before and after the 2010 Maule, Chile earthquake tsunami. (a) Image
                                              taken on Mar. 11, 2009. (b) Image taken on Mar. 14, 2010.

     Figure 5. PALSAR images of the Arauco, Llico, and Lebu areas before and after the 2010 Maule, Chile earthquake tsunami. (a) Image taken on Jan. 15,
                                                         2010. (b) Image taken on Mar. 2, 2010.

                                                                                  Here, ZRj represents the discriminant score from the SAR images.
B. Damage Detection Method                                                        The pixels whose value ZRj is positive are interpreted as suffering
    Following Matsuoka and Nojima (2010), the regression                          severe damage. Because both coefficients are negative, higher
discriminant function for building damage was calculated from                     and negative d’s or smaller r’s produce larger ZRj values.
two characteristic values, the correlation coefficient and the
                                                                                      However, in the tsunami damage areas in the PALSAR
difference in backscattering coefficient for pre- and post-event
                                                                                  images in the above-mentioned examination, the backscattered
SAR images [12]. First, following accurate positioning of the two
                                                                                  echoes were stronger in the post-tsunami image. In order to
SAR images, a speckle noise filter with a 2121 pixel window
                                                                                  detect such damaged areas using an image analysis, we need to
[21] was applied to each image. The difference value, d, is
                                                                                  consider cases where the reverse occurs. Therefore we calculated
calculated by subtracting the average value of the backscattering
                                                                                  the absolute value of the difference in backscattering coefficient,
coefficient within a 1313 pixel window in the pre-event image
                                                                                  |d|, and which changed the coefficient of the difference to
from the post-event image (after – before). The correlation
coefficient, r, is also calculated from the same 1313 pixel                      positive values as shown in Equation 2.
window [11]. The result of applying regression discriminant                                                Z Rj '= 1.277 d  2.729 r                       (2)
analysis, using the d’s and r’s from the building damage data set
of the 1995 Kobe earthquake, is shown in Equation 1.                              Here, ZRj' represents the modified discriminant score. Using this
                                                                                  formula, the pixels whose value ZRj' is positive might be assigned
                        Z Rj = 1.277 d  2.729 r                       (1)       as areas damaged not only by earthquakes but also by tsunamis.

                                                                              4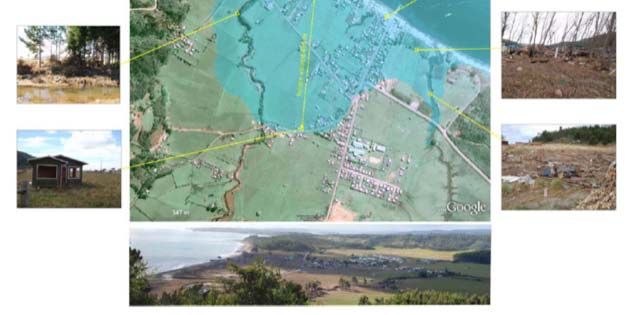
8th International Workshop on Remote Sensing and Disaster Response on Sept. 30- Oct. 1, 2010, Tokyo, Japan
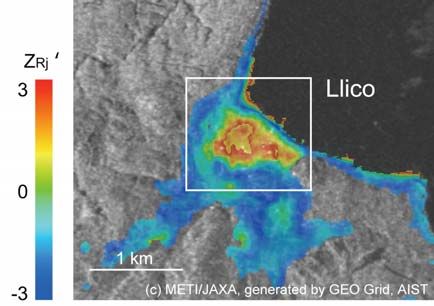
the location is far from the coastline, we found that the tsunami
surged to that point. Figure 12 is a close-up ZRj' image of Llico.
The estimated damage areas, widely detected in Llico city,
correspond well to the flooded area interpreted by a field survey
[22].
IV. CONCLUSIONS
This paper proposed a scheme to detect damage due to
tsunamis using an ASTER DEM and PALSAR images stored and
processed on the GEO Grid system developed by AIST. First,
maps of susceptibility to tsunami inundation were created by
threshold classification using the ground elevation from the
ASTER DEM. Second, a modified damage detection model,
based originally based on data from the 1995 Kobe earthquake,
was proposed, making use of the phenomena that backscattering
intensity increases in debris-strewn areas. We then examined the
relationship between the backscattering echo in PALSAR images
and the areas affected by tsunami following the 2010 Maule,
Chile earthquake. Finally, we applied this model to PALSAR
Figure 6. PALSAR images of Dichato in comparison with optical sensor images and compared the results with optical sensor images and
images on Google Earth before and after the 2010 Maule, Chile earthquake field survey data with ground photos. For estimations of tsunami
tsunami. (a) Pre-tsunami PALSAR image. (b) Post-tsunami PALSAR image. damage, the function for the Kobe earthquake was used but it
(c) Pre-tsunami optical image. (d) Post-tsunami optical image.
would be preferable for a suitable fragility function for tsunami
damage to be developed in order to further increase the accuracy
of damage estimation.
ACKNOWLEDGMENTS
The ASTER and PALSAR data are the property of
METI/NASA and METI/JAXA, respectively. We received grants
for part of the research from the “Development of real-time
tsunami damage detection technology for expeditious disaster
response by Japan and ASEAN countries (Project ID:
08E52010a)”, the NEDO Industrial Technology Research Grant
Program, the “Enhancement of Earthquake and Tsunami Disaster
Mitigation Technology in Peru”, JST-JICA’s Science and
Figure 7. PALSAR images of Llico before and after the 2010 Maule, Chile Technology Research Partnership for Sustainable Development
tsunami. (a) Pre-tsunami PALSAR image. (b) Post-tsunami PALSAR image. (SATREPS), and a grant-in-aid for scientific research (Research
No. 21310119). We would like to express our gratitude.
C. Damage Detection for the 2010 Chile Earthquake Tsunami REFERENCES
Using the procedure described above and the PALSAR [1] Eguchi, R.T., Huyck, C.K., Adams, B.J., Mansouri, B., Houshmand, B.,
images of the 2010 Chile earthquake tsunami, we calculated and Shinozuka, M.: Resilient disaster response: Using remote sensing
discriminant scores ZRj' in the areas shown to be vulnerable on technologies for post-earthquake damage detection, Research Progress and
Accomplishments 2001-2003, Multidisciplinary Center for Earthquake
the inundation susceptibility maps (Fig. 3) and estimated the Engineering Research, pp.125–137, 2003.
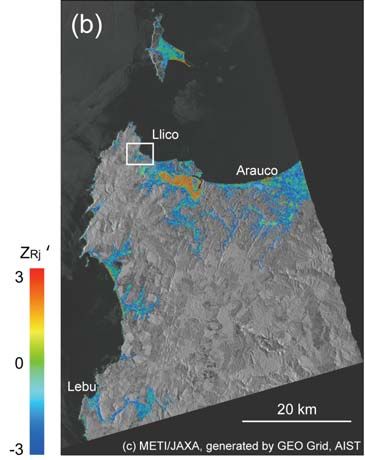
tsunami damage distribution. The results are shown in figs. 8 and [2] Saito, K., Spence, R.J.S., Going, C., and Markus, M.: Using high-
9. The sections on the sea are masked, but areas where the river resolution satellite images for post-earthquake building damage
could not be masked have large ZRj' values because of surface assessment: A study following the 26 January 2001 Gujarat Earthquake,
changes caused by the flow of water. The wetlands near Earthquake Spectra, Earthquake Engineering Research Institute, 20 (1),
Talcahuano and Llico, where the ZRj' values are large, seem to be pp.145–169, 2004.
affected by the tsunami. [3] Kouchi, K. and Yamazaki, F.: Characteristics of tsunami-affected areas in
moderate-resolution satellite images, IEEE Trans. Geosci. Remote Sens.,
Figure 10 shows a close-up ZRj' image of the Dichato area. 45 (6), pp.1650-1657, 2007.
This agrees well with the post-tsunami optical image, Figure 6(d). [4] SpotImage: SPOT DEM Precision Product description ver.1.0, available
Figure 11 shows a ground photo near Dichato city taken on April online:
http://www.spotimage.com/automne_modules_files/standard/public/p807_
24, 2010. The viewing area of the ground photo (dotted lines) is 97114bc824a947c5af8914cdf4b351edSPOT__DEM_Precision_Product_de
shown in Figure 10 to correspond to areas with large ZRj'. Though scription_V1.0.pdf (access on 31 Aug. 2010).
5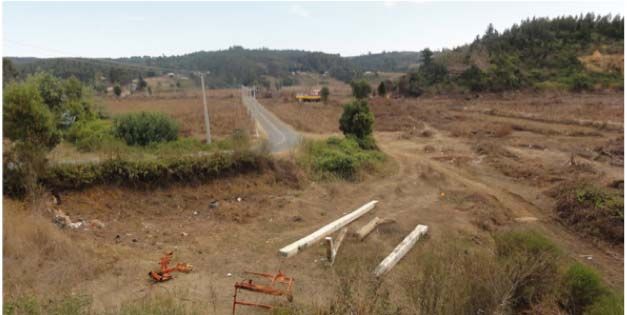
8th International Workshop on Remote Sensing and Disaster Response on Sept. 30- Oct. 1, 2010, Tokyo, Japan

[5]    Earth Remote Sensing Data Analysis Center: ASTER GDEM, available                         Radiometer (ASTER), IEEE Trans. Geosci. Remote Sens., 36 (4), pp.1062-
       online: http://www.gdem.aster.ersdac.or.jp/ (access on 31 Aug. 2010).                    1071, 1998.
[6]    Farr, T., Kobrick, M.: The Shuttle Radar Topography Mission produces a            [15]   Fujisada, H., Bailey, G.B., Kelly, G.G., Hara, S., and Abrams, M.J.:
       wealth of data, Amer. Geophys. Union EOS, Vol. 81, 583-585, 2000.                        ASTER DEM performance, IEEE Trans. Geosci. Remote Sens., 43 (12),
[7]    Kodama, S., Yamamoto H., Yamamoto, N., Kamei, A., Nakamura, R.,                          pp.2707-2714, 2005.
       Iwao, K., and Tsuchida, S.: ASTER digital elevation model and                     [16]   Kodama, S., Arioka, M., Mio, A., Nakamura, R., and Iwao, K.: Geometric
       orthorectified images generated on the GEO Grid, Proc. IEEE IGRASS                       accuracy of ASTER DEM, Proc. the 43rd Autumn Conference of the
       2010, CD-ROM, 4p., 2010                                                                  Remote Sensing Society of Japan, pp.241-242, 2007 (in Japanese).
[8]    Henderson, F. M., and Lewis, A. J.: Principles and Applications of Imaging        [17]   Earthquake Engineering Research Institute: The Mw8.8 Chile Earthquake
       Radar, Manual of Remote Sensing, 2, John Wiley & Sons, Inc., New York,                   of February 27, 2010, EERI Special Earthquake Report, 2010.
       1998.                                                                             [18]   NOAA National Geophysical Data Center: NOAA/WDC Historical
[9]    Massonnet, D., Rossi, M., Carmona, C., Adragna, F., Peltzer, G., Fiegl, K.,              Tsunami                Database,             available              online:
       and Rabaute, T.: The displacement field of the Landars earthquake mapped                 http://www.ngdc.noaa.gov/hazard/tsu_db.shtml (access on 1 Aug. 2010).
       by radar interferometry, Nature, 364, pp.138-142, 1993.                           [19]   Koshimura, S., Takashima, M., Suzuki, S., Hayashi, H., Imamura, F., and
[10]   Yonezawa, C., and Takeuchi, S.: Decorrelation of SAR data by urban                       Kawata, Y.: Estimation of the Possible Tsunami Disaster Potential within
       damages caused by the 1995 Hyogoken-Nanbu earthquake, International                      the Indian Ocean, Annual Journal of Coastal Engineering, Japan Society of
       Journal of Remote Sensing 22 (8), pp.1585–1600, 2001.                                    Civil Engineers, Vol.52, pp.1416-1420, 2005 (in Japanese).
[11]   Matsuoka, M., and Yamazaki, F.: Use of Satellite SAR intensity imagery            [20]   Takeyama, Y., Kodama, S., Nakamura, K., Matsuoka, M., and Yamamoto,
       for detecting building areas damaged due to earthquakes, Earthquake                      N.: Development of ALOS/PALSAR data on-demand processing and
       Spectra, Earthquake Engineering Research Institute, 20 (3), 975–994, 2004.               providing system on GEO Grid, Proc. IEEE IGRASS 2010, CD-ROM, 3p.,
[12]   Matsuoka M., and Nojima, N.: Estimation of building damage ratio due to                  2010.
       earthquakes using satellite L-band SAR imagery, Proc. 7th International           [21]   Lee, J.S.: Digital image enhancement and noise filtering by use of local
       Workshop on Remote Sensing and Disaster Response, 2009.                                  statistics, IEEE Trans. Pattern Analysis and Machine Intelligence, 2,
[13]   Sekiguchi, S., Tanaka, Y., Kojima, I., Yamamoto, N., Yokoyama, S.,                       pp.165-168, 1980.
       Tanimura, Y., Nakamura, R., Iwao, K., and Tsuchida, S.: Design principles         [22]   Lario, J.: Report Field survey (17-30/03/2010), Part 1-Arauco area, ITST –
       and IT overviews of the GEO Grid, IEEE Systems Journal, 2 (3), pp.374-                   Chile 2010, available online: https://itictsunami.basecamphq.com/login
       389, 2008.                                                                               (access on 17 April 2010).
[14]   Yamaguchi, Y., Kahle, A.B., Tsu, H., Kawakami, T., and Pniel, M.:
       Overview of Advanced Spaceborne Thermal Emission and Reflection

                                   Figure 8. Distribution of ZRj' obtained by ALSAR images. (a) Concepcion area. (b) Arauco area.

                                                                                     6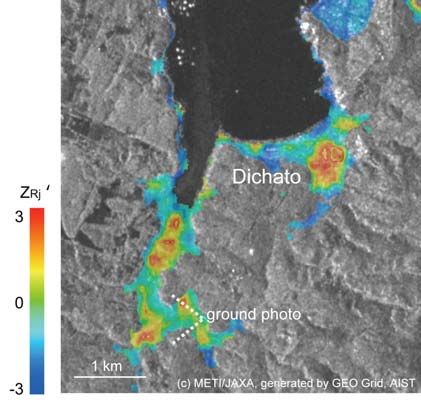
8th International Workshop on Remote Sensing and Disaster Response on Sept. 30- Oct. 1, 2010, Tokyo, Japan

                                                                                   Figure 11. Distribution of ZRj' in a close-up of the Llico area.

       Figure 9. Distribution of ZRj' in a close-up of the Dichato area.

                                                                                  Figure 12. Flooded areas of Llico interpreted by Lario (2010)
         Figure 10. Ground photo whose location is drawn in fig. 9,                                           [22].
                         taken on April 24, 2010.

                                                                           7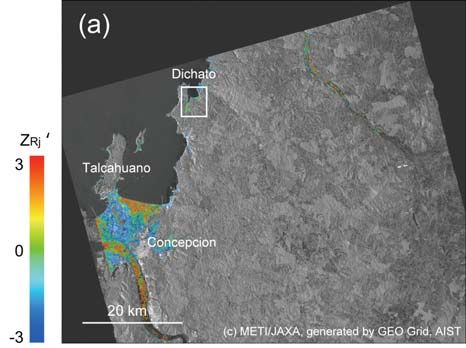
You can also read