CURRENT TRENDS IN LAND SUBSIDENCE OF THE NORTH-CENTRAL PART OF POLAND USING DINSAR TECHNIQUE - E3S WEB OF ...
←
→
Page content transcription
If your browser does not render page correctly, please read the page content below
E3S Web of Conferences 266, 03006 (2021) https://doi.org/10.1051/e3sconf/202126603006
TOPICAL ISSUES 2021

 Current trends in land subsidence of the North-
 Central part of Poland using DInSAR technique
 H. Rajaoalison1, D. Knez2
 1
 AGH University of Science and Technology, Department of Drilling and Geoengineering
 2
 Faculty of Drilling, Oil and Gas; al. Mickiewicza 30, 30-059 Krakow, Poland

 Abstract. The gradual change in the Earth’s surface elevation is known as
 land subsidence and it happens due to natural causes related to geological
 activities, such as sinkholes, or induced causes related to human activities,
 such as mining activities, or both. The historical records of land subsidence
 show that it is mainly related to human activities with damages of more
 than billions of dollars every year. This paper shows the current trends of
 land subsidence case of the North-Central part of Poland using the
 Differential Interferometric Satellite Aperture Radar (DInSAR) technique.
 That region is known as the extension of the oil and gas reservoir of the
 Baltic Sea and one of the most populated areas in Poland. This technique
 uses SAR data images from the sentinel-1A mission of the same area,
 taken on April 25, 2018 and April 26, 2020, in order to measure the surface
 changes between these time intervals. Thus, a two-year land subsidence
 map of that region has been created, with maximum subsidence of -85mm.
 There is no significant subsidence in the production area, but information
 on the population supports the alleged reasons for such subsidence, namely
 the infrastructure growth and the need for water resources. Besides, most
 of the occurred subsidence in the concerned area is concentrated in big
 cities such as Gdansk and Gdynia. Such result is very important for
 policymakers, especially concerning the sustainable development goals

 1 Introduction
 Land subsidence is the gradual change of the Earth‟s surface due to natural or induced
 or both causes. Land subsidence typically occurred when a large amount of fluid had been
 withdrawn from the underground, while the overburden weight above the reservoir is
 relatively the same or even increased due to some infrastructures on the surface and,
 therefore, results in compaction [1,2]. There are couples of historical records of land
 subsidence related to human activities, such as the one that happened in the Goose Creek
 oil field in 1925, where the entire Gaillard Peninsula parcel was submerged by water [3].
 Also, a land subsidence of 14 m due to high demand for groundwater and geothermal water
 production, close to high-density populated areas, was recorded at Wairakei geothermal
 field in New Zealand [4]. In addition, the rapid industrial growth associated with the
 development of the urban area caused a recorded land subsidence of 20 to 200 cm in
 Jakarta between 1982 and 1997. Growing cities cause significant movement of construction
 materials and influence the overburden stresses. Apart from that, the mining industry

© The Authors, published by EDP Sciences. This is an open access article distributed under the terms of the Creative Commons
Attribution License 4.0 (http://creativecommons.org/licenses/by/4.0/).
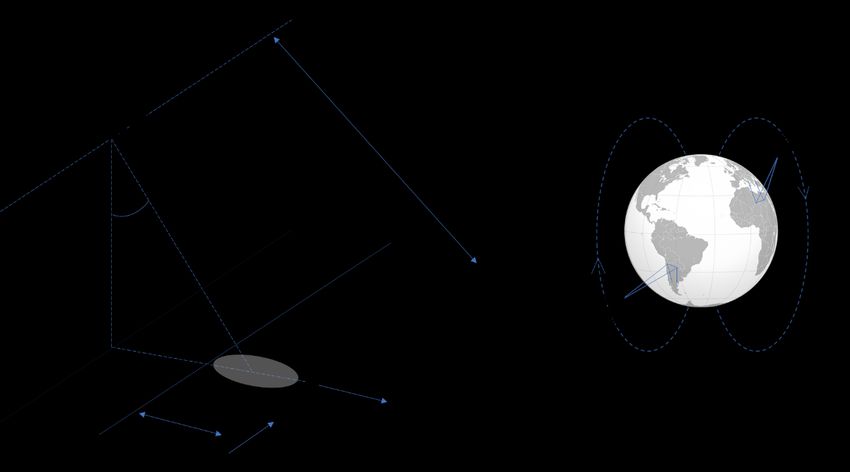
E3S Web of Conferences 266, 03006 (2021) https://doi.org/10.1051/e3sconf/202126603006
TOPICAL ISSUES 2021

 significantly changes the underground stresses. It is easy to find such cases in the south part
 of Poland, where coal mines produce large surface damages. Open-pit mines producing
 coal or other minerals are also a considerable source of stress variations and surface
 subsidence. Development of new oil and gas resources requires exploration of natural
 minerals from open pits [5] so the growing petroleum production influences land
 subsidence in other parts of Earth.
 Traditional methods of measuring land subsidence include detailed surveys and tide
 level gauges using the high precision Global Positioning System (GPS) and tiltmeters.
 These techniques require a large number of benchmarks and observation points for
 mapping, accessibility of the area, and are quite costly [6]. However, the geophysical
 application of SAR is capable to cope with these issues by using electromagnetic waves and
 take advantage of shifted phases from different observation times of the same antenna
 position to measure deformations expressed on the surface. High-density spatial mapping of
 ground deformation associated with tectonic and volcanic activities has been demonstrated
 [7, 8, 9]. The InSAR is a technique used to map land deformation with high accuracy by
 using collected radar images of the Earth‟s surface (Fig. 1). Radar waves (electromagnetic)
 can penetrate clouds even in a very bad weather conditions, that makes it one of the most
 effective methods for monitoring ground deformations, such as volcanic evolution,
 earthquakes, subsidence, etc.. Space agencies in Italy, Germany, Canada, Japan, Korea,
 Europe, and the USA provide these SAR data images, in which some of them are free for
 the public, such as the data used in this study [10]. However, one of the best uses of the
 InSAR is perhaps a better understanding of crust deformation.

 Fig. 1.InSAR data acquisition mode.
 Electromagnetic radar waves are emitted from the SAR satellite, travel through the
 atmosphere, hit the ground, bounce back to space, and are recorded by the same satellite.
 The echo contains the amplitude and phase. The amplitude includes the return signal
 strength that is affected by the physical properties of the surface. The distance from the
 satellite to the ground and its back echoing to the satellite is expressed in the radar
 wavelength. The phase difference records the time between the two images. By combining
 or interfering the two waves, amplification or cancellation will occur between the wave

 2
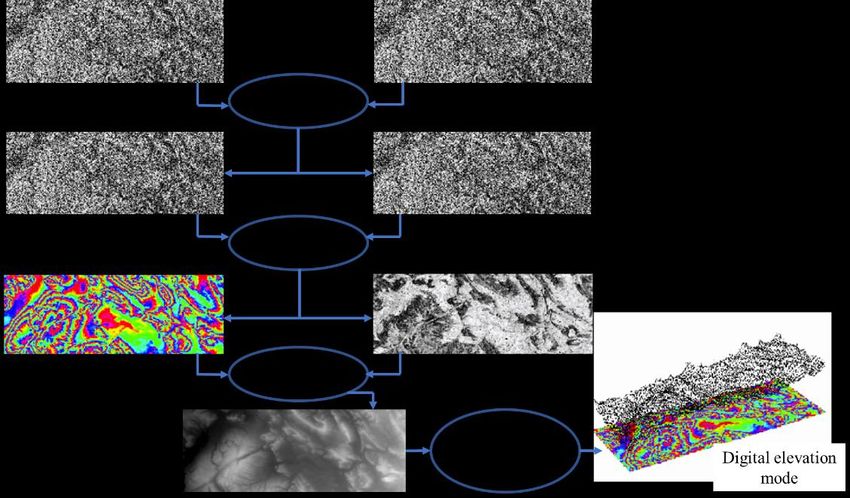
E3S Web of Conferences 266, 03006 (2021) https://doi.org/10.1051/e3sconf/202126603006
TOPICAL ISSUES 2021

 rays [11, 12]. Another benefit of the InSAR is the ability to cover a very large spatial area
 with centimeter to millimeter accuracy, unlike the other techniques that measure only few
 points [13, 14, 15]. It is then empowers scientists to monitor some specific areas, such as a
 subsiding area, by producing images of space-time evolution. It is also a very useful
 technique, especially for remote areas and monitoring a specific place with hazardous
 conditions, like a volcano or places of explosions.
 The aim of this paper is to map the land deformation in the North-Central part of Poland
 using SAR images taken on April 25, 2018, and April 26, 2020. This area is known as the
 extension of oil and gas of the Baltic Sea exploration region and one of the most populated
 areas in Poland.

 2 Methodology

 2.1 DInSAR
 The DInSAR is one of the InSARtechniques, that uses the information phase from two or
 more SAR images to obtain data on the Earth deformation. Interferometric fringes are
 generated when changes have been registered between two images [16]. Such information
 is described in the following relationship (Eq. 1):
 = + + + (1)

 whereΦanw is the unwrapped phase; Φtopo is the topographic phase; Φdisp is the phase change
 due to the movement of the pixel in the satellite line-of-sight direction; Φatmois the phase
 equivalent of the difference in the atmospheric retardation between passes; and Φnoiseis the
 noise term from the variability of the scattering pixels, thermal noise, and co-registration
 errors.
 The data processing is generally divided into four steps, including co-registration,
 interferogram generation, phase unwrapping, and geocoding (Fig. 2).

 Fig. 2.DInSAR data processing.

 3
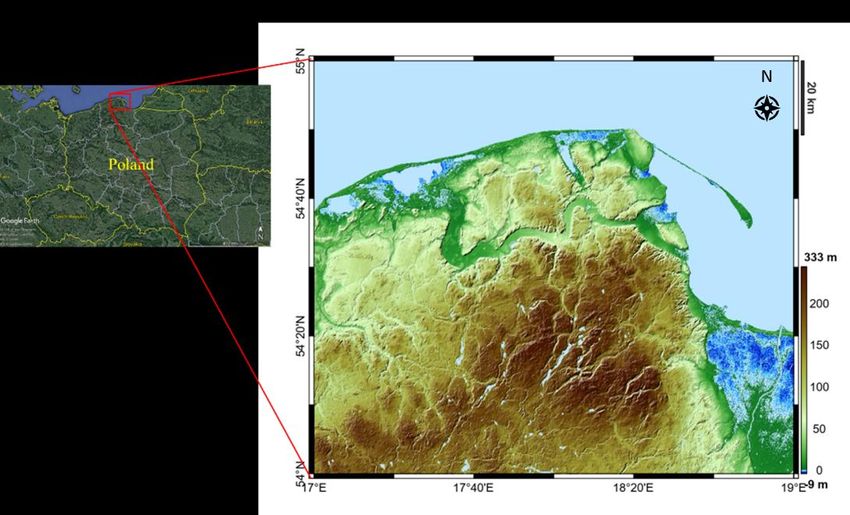
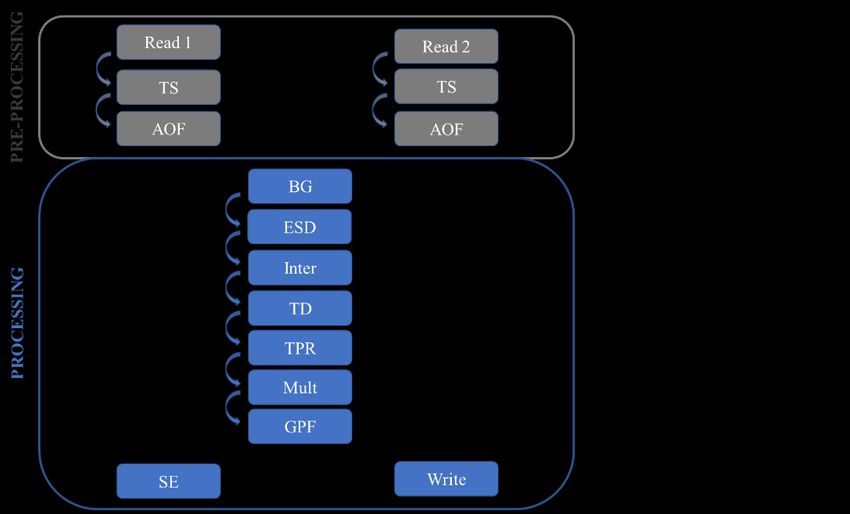
E3S Web of Conferences 266, 03006 (2021) https://doi.org/10.1051/e3sconf/202126603006
TOPICAL ISSUES 2021

 The DInSAR technique consists of comparing two images taken from the same place,
 before and after an event, such as an earthquake or explosion. Any movement that happens
 between these time intervals is being recorded and measured using the captured satellite
 images. Thus, the objective of the DInSAR technique is to obtain the phase changes Φdisp
 and remove the topographic phase Φtopo. The accuracy obtained with the “two-pass”
 DInSAR and digital elevation model (DEM) of the shuttle radar topography mission
 (SRTM) is better than 1:25,000 topographic map. The steps for processing DInSAR data
 processing steps in SNAP software are described below (Fig. 3).

 Fig. 3. Data processing steps in SNAP.

 2.2 Study area
 The area of interest is located in the North-Central part of Poland, within the latitude
 and longitude of 54-55⁰N and 17-19⁰E, respectively. It is part of the Polish lowland that
 covers the eastern part of the NE German-Polish basin, formed during the Precambrian
 period, including the platform areas of Poland and the Polish sector of the Baltic Sea with
 an area of 221,000 km2, covered with sedimentary rocks up to 10-12 km thick; and the
 Middle Cambrian formations consisting of fine to medium-grained sandy sediments, with
 mudstone and claystone intercalations and frequent deformational structures (gravitational
 flows, bioturbations). The topography of the area is shown in Figure 4. The elevation of the
 area varies from 0 to 333 m above the sea level. However, some part close to the shore has
 a topographic level below 0 m, that could be related to movements of tide near the coast.

 4
E3S Web of Conferences 266, 03006 (2021) https://doi.org/10.1051/e3sconf/202126603006
TOPICAL ISSUES 2021

 Fig. 4. Topographic profile of the North-Central part of Poland.
 Two SAR images from Sentinel-1A SAR scenes, taken on April 25, 2018, and April 26,
 2020, have been used in this study in order to generate the ground deformation of the
 studied area between these dates, which is nearly two years [17]. The sentinel mission
 details about these two images are shown in Table 1.
 Table 1. Description of the two used SAR images of the concerned area.
 ___________________________________________________________
 Mission description SAR image n⁰1 SAR image n⁰2
 ___________________________________________________________
 Sensing date 2018-04-25 2020-04-26
 Instrument SAR-C SAR-C
 Instrument mode IW IW
 Satellite Sentinel-1 Sentinel-1
 Mission id 152640 244882
 Orbit number 21619 32294
 Pass direction Descending Descending
 Polarization VV-VH VV-VH
 Product class SAR standard L1 SAR standard L1
 Product level L1 L1
 Product type SLC SLC
 Relative orbit 22 22
 Mission type Earth observation Earth observation
 ____________________________________________________________

 3 Results and discussion
 Data on the land subsidence of the studied area was generated after sentinel-1 data
 processing in SNAP software, which is free license software for SAR data processing.

 5
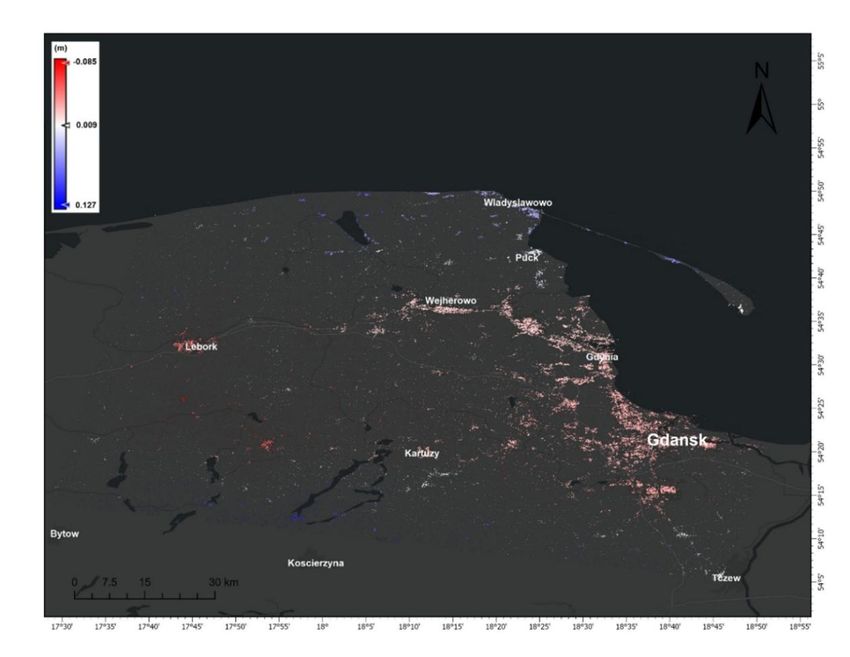
E3S Web of Conferences 266, 03006 (2021) https://doi.org/10.1051/e3sconf/202126603006
TOPICAL ISSUES 2021

 Fig. 5. Land subsidence of the North-Central part of Poland.
 The two-year land subsidence of the studied area is presented in Figure 5. The land
 subsidence of the concerned area generally appears in big cities, such as Gdańsk and
 Gdynia. The maximum land subsidence of the concerned area was up to -85mm; that
 happened in Lebork town and its surrounding. The north part of the region, where the oil
 and gas production is located, does not show signs of subsidence; however, the foremost
 North area, such as in Wladyslawowo, shows slightly uplifted area. Besides that, the area
 the maximum subsidence is geologically characterized by young sandstones and clays,
 which are favorable for compaction, especially when large amounts of underground fluids,
 such as groundwater, have been explored [18]. In addition, the most subsided area is the
 place of settlement of large cities, which may be associated with the growth of
 infrastructure. While it is difficult to distinguish the possible sources of land subsidence in
 this region, population statistics provide information on population growth, which supports
 the alleged cause of land subsidence in the area, i.e., the infrastructure growth and therefore
 the increase of in demand of water [19, 20].
 The deformation on the surface can be related to tectonic or human activities, e.g.,
 natural and induced seismicity. According to Lizurek et al., earthquakes rarely occurred in
 Poland, especially large earthquakes that could cause damages on the surface. Since 1000,
 only 100 events were known and recorded in Poland, and those earthquakes occurred in the
 Southern part. The event of December 3, 1786, with an estimated Richter magnitude of 5.6
 is considered as the greatest earthquake that ever happened in Poland. The industrial
 activities, such as underground mining in the Upper Silesian Coal Basin (USCB) and
 Legnica GłogowCopper District (LGCD), open-pit mining in „„Bełchatow‟‟ brown coal

 6
E3S Web of Conferences 266, 03006 (2021) https://doi.org/10.1051/e3sconf/202126603006
TOPICAL ISSUES 2021

 mine, and reservoir impoundment of Czorsztyn artificial lake near Niedzica hydropower
 plant, are considered as the main sources of the seismic activities in Poland, especially in
 the Carpathian Mountains. According to the Polish Seismological Network run by the
 Institute of Geophysics, Polish Academy of Sciences, the Southern area presents the most
 active part of Poland, which is characterized by the large number of seismic activities of
 3,000 events per year. Besides, the Upper Silesian Seismological Network run by the
 Central Mining Institute confirmed that around 200 events with magnitude of 2.4 occurred
 every year and around 55,900 events with magnitude of 1.5 were recorded between 1974
 and 2005 [21, 22]. Besides, the copper ore underground exploration, e.g., „„Rudna‟‟,
 „„PolkowiceSieroszowice‟‟, and „'Lubin‟‟ mines, is the source of the anthropogenic seismic
 activities in the South-West part of Poland, with the annual seismicity events of several
 hundreds and magnitudes between 0.4 and 4.5 [23, 24]. In contrast to the seismicity in the
 Southern part, neither natural nor induced seismicity with significant magnitudes has been
 recorded in the North-Central part of Poland, as it is considered as tectonically stable, and
 high magnitude events are very rare. Thus, the surface change, related to the seismic
 activities, whether natural or induced, in the North-Central part of Poland, is insignificant
 and shall not be monitored, as there is no specific place where it often occurs.
 The land subsidence in that region is relatively low comparing to other related
 worldwide subsidences; however, it shows the efficiency of the satellite monitoring of land
 deformation, scaled down to millimeter precision. This result is covering a large area, but in
 the case of a specific place, such as open mining, land subsidence monitoring requires the
 use of InSAR data combined with other technologies, such as drones data and measurement
 points data from the high precision GPS.

 4 Conclusions
 This work shows the land subsidence of the North-Central part of Poland using InSAR
 satellite images. SAR images, taken on April 25, 2018 and April 26, 2020, from the sentinel
 1 mission were used to register a two-year land subsidence of the area, where the most
 subsided area is located in Gdańsk and Gdynia cities, and the maximum recorded land
 subsidence of up to –85 mm was located in the town of Lebork and its vicinity. The
 geology of the area, as well as the population growth, supports the assumption on the
 source of such subsidence, which is related to the urbanization and population growth, and
 consequent growth of demand of water resources. This work is among the first and
 preliminary land subsidence study cases of the area of concern using SAR data images,
 which makes it essential, especially for the government and policymakers in terms of
 sustainable development goals.

 References
 1. H.Z.Abidin, H.Andreas, I.Gumilar, Y.Fukuda, Y.E. Pohan, T. Deguchi, Land
 subsience of Jakarta (Indonesia) and its relation with urban development. Natural
 Hazards, 59 (3), 1753. (2011).
 2. H., Rajaoalison, A., Zlotkowski, G., Rambolamanana, Mechanical properties of
 sandstone using non-destructive method. Journal of Mining Institute, 241, 113–
 117.(2020).
 3. T.L. Holzer, R.L.Bluntzer, Land Subsidence near Oil and Gas Fields, Houston, Texas.
 Groundwater, 22 (4), 450–459.(1984).
 4. R.G.Allis, Review of subsidence at Wairakei field, New Zealand. Geothermics, 29 (4–
 5), 455-478. (2000).

 7
E3S Web of Conferences 266, 03006 (2021) https://doi.org/10.1051/e3sconf/202126603006
TOPICAL ISSUES 2021

 5. D. Knez, A. Calicki, Looking for a new source of natural proppants in Poland. Bulletin
 of the Polish Academy of Sciences. Technical Sciences, 66 (1).(2018).
 6. C.Wang, H.Zhang, Z.Liu, S.Cheng, G.Lu, Satellite interferometric observations
 ofdisplacements associated with urban subsidence in Suzhou, Eastern
 China.Changes, 4(3) (2002).
 7. H.Fan, K.Deng, C.Ju, C.Zhu, J.Xue, Land subsidence monitoring by D-InSAR
 technique. Mining Science and Technology (China), 21 (6), 869–872. (2011).
 8. S.Atzori, A.Antonioli, C.Tolomei, V.De Novellis, C.De Luca, F.Monterroso, InSAR
 full-resolution analysis of the 2017–2018 M>6 earthquakes in Mexico. Remote Sensing
 of Environment, 234, 111461.(2019).
 9. I.Ahmad Abir, S.D.Khan, A. Ghulam, S.Tariq, M.T. Shah, Active tectonics of
 westernPotwar Plateau–Salt Range, northern Pakistan from InSAR observations and
 seismic imaging. Remote Sensing of Environment, 168, 265–275 (2015).
 10. B.M. Popescu, Hydrocarbons of Eastern Central Europe(Springer, 1994).
 11. W.D.Barnhart, W.L. Yeck, D.E. McNamara, Induced earthquake and liquefaction
 hazards in Oklahoma, USA: Constraints from InSAR. Remote Sensing of Environment,
 218, 1–12(2018).
 12. E.Chaussard, S.Wdowinski, E.Cabral-Cano, F.Amelung, Land subsidence in central
 Mexico detected by ALOS InSAR time-series. Remote Sensing of Environment, 140,
 94–106(2014).
 13. TaoLi, JingnanLiu,MingshengLiao, ShaojunKuang, XuLu, Monitoring city subsidence
 by D-InSAR in Tianjin area. IGARSS 2004. 2004 IEEE International Geoscience and
 Remote Sensing Symposium,5,3333–3336 (2004).
 14. Y. Guoqing, M.Jingqin, D-InSAR Technique for Land Subsidence Monitoring. Earth
 Science Frontiers, 15 (4), 239–243(2008)
 15. F.Qu, Z.Lu, Q.Zhang, G.W.Bawden, J.-W.Kim, C.Zhao, W.Qu, Mapping ground
 deformation over Houston–Galveston, Texas using multi-temporal InSAR. Remote
 Sensing of Environment, 169, 290–306.(2015).
 16. F. Grassi, F.Mancini, Sentinel-1 data for ground deformation monitoring: the SNAP
 StaMPS workflow. Workshop Tematico di Telerilevamento–Bologna. 26.(2019).
 17. P.Snoeij, E.Attema, M.Davidson, B. Duesmann, N.Floury, G.Levrini, B. Rommen, B.
 Rosich, The Sentinel-1 radar mission: Status and performance. 2009 International
 Radar Conference" Surveillance for a Safer World"(RADAR 2009). IEEE, 1–6.(2009).
 18. Story Map Series [online], Available from:
 http://geologia.pgi.gov.pl/arcgis/apps/MapSeries/index.html?appid=8d14826a895641e
 2be10385ef30 5b3c [Accessed 31 Aug 2020].(2020).
 19. Gdańsk Population [online], Available from: http://population.city/poland/gdansk/
 [Accessed 31 Aug 2020].(2020).
 20. Statistical Office in Gdańsk [online], Available from: https://gdansk.stat.gov.pl/en/
 [Accessed 31 Aug 2020].(2020).
 21. P. Wiejacz, and W. Dębski, Podhale, Poland, earthquake of November 30, 2004. Acta
 Geophysica, 57 (2), 346–366.(2009).
 22. G.Lizurek, Full moment tensor inversion as a practical tool in case of discrimination of
 tectonic and anthropogenic seismicity in Poland. Pure and Applied Geophysics, 174
 (1), 197–212. (2017).

 8
E3S Web of Conferences 266, 03006 (2021) https://doi.org/10.1051/e3sconf/202126603006
TOPICAL ISSUES 2021

 23. S.Lasocki, Quantitative evidences of complexity of magnitude distribution in mining-
 induced seismicity: Implications for hazard evaluation. In: The Fifth Int. Symp.
 onRockbursts and Seismicity in Mines (RaSiM 5)‘Dynamic rock mass response to
 mining. 543–550.(2001).
 24. M. Meghraoui, Z. Çakir, Y. Bouhadad, InSAR analysis of a blind thrust rupture and
 related active folding: the 1999 Ain Temouchent earthquake (M w 5.7, Algeria) case
 study. Journal of Seismology, 13 (4), 421–432.(2009).

 9
You can also read