PROCEEDINGS OF SPIE Planning and real-time monitoring of low intensity focused ultrasound therapies using a diagnostic imaging array - Brl Uiuc
←
→
Page content transcription
If your browser does not render page correctly, please read the page content below
PROCEEDINGS OF SPIE
       SPIEDigitalLibrary.org/conference-proceedings-of-spie

                   Planning and real-time monitoring of
                   low intensity focused ultrasound
                   therapies using a diagnostic imaging
                   array

                   Thies, Miles, Oelze, Michael

                                  Miles Thies, Michael L. Oelze, "Planning and real-time monitoring of low
                                  intensity focused ultrasound therapies using a diagnostic imaging array," Proc.
                                  SPIE 11602, Medical Imaging 2021: Ultrasonic Imaging and Tomography,
                                  116020I (15 February 2021); doi: 10.1117/12.2580943

                                  Event: SPIE Medical Imaging, 2021, Online Only

Downloaded From: https://www.spiedigitallibrary.org/conference-proceedings-of-spie on 02 Mar 2021 Terms of Use: https://www.spiedigitallibrary.org/terms-of-use
Planning and real-time monitoring of low intensity focused
ultrasound therapies using a diagnostic imaging array
Miles Thiesa,b and Michael L. Oelzea,b
a
Department of Electrical and Computer Engineering, University of Illinois at
Urbana-Champaign, Urbana, IL, USA
b
Beckman Institute for Advanced Science and Technology, University of Illinois at
Urbana-Champaign, Urbana, IL, USA
ABSTRACT
A growing number of focused ultrasound (FUS) therapies use low intensity FUS with microbubbles to induce me-
chanical bioeffects for the non-invasive treatment of localized tissue regions. For these low intensity mechanical-
based FUS therapies, there is a need for therapy planning and real-time monitoring techniques to ensure that
the FUS beam is targeted to the desired region even in the presence of tissue motion. In this work, a system
is presented for combined therapy planning, low intensity FUS treatment, and real-time therapy monitoring
using a single diagnostic imaging array. First, a sonication pattern was determined by manually segmenting the
treatment region from a B-mode image captured with the imaging array. To visualize the FUS therapy beam, a
focused pulse excitation was transmitted and backscattered signals were used to reconstruct the intensity field
of the FUS beam. The FUS beam reconstruction was overlaid onto a co-aligned B-mode image captured with
the imaging array, allowing one to qualitatively monitor the position and size of the FUS beam with anatomical
context from the B-mode image. Real-time beam visualizations at a frame rate of 25-30 frames per second were
achieved in a rat tumor in vivo and a mock FUS therapy was planned and monitored in a tissue-mimicking
phantom.
Keywords: Beam visualization, focused ultrasound, therapy monitoring, therapy planning
1. INTRODUCTION
Focused ultrasound (FUS) has captured the attention of the medical community due to its potential to non-
invasively treat many different diseases. FUS can induce a variety of beneficial bioeffects through thermal or
mechanical mechanisms and the ultrasonic energy can be tightly focused to a localized region without affecting
intervening or surrounding tissues. Before treatment, the FUS beam must be carefully aligned to the treatment
region and a sonication pattern must be determined, a process referred to as therapy planning. During treatment,
the FUS beam must be monitored in real-time to ensure that the beam is correctly focused and that healthy
tissues are not inadvertently treated.
To plan an FUS therapy, typically a collection of magnetic resonance (MR), computed tomography (CT), or
ultrasound images is used to locate the treatment region and determine a sonication pattern.1 In cases when
the treatment region is larger than the focal zone of the FUS source, a grid of focal points is designated and the
FUS source moves through the grid using a mechanical positioning system or electronic focusing.2, 3 While an
FUS therapy is being carried out, it is important to monitor the location of the FUS beam. MR-guidance is the
clinical standard for monitoring thermal-based FUS therapies.4 For mechanical-based FUS therapies, ultrasound
B-mode imaging5 and passive cavitation imaging6, 7 (PCI) have been explored for treatment monitoring. A novel
method for qualitative FUS therapy monitoring that uses ultrasonic backscatter to visualize the FUS beam in
real-time was proposed by our group.8, 9
Further author information: (Send correspondence to M.L.O.)
M.T.: E-mail: mhthies2@illinois.edu
M.L.O.: E-mail: oelze@illinois.edu
Medical Imaging 2021: Ultrasonic Imaging and Tomography, edited by Brett C. Byram,
Nicole V. Ruiter, Proc. of SPIE Vol. 11602, 116020I · © 2021 SPIE
CCC code: 1605-7422/21/$21 · doi: 10.1117/12.2580943
Proc. of SPIE Vol. 11602 116020I-1
Downloaded From: https://www.spiedigitallibrary.org/conference-proceedings-of-spie on 02 Mar 2021
Terms of Use: https://www.spiedigitallibrary.org/terms-of-useRecently, a new class of FUS therapies has been emerging. These therapies use low intensity FUS pulses
typically in combination with ultrasound contrast agents, or microbubbles, to stimulate mechanical effects in
tissue. Some examples of low intensity mechanical-based FUS therapies are opening of the blood-brain barrier,10
sensitization of tumors to radiation therapy,11 targeted drug delivery,12 and neuromodulation.13 For many
of these therapies, high power FUS sources are not required and diagnostic imaging arrays can output the
required pressure levels. In vivo opening of the blood-brain barrier with simultaneous monitoring was recently
demonstrated using a diagnostic imaging array.14 The use of an imaging array as an FUS source facilitates easy
beam steering and image guidance during therapy.
In this study, we describe a simple system for low intensity mechanical-based FUS therapies that enables
straightforward therapy planning and real-time monitoring using a single diagnostic imaging array. Alignment
of different transducers or registration between different imaging modalities was not required because a single
transducer was used for planning, monitoring, and treatment. First, the imaging array acquired a B-mode
image that was used to identify the treatment region and the FUS therapy beam was then electronically steered
throughout the region. The therapy beam was monitored in real-time using ultrasonic backscatter received by the
imaging array. The FUS beam monitoring technique was demonstrated in a rat tumor in vivo. The combined
therapy planning and monitoring system was tested in a tissue-mimicking phantom. No FUS therapies were
carried out using this system, but the excitation sequence contained a mock therapeutic excitation to mimic an
actual FUS therapy.
2. METHODS
2.1 Overview
An overview of the FUS therapy system is shown in Figure 1. First, the imaging array acquired a B-mode image
of the area to be treated. The treatment region was manually segmented from the B-mode image. A grid of
focal points was then fit to the arbitrarily shaped treatment region. The array traversed through the focal point
grid by focusing the therapy beam to each point. The FUS beam was monitored in real-time using the beam
visualization method previously described by our group.9 Briefly, before transmitting the FUS therapy pulse,
the imaging array transmitted a short, low power visualization pulse, which was focused to the same location as
the FUS therapy pulse. Backscatter from the visualization pulse was received by the imaging array and used to
reconstruct the intensity field of the FUS beam.
2.2 Therapy Planning
Given a manually segmented treatment region, a bounding box was first calculated to enclose the arbitrarily
shaped region. A grid of focal points was created to fill the bounding box with a step size determined by the
estimated beamwidth and depth of field of the FUS beam. The theoretical −3 dB transmit beamwidth R−3dB
and depth of field DOF−3dB of an FUS beam assuming a continuous wave excitation are:
R−3dB = 1.028λf# (1)
and
DOF−3dB = 7.08λ(f# )2 , (2)
where λ is the wavelength of the excitation and f# is the f-number of the FUS source.15 The f# of the FUS
beam was dynamically determined by taking the ratio of the depth of the segmented region’s center point to the
full aperture diameter of the imaging array. The lateral step size ∆x and axial step size ∆z of the focal point
grid were defined as:
∆x = R−3dB (3)
and
Proc. of SPIE Vol. 11602 116020I-2
Downloaded From: https://www.spiedigitallibrary.org/conference-proceedings-of-spie on 02 Mar 2021
Terms of Use: https://www.spiedigitallibrary.org/terms-of-useB-mode imaging sequence
Therapy Manually segment B-mode image to
planning identify treatment region
Calculate focal point grid to fill
treatment region
B-mode imaging sequence
Transmit beam visualization excitation
Receive backscatter from visualization Repeat for
Treatment excitation all points in
with focal point
monitoring Reconstruct FUS beam using grid
backscatter data
Overlay FUS beam reconstruction onto
B-mode image
Transmit therapy sequence
Figure 1. Diagram of FUS therapy planning and monitoring method using a single diagnostic imaging array.
∆z = 0.5DOF−3dB , (4)
where the x-axis is the lateral direction along the array and the z-axis is the axial direction perpendicular to the
array. To fill the treatment region more evenly, every other row of focal points was offset from the left edge of
the bounding box by half a beamwidth in the positive x direction. Finally, all focal points in the bounding box
grid that did not fall within the segmented region were discarded, leaving a grid of focal points that filled the
treatment region.
2.3 Beam Monitoring
After a focused visualization pulse was transmitted, the backscattered RF data were recorded by the imaging
array at approximately four samples per wavelength. The RF data were beamformed using delay-and-sum (DAS)
beamforming with generalized coherence factor (GCF) weighting.16 A dynamic receive aperture with a fixed
f-number of 1 was used and time delays τ (x, z) were calculated using:
p
z + z 2 + (x − xc )2
τ (x, z) = τF (xc ) + , (5)
c
where c is the speed of sound in the medium and τF (xc ) is the time delay applied on transmit to focus the center
element xc in the receive subaperture.
GCF weighting is an adaptive beamforming technique that reduces sidelobe levels and focusing errors from
sound speed inhomogeneities. The GCF is expressed as:
PM 2
k=−M |S(x,z) (k)|
GCF (x, z) = P N −1
, (6)
N k=0 |s(x,z) (k)|2
where s(x,z) (k) is the receive subaperture data after applying time delays for the point (x, z), S(x,z) (k) is the
discrete Fourier transform of s(x,z) (k), N is the number of channels in the receive subaperture, and M is a
parameter of the GCF (M = 2 was chosen for all results).
Proc. of SPIE Vol. 11602 116020I-3
Downloaded From: https://www.spiedigitallibrary.org/conference-proceedings-of-spie on 02 Mar 2021
Terms of Use: https://www.spiedigitallibrary.org/terms-of-useThe final beamformer output was:
N
X −1
y(x, z) = GCF (x, z) w(i)s(x,z) (i), (7)
i=0
where w(i) is a Hanning window of length N .
The intensity field I(x, z) of the FUS beam was calculated using a pulse intensity integral at each point in
the beamformed data y(x, z):
L−1
X
I(x, z) = ∆z|y(x, z + i)|2 , (8)
i=0
where L is the length of the transmit pulse in samples and ∆z is the axial sampling period.
The intensity field I(x, z) was normalized using the co-aligned B-mode image captured after transmitting the
focused visualization pulse. This normalization procedure equalized I(x, z) across regions of different echogenic-
ity, reducing the effect that the scattering properties of the medium had on the FUS beam visualization. The
normalization factor λ(x, z) was calculated as follows:
Bmax
λ(x, z) = , (9)
B(x, z)
where B(x, z) is the smoothed envelope detected B-mode image (filtered with a 5.5 wavelengths × 7 wavelengths
moving average kernel) and Bmax is the maximum value of B(x, z). The B-mode image was smoothed to ensure
that only large-scale features were used to normalize the intensity field. The normalization factor was not applied
to points where the decibel scale value of B(x, z) was less than −60 dB relative to Bmax because it was assumed
that signal from these points was mostly noise.
2.4 Experimental Configuration
A linear array (Ultrasonix L9-4/38; Center frequency: 5 MHz, No. elements: 128; Richmond BC, Canada)
was driven by a Verasonics Vantage 128 Ultrasound System (Kirkland, WA). Data were collected from a tissue-
mimicking phantom (Supertech Model ATS 539; Elkhart, IN) and a rat tumor in vivo. For the in vivo experiment,
all protocols were approved by the Institutional Animal Care and Use Committee (IACUC) at the University of
Illinois at Urbana-Champaign. Two tumors were induced in the mammary fat pad of a rat by injecting MAT
tumor cells (100 µL containing 5 × 10² − 1 × 10⁵ cells). Once the tumors were about 1 cm in diameter, the
animal was anesthetized using isoflurane and imaged. During imaging, a bucket of degassed water was placed
over the tumors to simulate a standoff between the transducer and the tumors.
The excitation sequence consisted of a therapy planning stage and a treatment with monitoring stage. The
excitation sequence was modeled after the sequence used for a radiosensitization FUS therapy,11 but no therapy
was carried out because no microbubbles were used. For therapy planning, the imaging array transmitted 11
steered plane waves (−18° to 18°) and a B-mode image was created using coherent plane wave compounding.17
For the treatment with monitoring stage, the imaging array imaged the treatment region and visualized the
FUS beam during the off-cycle of the FUS therapy. Each treatment window lasted for 50 ms and each imaging
window lasted for 2 s. First, the imaging array acquired a B-mode image using the same coherent plane wave
compounding sequence that was used for therapy planning. The imaging array then transmitted a 2-cycle focused
visualization pulse at 5 MHz focused to a focal point in the grid and the backscattered echoes were processed to
visualize the FUS beam. The focused visualization pulse had a mechanical index of 0.54. This imaging sequence
repeated for 2 s, which was the off-cycle between each treatment window. Next, the imaging array transmitted a
180-cycle therapy pulse at 5MHz. The therapy pulse was repeatedly transmitted at a pulse repetition frequency
of 3kHz for 50 ms. The mock therapy pulse was focused to the same location as the focused visualization pulse
and had a mechanical index of 0.78. This sequence of interleaved monitoring and treatment was repeated for all
locations in the focal point grid.
Proc. of SPIE Vol. 11602 116020I-4
Downloaded From: https://www.spiedigitallibrary.org/conference-proceedings-of-spie on 02 Mar 2021
Terms of Use: https://www.spiedigitallibrary.org/terms-of-use(a)
(b)
Figure 2. Reconstruction of an FUS beam (blue/yellow) targeting a rat tumor in vivo overlaid onto a co-aligned
B-mode image (grayscale). The FUS beam was targeted to 5 mm on the lateral axis and 26 mm on the axial axis
using all 128 elements of the array. (a) Before normalizing by echogenicity. (b) After normalizing by echogenicity.
3. RESULTS
To demonstrate the efficacy of the FUS beam visualization method, an FUS beam was visualized in a rat tumor
in vivo. Intensity field reconstructions of the FUS beam overlaid onto a B-mode image of the surrounding tissue
are shown in Figure 2. Before normalizing by echogenicity, it is difficult to localize the FUS beam because little
backscatter is received from the tissue in the tumor (Fig. 2a). After normalization, the FUS beam can be clearly
localized in the tumor (Fig. 2b). The FUS beam is not visualized at the top of the image (10–20 mm deep)
because that area is the degassed water standoff, which did not scatter sufficient signal to reconstruct the beam.
The therapy planning and beam monitoring system was tested in a tissue-mimicking phantom. After aligning
the imaging array to the target region using B-mode imaging, a B-mode image was captured for segmentation of
the treatment region (Fig. 3a). The target region was then manually segmented by the user and a grid of focal
points was calculated to fill the selected area (Fig. 3b). The focal points were not evenly spaced laterally because
the focal points were calculated using a discrete grid, leading to small rounding errors. Finally, the FUS therapy
beam was steered through all points in the focal point grid and the FUS beam was visualized in real-time in
Proc. of SPIE Vol. 11602 116020I-5
Downloaded From: https://www.spiedigitallibrary.org/conference-proceedings-of-spie on 02 Mar 2021
Terms of Use: https://www.spiedigitallibrary.org/terms-of-use(a) (b)
(c)
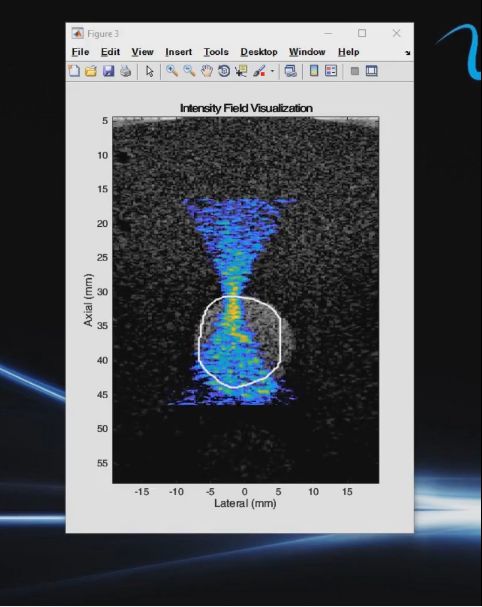
Figure 3. Overview of therapy planning procedure. (a) B-mode image captured of the treatment region to align
the imaging array and for segmentation of the treatment region. (b) B-mode image after manual segmentation
of treatment region. The treatment region is outlined with a white line and the focal point grid is depicted with
red points. (c) B-mode image with FUS beam visualization overlay to allow for monitoring of the FUS beam as
the beam traverses through the focal point grid.
between treatment periods (Fig. 3c).
The therapy planning process and real-time monitoring of an FUS beam at 25-30 frames per second in a
tissue-mimicking phantom are shown in Video 1. The video is played at 2x speed. A treatment region was first
manually segmented from a B-mode image and a mock therapy was started. Next, the transducer was moved
during therapy, causing misalignment of the FUS beam. The FUS beam was then re-aligned by selecting a new
treatment region and therapy was resumed.
4. DISCUSSION
Segmenting a pre-therapy image to identify a treatment region and calculate a sonication pattern is a well-
established feature of many FUS therapy systems. The novelty of this work is that it used a widely available
Proc. of SPIE Vol. 11602 116020I-6
Downloaded From: https://www.spiedigitallibrary.org/conference-proceedings-of-spie on 02 Mar 2021
Terms of Use: https://www.spiedigitallibrary.org/terms-of-useVideo 1. Video depicting therapy planning and real-time FUS beam visualization in a tissue-mimicking phantom
(http://dx.doi.org/10.1117/12.2580943).
type of ultrasound probe to carry out all parts of an FUS therapy. Using a single imaging array eliminates the need
for registration between different ultrasound probes or imaging modalities and reduces the FUS therapy duration.
Because diagnostic imaging arrays are not designed for high power use, this system is limited to low intensity FUS
therapies. An in vivo low intensity FUS therapy using a diagnostic imaging array was not performed in this work,
but needle hydrophone measurements have verified that the imaging array can achieve the pressure levels required
for many low intensity FUS therapies. Low intensity FUS therapies can induce therapeutic effects at a mechanical
index around 0.8,10, 11 which was achieved in this study without issue. Care must be taken when attempting to
carry out a FUS therapy with imaging arrays to ensure the transducer is not damaged. The mechanical index that
a diagnostic imaging array can safely achieve will depend on the center frequency of the transducer, the length of
the treatment pulse, and the pulse repetition frequency of the treatment. This therapy planning and monitoring
system will be used in future work to perform in vivo low intensity FUS therapies.
One limitation of this implementation was that it only allowed for therapy planning in the axial and lateral
directions because a two-dimensional (2D) imaging array was used. Therefore, this array would need to be
mechanically scanned in the elevational plane to fully treat a 3D region of tissue. If a 3D imaging array was used,
then a similar system could be designed where multiple slices of the elevational plane could be manually segmented
for 3D treatment. Another limitation was that an optimal spacing of the focal point grid was not derived. The focal
point grid was selected to uniformly fill the treatment region based on the FUS beam dimensions, but a more
efficient or effective grid design could be possible with further characterization.
Proc. of SPIE Vol. 11602 116020I-7
Downloaded From: https://www.spiedigitallibrary.org/conference-proceedings-of-spie on 02 Mar 2021
Terms of Use: https://www.spiedigitallibrary.org/terms-of-use5. CONCLUSION
A system for combined treatment, therapy planning, and real-time beam monitoring using a single diagnostic
imaging array was proposed for use in low intensity mechanical-based FUS therapies. In vivo FUS beam recon-
structions were presented to demonstrate the utility of the beam visualization technique. The therapy planning
and beam visualization system was tested while a mock FUS therapy was carried out in a tissue-mimicking
phantom. By carrying out all aspects of an FUS therapy using a single ultrasound probe, this method could
allow for faster and easier low intensity FUS therapies in both clinical and research settings.
ACKNOWLEDGMENTS
This work was supported by the NIH under Grant R21EB023403.
REFERENCES
[1] Ebbini, E. S. and Ter Haar, G., “Ultrasound-guided therapeutic focused ultrasound: current status and
future directions,” Int. J. Hyperth. 31(2), 77–89 (2015).
[2] Wu, F., Chen, W.-Z., Bai, J., Zou, J.-Z., Wang, Z.-L., Zhu, H., and Wang, Z.-B., “Pathological changes
in human malignant carcinoma treated with high-intensity focused ultrasound,” Ultrasound Med. Biol. 27,
1099–1106 (Aug. 2001).
[3] Hand, J. W., Shaw, A., Sadhoo, N., Rajagopal, S., Dickinson, R. J., and Gavrilov, L. R., “A random phased
array device for delivery of high intensity focused ultrasound,” Phys. Med. Biol. 54, 5675–5693 (Sept. 2009).
[4] Jolesz, F. A., “Mri-guided focused ultrasound surgery,” Annu. Rev. Med. 60, 417–430 (2009).
[5] Vaezy, S., Shi, X., Martin, R. W., Chi, E., Nelson, P. I., Bailey, M. R., and Crum, L. A., “Real-time
visualization of high-intensity focused ultrasound treatment using ultrasound imaging,” Ultrasound Med.
Biol. 27, 33–42 (Jan. 2001).
[6] Salgaonkar, V. A., Datta, S., Holland, C. K., and Mast, T. D., “Passive cavitation imaging with ultrasound
arrays,” J. Acoust. Soc. Am. 126, 3071–3083 (Dec. 2009).
[7] Gyöngy, M. and Coussios, C.-C., “Passive spatial mapping of inertial cavitation during hifu exposure,”
IEEE Trans. Biomed. Eng. 57(1), 48–56 (2009).
[8] Nguyen, T. N., Do, M. N., and Oelze, M. L., “Visualization of the intensity field of a focused ultrasound
source in situ,” IEEE Trans. Med. Imaging 38, 124–133 (Jan. 2019).
[9] Thies, M. and Oelze, M. L., “Real-time visualization of a focused ultrasound beam using ultrasonic backscat-
ter,” IEEE Trans. Ultrason. Ferroelectr. Freq. Control (2020).
[10] Carpentier, A., Canney, M., Vignot, A., Reina, V., Beccaria, K., Horodyckid, C., Karachi, C., Leclercq,
D., Lafon, C., Chapelon, J.-Y., Capelle, L., Cornu, P., Sanson, M., Hoang-Xuan, K., Delattre, J.-Y., and
Idbaih, A., “Clinical trial of blood-brain barrier disruption by pulsed ultrasound,” Sci. Transl. Med. 8(343),
343re2 (2016).
[11] Czarnota, G. J., Karshafian, R., Burns, P. N., Wong, S., Mahrouki, A. A., Lee, J. W., Caissie, A., Tran,
W., Kim, C., Furukawa, M., Wong, E., and Giles, A., “Tumor radiation response enhancement by acoustical
stimulation of the vasculature,” PNAS 109, E2033–E2041 (July 2012).
[12] Klibanov, A. L., “Microbubble contrast agents: targeted ultrasound imaging and ultrasound-assisted drug-
delivery applications,” Investig. Radiol. 41, 354–362 (Mar. 2006).
[13] Bystritsky, A., Korb, A. S., Douglas, P. K., Cohen, M. S., Melega, W. P., Mulgaonkar, A. P., DeSalles,
A., Min, B.-K., and Yoo, S.-S., “A review of low-intensity focused ultrasound pulsation,” Brain Stimul. 4,
125–136 (July 2011).
[14] Ji, R., Burgess, M., and Konofagou, E., “Transcranial blood-brain barrier opening and power cavitation
imaging using a diagnostic imaging array,” in [2019 IEEE International Ultrasonics Symposium (IUS) ], 2–4
(Oct. 2019).
[15] Raum, K. and O’Brien, W. D., “Pulse-echo field distribution measurement technique for high-frequency
ultrasound sources,” IEEE Trans. Ultrason. Ferroelectr. Freq. Control 44(4), 810–815 (1997).
[16] Li, P.-C. and Li, M.-L., “Adaptive imaging using the generalized coherence factor,” IEEE Trans. Ultrason.
Ferroelectr. Freq. Control 50(2), 128–141 (2003).
Proc. of SPIE Vol. 11602 116020I-8
Downloaded From: https://www.spiedigitallibrary.org/conference-proceedings-of-spie on 02 Mar 2021
Terms of Use: https://www.spiedigitallibrary.org/terms-of-use[17] Montaldo, G., Tanter, M., Bercoff, J., Benech, N., and Fink, M., “Coherent plane-wave compounding for
very high frame rate ultrasonography and transient elastography,” IEEE Trans. Ultrason. Ferroelectr. Freq.
Control 56(3), 489–506 (2009).
Proc. of SPIE Vol. 11602 116020I-9
Downloaded From: https://www.spiedigitallibrary.org/conference-proceedings-of-spie on 02 Mar 2021
Terms of Use: https://www.spiedigitallibrary.org/terms-of-useYou can also read