LOS CABOS TOURISM OBSERVATORY - KEY PERFORMANCE INDICATORS JUNE 2021 - FITURCA
←
→
Page content transcription
If your browser does not render page correctly, please read the page content below

LOS CABOS TOURISM
   OBSERVATORY

KEY PERFORMANCE INDICATORS

         JUNE 2021
Leading indicators – Summary

                                     Hotel Performance     Air Passenger Arrivals
Hotel Occupancy:
                                                           Total Passengers          National Passengers       International Passengers
                                                           (May-2021, expressed      (May-2021, expressed      (May-2021, expressed in
                                                           in thousands):            in thousands):            thousands):
                                                           251.4                     89.15                     162.25
                                                           +9.1%                     +10.9%                    +8.2%
                                                           (vs. May-2019)            (vs. May-2019)            (vs. May-2019)
                                                                                                                                  SOURCE: GAP

                                                           Other indicators

                                                           Cruise ships              Cruise passengers            Group Business Total
                                                           (Apr-2021):               (Apr-2021):                  RFPs (May-2021):
                                                           0                         0                            49
                                                           -26 vessels               -100%                        +17 RFPs
                                                           (vs. Apr-2019)            (vs. Apr-2019)               (vs. Apr-2019)
                                                           SOURCE: DATATUR           SOURCE: DATATUR              SOURCE: CVENT

Hotel Occupancy    Rooms Available       Room Nights       Tourist Satisfaction:     Attendees to congresses      Tourists’ Origin
(May-2021):        (Apr-2021):           (Apr-2021):       more than expected        and conventions              (May-2021):
57%                21,824                979,391           (May-2021):               (May-2021):                  64% foreigners
-10pp              +6.5%                 -14.7%            62%                       2%                           -9.5pp
(vs. May-2019)     (vs. Apr-2019)        (vs. Apr-         +23pp                     +0pp                         (vs. May-2019)
                                         2019)             (vs. May-2019)            (vs. May-2019)
SOURCE: AHLC       SOURCE: DATATUR       SOURCE: DATATUR   SOURCE: TOURIST SURVEYS   SOURCE: TOURIST SURVEYS      SOURCE: TOURIST SURVEYS
Leading indicators – Summary

PASSENGER ARRIVALS
• In May-2021, Los Cabos International Airport recorded      • For Jun-2021, the United States expects 34.9% more   • Hotels in Los Cabos recorded 183.9 thousand
  a 9.1% (+21 thousand) increase in the total number of        available seats than those scheduled for 2019.         tourist arrivals, which decreased by 21% (-49.8
  passengers arriving at the destination compared to         • From Canada, 32.8% fewer seats are expected in the     thousand) between Apr-2021 and Apr-2019.
  May-2019, adding up to a total of 251.4 thousand             next 6 months. There was a 95.7% drop in Jun-2021.   • Domestic and international tourism dropped
  (when considering arrivals only).                          • Decreases are expected in all Canadian airports        24% (-14.7 thousand) and 20% (-35 thousand),
     • Passengers on domestic flights (89.15 thousand)         within the next 6 months: Calgary (-17.4%),            respectively.
       represent 35.5% of total arrivals. These increased      Vancouver (-34.5%), Toronto (-68.7%), and Edmonton   • There were 979.4 thousand occupied room
       by 10.9% (+8.75 thousand vs. May-2019).                 (-49.9%).                                              nights in Apr-2021, 14.7% fewer compared to
     • Passengers on international flights (162.25                                                                    Apr-2019 (-169.4 thousand nights).
       thousand) represent 64.5% of total arrivals.          HOTEL PERFORMANCE
       These increased by 8.2% (+12.3 thousand vs.           • Occupancy in May-2021 was 57%, down 10pp from        TOURIST SURVEYS
       May-2019).                                              67% in May-2019.                                     • In May-2021, 62% of tourists rated their
                                                                  • Occupancy in Cabo San Lucas dropped 18pp          experience in Los Cabos as better than they
FLIGHT SCHEDULES                                                     compared with May-2019 and is now at 59%.        expected (23pp more than in May-2019 and
• The domestic market has 14.3% more available seats              • San Jose del Cabo recorded an occupancy rate      17.8pp more than in Apr-2021).
  scheduled for the period from Jun-2021 to Nov-2021                 of 55% (8pp lower than in May-2019).           • During May-2021, security was perceived as
  (compared to the same period in 2019). 19.8% more               • Los Cabos Corridor recorded an occupancy rate     bad or regular by 3% of tourists, 9pp better
  seats are expected in Jun-2021.                                    of 51% (2pp lower than in May-2019).             than in May-2019.
• Flight seats departing from CDMX, MTY, and TIJ             • The number of rooms available in Los Cabos           • Satisfaction with the airport also improved
  increased by 10.9%, 31.7%, and 95.5%, respectively           increased 6.5% between Apr-2021 and Apr-2019,          8.7pp compared to 2019 (2.7% of tourists
  (compared to 2019). However, GDL decreased by 8.1%.          reaching 21,824 this month.                            perceived their experience as bad or regular).
• For the U.S., there are 1.24 million seats scheduled for                                                          • The number of repeat tourists decreased by
  the next 6 months, which is 53.1% more compared to                                                                  9pp compared to 2019, registering 33% in
  the same period in 2019.                                                                                            May-2021.
• CHI (+110%), LAX (+64%), PHX (+29%), HOU (+40%),                                                                  • The number of tourists who traveled with a
  DFW (+31%), DEN (+180%), and SEA (+594%) had the                                                                    package tour remained low and registered 40%
  most significant increase vs. 2019. However, San Diego                                                              in May-2021 (-8.9pp vs. 2019).
  shows a decrease of 51%.
LOS CABOS TOURISM
   OBSERVATORY
THE IMPACTS OF COVID-19

Effects of COVID-19 on Mexico’s
         tourism sector.
Traffic light monitoring system for epidemiological risk of COVID-19

                                                                                                                                                 Only essential economic activities
                                                                                                                                                 are allowed.

                                                                                                                                                 In addition to essential economic
                                                                                                                                                 activities, companies with non-
                                                                                                                                                 essential economic activities may
                                                                                                                                                 conduct operations with 30% of
                                                                                                                                                 their staff. Outdoor public spaces
                                                                                                                                                 can open with reduced capacity.

                                                                                                                                                 All work activities are allowed.
                                                                                                                                                 Outdoor public spaces can open
                                                                                                                                                 on a regular basis, and indoor
                                                                                                                                                 public spaces can open with
                                                                                                                                                 reduced capacity.

                                                                                                                                                 All activities, including school
                                                                                                                                                 activities, are allowed.

SOURCE: SECRETARIAT OF HEALTH, GENERAL DIRECTORATE OF EPIDEMIOLOGY (www.coronavirus.gob.mx). TRAFFIC LIGHT MONITORING SYSTEM UPDATED AS OF JUNE 24th, 2021.
Confirmed COVID-19 cases overview

                    Number of daily new cases                                Confirmed cases by municipalities in B.C.S.                      Incidence of infection

                                                                                                 36,735
                                                                                                  cases

   Total confirmed cases as of June 19th, 2021
         National
                                                                         • La Paz and Los Cabos account for 46% and 38%               • The national average rate of infection is
        2.48 million    • 91 more cases since May 19th.
                                                                           of the total confirmed cases in the state.                   1,942 cases per 100 thousand inhabitants.
   Baja California Sur                                                   • La Paz has 1,573 more cases than those                     • Mexico City still has the highest rate of
                                                                           recorded as of May 19th, accumulating a total                new COVID-19 cases, which is above the
           36,735       • 5,486 more cases than those                      of 16,730 confirmed cases.                                   national average: 7,476.9
                           recorded by May 19th.                         • Los Cabos has 3,608 more cases, adding up to               • Quintana Roo: 1,788.2
      Quintana Roo                                                         a total of 14,032.                                         • Baja California Sur is the second state with
                                                                         • Loreto accumulates 1,333 cases (19 more).                    the highest rate: 4,565
           30,815       • 5,217 more cases in the same
                           period.
SOURCE: SECRETARIAT OF HEALTH, GENERAL DIRECTORATE OF EPIDEMIOLOGY (www.coronavirus.gob.mx). FIGURES UPDATED AS OF JUNE 21st, 2021.
Effects on employment in Mexico

           National – May                          Baja California Sur – May                   Quintana Roo – May

         IMSS-registered jobs
         (millions)                               IMSS-registered jobs (thousands)          IMSS-registered jobs (thousands)

• As of May 31st, 2021, IMSS had           • Baja California Sur closes May-2021     • Quintana Roo closes May-2021 with
  registered 20,109,444 jobs in the          with 176,593 jobs, 5.7% fewer than        396,775 jobs, 14.3% fewer than in
  country, 1.3% fewer than those             in May-2019.                              May-2019.
  reported in May-2019.
                                           • 7,222 more jobs were registered         • 30,992 more jobs were registered
• 335,712 more jobs were registered          compared to the end of Dec-2020.          from Dec-2020 to May-2021.
  compared to the end of Dec-2020.

                                                                                                                               SOURCE: IMSS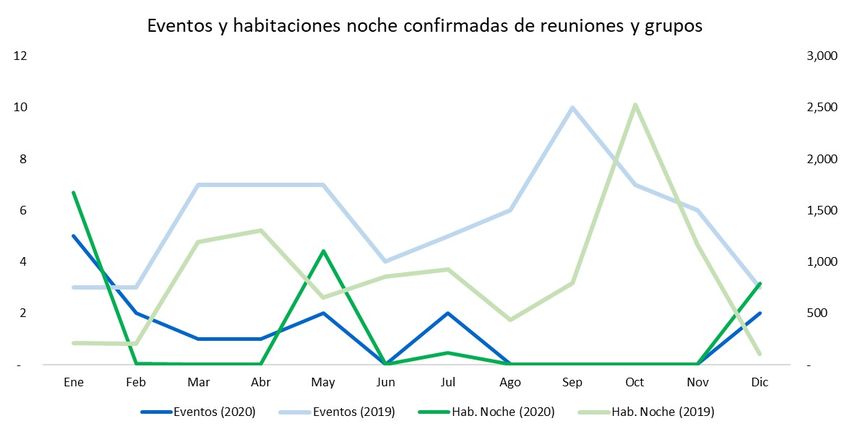
Effects on employment in Mexico

                        Employment variation by state (May 2021 vs. December 2019)

• Baja California Sur is now the sixth worst-affected state in terms of job losses, compared to the 2019 year-end
  (it ranked third in Mar-2021 and fourth in Apr-2021). Quintana Roo is still the most affected state.

                                                                                                                    SOURCE: IMSS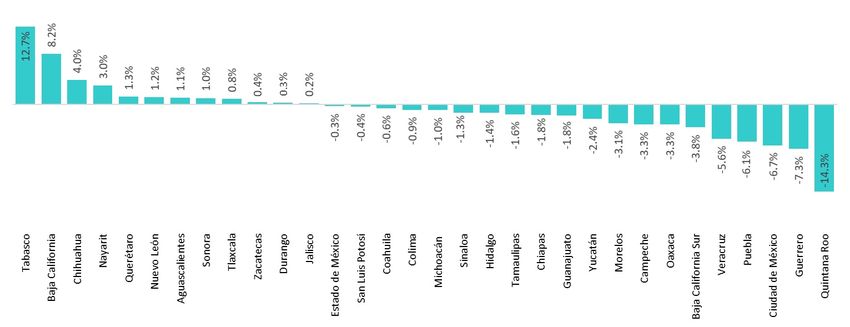
International tourist arrivals in Mexico

                                               April 2021

                                                             Inbound
                                                              tourists
                                                                51%
                                                  Total
                    Cross-border               2,325,824
                      tourists
                        49%

                                                                                   Traveling by   Traveling by   Total inbound tourists
                                                                                   air            land

                • In Apr-2021, 2.32 million international tourists arrived      • The total number of inbound tourists increased
                   in the country (36% fewer than in Apr-2019). 51% were          0.7% compared to Mar-2021.
                   inbound tourists.
                                                                                • There is a 37.7% decrease in the total number
                • The average spending of inbound tourists arriving by            of inbound tourists compared to Apr-2019.
                   air was USD 1,073.79 ($44.22 more compared to the
                   average spending in Apr-2019).                               • 80% arrived by air, and 20% did so by land.

SOURCE: INTERNATIONAL TOURIST SURVEYS, INEGI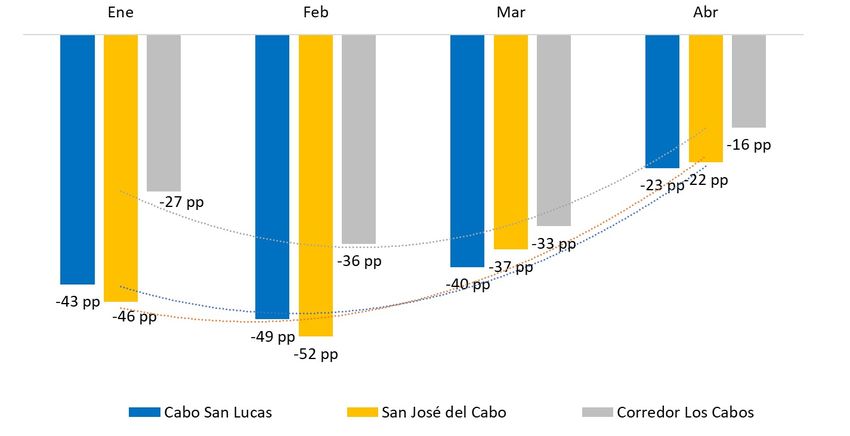
Hotel indicators in Mexico

                                                 Hotel occupancy in Mexico (average of 12 destinations)

                                                                        2019      2020         2021

  80%

  70%

  60%

                                                                                                                                                              • Hotel occupancy in Mexico
  50%
                                                                                                                                                               continues to show moderate
                                                                      -                                                                                        growth. Week 20 closed with
  40%                                                               19.2p                                                                                      an occupancy rate of 45.6%,
                                                                      p                                                                                        19.2pp less than in the same
  30%                                                                                                                                                          week of 2019.

  20%

  10%

   0%
         1 2 3 4 5 6 7 8 9 10 11 12 13 14 15 16 17 18 19 20 21 22 23 24 25 26 27 28 29 30 31 32 33 34 35 36 37 38 39 40 41 42 43 44 45 46 47 48 49 50 51 52
 Week
             Ene          Feb        Mar          Abr         May         Jun            Jul          Ago      Sep          Oct         Nov         Dic

SOURCE: DATATUR. MONITORED DESTINATIONS: VILLA HERMOSA, AGUASCALIENTES, TUXTLA GUTIERREZ, QUERETARO, PUEBLA, PUERTO VALLARTA, SAN CRISTOBAL DE LAS CASAS, LOS CABOS, CANCUN, MEXICO CITY, ACAPULCO
AND SAN MIGUEL DE ALLENDE.
Hotel indicators in Mexico
Hotel occupancy in Cancun, Puerto Vallarta, and Los Cabos
Cancún Puerto Vallarta Los Cabos
80%
70%
60%
50%
40%
30%
20%
10%
0%
23 24 25 26 27 28 29 30 31 32 33 34 35 36 37 38 39 40 41 42 43 44 45 46 47 48 49 50 51 52 1 2 3 4 5 6 7 8 9 10 11 12 13 14 15 16 17 18 19 20
Week
Jun Jul Ago Sep Oct Nov Dic Ene Feb Mar Abr Mayo
2020 2021
• From week 14 onwards, hotel occupancy in Los Cabos skyrocketed compared with Cancun
and Puerto Vallarta. By the end of week 20, occupancy was at 72.5%, surpassing Puerto
Vallarta and Cancun by 12.7pp and 15.4pp, respectively.
• Puerto Vallarta (58.8%)
• Cancun (57.1%)
SOURCE: DATATURLOS CABOS TOURISM
OBSERVATORY
DEMAND INDICATORS AND TOURIST
PASSENGERSMonthly arrivals (expressed in thousands)
Passenger arrivals at Los Cabos
International Airport, 2019-2020
• In May-2021, 251.4 thousand passengers arrived
at Los Cabos International Airport, which
represents a 9.1% increase compared to the same
period in 2019.
• It also represents a 13.3% increase with
respect to Apr-2021 and an average growth
rate of 30.4% between May-2020 and May-
2021.
• Passengers on domestic flights (89.15
Percentage decrease vs. 2019
thousand) represent 35.5% of total arrivals
and increased 10.9% compared to May-
2019.
• TMAC: 21.2% (between May-2020 and
May-2021).
• Passengers on international flights (162.25
thousand) represent 64.5% of total arrivals
and increased by 8.2%.
• TMAC: 47.3% (between May-2020 and
May-2021).
SOURCE: GAPEvolution of national and international tourism share
Participation percentage of both resident and non-resident tourist arrivals at hotels in Los Cabos, including
passenger arrivals on domestic and international flights at Los Cabos International Airport (2017-2020)
• According to DataTur, the
number of national
residents arriving at
hotels in Los Cabos
reached 25.4% in Apr-
2021 (5.4pp fewer than in
2019).
• Moreover, the share of
domestic passengers in
the total recorded by Los
37.8% Cabos International
Airport summed up to
37.8% in Apr-2021. This
30.4% represents an increase of
5.9pp vs. 2019.
25.4% • In Apr-2021, Tourist
Surveys indicated that the
share of domestic tourism
in the total received by
Los Cabos reached 30.4%
(4.4pp more than in
Passengers arriving on domestic flights Passengers arriving on international flights National tourist arrivals
International tourist arrivals National origin (survey) Foreign origin (survey)
2019).
SOURCE: DATATUR, GAP, TOURIST SURVEYSInternational tourist arrivals by air, by origin (residence), monthly
Δ Abr 21 / Δ Ene-Abr 21 /
Regiones Apr/2020 May/2020 Jun/2020 Jul/2020 Aug/2020 Sep/2020 Oct/2020 Nov/2020 Dec/2020 Jan/2021 Feb/2021 Mar/2021 Apr/2021
Abr 19 Ene-Abr 19
EE.UU. 508 1,084 12,433 41,696 45,112 50,077 93,069 100,320 105,991 70,454 66,275 120,361 131,784 -6.0% -31.7%
Canadá 13 15 52 74 106 128 563 1,126 1,429 628 44 75 66 -99.6% -99.1%
Europa 10 12 20 43 52 40 48 70 64 32 32 39 37 -96.9% -96.5%
Caribe, Centro y Sudamérica 3 - 12 34 19 33 37 48 43 19 18 31 24 -91.6% -90.1%
Resto del Mundo - 7 34 52 64 71 106 127 67 12 11 38 24 -97.7% -97.8%
Gran total 534 1,118 12,551 41,899 45,353 50,349 93,823 101,691 107,594 71,145 66,380 120,544 131,935 -17.1% -41.4%
Δ Abr 21 / Δ Ene-Abr 21 /
Mercados clave Apr/2020 May/2020 Jun/2020 Jul/2020 Aug/2020 Sep/2020 Oct/2020 Nov/2020 Dec/2020 Jan/2021 Feb/2021 Mar/2021 Apr/2021
Abr 19 Ene-Abr 19
Reino Unido 2 5 9 8 19 10 9 21 18 5 16 16 8 -97.6% -95.9%
Australia - 5 10 13 9 18 18 42 19 3 1 4 4 -99.0% -99.1%
Corea del Sur - - 1 2 3 6 5 8 3 - - 10 1 -99.2% -97.8%
Total mercados clave 2 10 20 23 31 34 32 71 40 8 17 30 13 -98.5% -97.7%
SOURCE: INM-SIOMInternational tourist arrivals by air, by origin (residence)
Annual variation of Share of international
-17.1% international tourist arrivals by
air to Los Cabos International
tourist arrivals by air to Los
Cabos International
Apr-2021 vs. Apr-2019
Airport (Jan-Apr-2021 vs. Airport (Apr-2021)
2019)
In Apr-2021, Los Cabos
International Airport
recorded the arrival of
131,935 international
tourists, which implies a
decrease of 17.1%
compared to Apr-2019.
American tourists
represent 99.9% of the
total.
SOURCE: INM-SIOMInternational tourist arrivals by air, by origin (residence), accumulated Jan-Mar
Tourist arrivals by air
Nacional Los Cabos
Regiones
Ene-Abr 2019 Ene-Abr 2021 ∆ 2021/2020 Ene-Abr 2019 Ene-Abr 2021 ∆ 2021/2020
Estados Unidos 3,738,431 2,365,762 -36.7% 569,214 388,874 -31.7%
Canadá 1,262,711 29,542 -97.7% 87,064 813 -99.1%
Europa 660,412 153,587 -76.7% 4,054 140 -96.5%
Caribe, Centro y Sudamérica 860,701 333,326 -61.3% 934 92 -90.1%
Resto del mundo 261,892 52,497 -80.0% 3,941 85 -97.8%
Gran Total 6,784,147 2,934,714 -56.7% 665,207 390,004 -41.4% -56.7%
Nacional Los Cabos
Mercados Clave
Ene-Abr 2019 Ene-Abr 2021 ∆ 2021/2020 Ene-Abr 2019 Ene-Abr 2021 ∆ 2021/2020
Reino Unido 154,244 13,116 -91.5% 1,103 45 -97.6% -41.4%
Australia 23,143 958 -95.9% 1,327 12 -99.0%
Corea del Sur 32,007 2,638 -91.8% 498 11 -99.2%
Total mercados clave 209,394 16,712 -92.0% 728 68 -98.5%
When comparing Jan-Apr-2021 vs. Jan-Apr-2019, tourist arrivals have decreased by 56.7% nationwide and by 41.4% in Los Cabos.
• On a national level, the U.S. market decreased by 36.7%, whereas the Canadian market did so by 97.7%.
• At the Los Cabos International Airport, the U.S. market decreased by 31.7%, and the Canadian market did so by 99.1% when comparing
both periods.
SOURCE: INM-SIOMCruise activity (Apr-2021)
Passengers per vessel, monthly (2019-2021)
There were no vessel or cruise ship
arrivals at the Port of Cabo San Lucas in
Apr-2021.
SOURCE: DATATUR - SCT
Passengers arriving on cruise ships at the Port of Cabo San Lucas, Vessels arriving in the Port of Cabo San Lucas, monthly
monthly (2019-2021) (2019-2021)LOS CABOS TOURISM
OBSERVATORY
TOURIST SURVEYS & GROUP BUSINESSGroup Business
RFPs received from meeting and group events, last 12 months Confirmed room nights and events, for meetings and groups
(CVENT)
SOURCE: HELMS BRISCOE
Attendees to congresses, conventions and
incentive trips (% of total tourists)
SOURCE: CVENT
SOURCE: TOURIST SURVEYSReturn rate to the destination
70%
60%
50%
42.3%
40%
38.9%
30% 33%
• 33% of tourists who arrived in Los Cabos in May-2021 had
already visited the destination, 9.3pp lower than in May-2019.
20%
10%
0%
Ene Feb Mar Abr May Jun Jul Ago Sep Oct Nov Dic Ene Feb Mar Abr May Jun Jul Ago Sep Oct Nov Dic Ene Feb Mar Abr May Jun Jul Ago Sep Oct Nov Dic Ene Feb Mar Abr May
2018 2019 2020 2021 20
SOURCE: TOURIST SURVEYS
NO INFORMATION WAS COLLECTED DURING APR-MAY-2020 DUE TO THE CONTINGENCY GENERATED BY COVID-19.Package tour purchases
60%
54.6% 54.0%
51.8%
50.6%
48.9%
50%
44.4% 45.1%
42.6%
41.3% 41.4% 42.2%
40.0%
40% 40.0% 40.5%
40.9% 41.3%
38.9% 39.9%
38.4%
35.4% 35.8%
34.1% 34.8%
30% 29.3%
25.1%
• Package tour purchases rebounded in May-2021, although
20.6%
20% 20.5% numbers haven’t reached 2019 levels.
• In May-2021, 40% of tourists in Los Cabos bought a package
tour (8.9pp below that of May-2019).
10%
0%
Ene Feb Mar Abr May Jun Jul Ago Sep Oct Nov Dic
2019 2020 2021
SOURCE: TOURIST SURVEYS
NO INFORMATION WAS COLLECTED DURING APR-MAY-2020 DUE TO THE CONTINGENCY GENERATED BY COVID-19.Timeshares
30%
27.9% 28.2%
26.4%
24.3% 24.4% 24.5% 24.1% 24.2%
25%
22.3%
22.5% 20.4% 21.8%
20.3% 21.9%
20% 19.3% 21.5%
18.3%
17.7%
18.4%
16.8% 17.6% 17.5%
15% 16.5% 16.2%
14.2%
10%
• Timeshare usage continues to decline. In May-2021,
8.0%
only 8% of tourists stayed at timeshares (16.5pp
below that of May-2019).
5%
0%
Ene Feb Mar Abr May Jun Jul Ago Sep Oct Nov Dic
2019 2020 2021
SOURCE: TOURIST SURVEYS
NO INFORMATION WAS COLLECTED DURING APR-MAY-2020 DUE TO THE CONTINGENCY GENERATED BY COVID-19.LOS CABOS TOURISM OBSERVATORY SUPPLY INDICATORS
Evolution of the hotel offer in Los Cabos and sub-destinations

          Annual variation in hotel occupancy, by destination             Annual variation of tourist arrivals to hotels, by origin
                       (Jan-Apr-2021 vs. 2019)                                           (Jan-Apr-2021, vs. 2019)

                              SOURCE: AHLC                                                     SOURCE: DATATUR

• The drop in hotel occupancy keeps decreasing as the recovery of the destination strengthens.
    • In Cabo San Lucas, the drop went from 49pp in Feb-2021 (compared to Feb-2019) to 23pp in Apr-2021.
    • The recovery in San Jose del Cabo has been greater this month: the drop went from 52pp in Feb-2021 to 22pp in Apr-2021.
    • Los Cabos Corridor improved by 20pp when comparing the differences between Feb-2021, 2019, and Apr-2021.
Evolution of the hotel offer in Los Cabos and sub-destinations
Hotel occupancy (May 2019-2021) Rooms available (April 2020-2021) Room nights (April 2019-2021)
SOURCE: AHLC SOURCE: DATATUR SOURCE: DATATUR
CABO SAN LUCAS SAN JOSE DEL CABO LOS CABOS CORRIDOR
• Hotel occupancy was at 59%, which implies • Occupancy dropped 8pp (55%) when • Occupancy was at 51% in May-2021, which
a decrease of 18pp (May-2021 vs. May- comparing May-2021 to May-2019 (AHLC). implies a decrease of 2pp (AHLC).
2019, AHLC). • Its hotel offer increased 8.4% between Apr- • Its hotel offer increased 15.9% between Apr-
• Its hotel offer increased 8.9% between Apr- 2019 and Apr-2021, registering 4.87 2019 and Apr-2021, registering 4.6
2019 and Apr-2021, registering 8,377 thousand rooms (DataTur). thousand rooms (DataTur).
(DataTur). • Occupied room nights dropped 18.4% • Occupied room nights increased 21.5%
• Occupied room nights dropped 15.2% between Apr-2019 and Apr-2021 (DataTur). between Apr-2019 and Apr-2021 (DataTur).
between Apr-2019 and Apr-2021 (DataTur).Evolution of the RevPAR and the average hotel rate in Los Cabos & sub-destinations
Average Hotel Rate, Los Cabos (USD, 2019-2021)
• The average hotel rate in Los Cabos for May-2021 was USD 286, 10 dollars
above the last 12-month average and 26 dollars above that of May-2019.
• Cabo San Lucas showed an increase of USD 15 (+7.1%), registering USD
225.
• San Jose del Cabo increased its rate by USD 8 (+3.2%) and reached USD
257.
• In contrast, the average rate of Los Cabos Corridor decreased by USD 1
compared to 2019 (-0.3%), registering USD 377.
• The RevPAR in May-2021 was USD 163, 24 dollars (-12.8%) below the one
recorded in May-2019.
RevPAR Los Cabos (USD, 2019-2021) Average Hotel Rate, Sub-destinations (USD, monthly, last 12
months)
SOURCE: AHLCSOURCE: OAG Domestic air connectivity
SEATS SCHEDULED FROM JUN-2021 TO NOV-2021 Seat scheduling for flying to San Jose del Cabo (from Jun-2021 to Nov-2021)
Seat offer report for the month in question and the following 6
months, as the case may be +14.3%
• There are 665.6 thousand seats scheduled for the next 6 months
(from May-2021 to Oct-2021), 14.3% more compared to the same
period in 2019.
• However, when comparing the seats scheduled for the next 6
months against the 2020 schedule (pandemic), the volume of +53.9%
programmed seats is 53.9% higher.
• There are 19.8% more available seats expected for Jun-2021
than those scheduled for Jun-2019.
• Mexico City, GDL, and Tijuana are the most relevant issuing
markets, having 46%, 17%, and 19% of total available seats (for
the next 6 months), followed by Monterrey (9%), Culiacan (5%),
Leon (2%), and Hermosillo (SOURCE: OAG International air connectivity
SEATS SCHEDULED FROM JUN-2021 TO NOV-2021
Seat offer report for the month in question and the following 6 Seat scheduling for flying to San Jose del Cabo, international total
(U.S., Canada, and United Kingdom, from Jun-2021 to Nov-2021)
months, as the case may be
• For the U.S., there are 1.24 million seats scheduled for the next 6 months,
which is 53.1% more seats compared to the same period in 2019. +48.4%
• However, when comparing the seats scheduled for the next 6 months
against the 2020 schedule (pandemic), the volume of programmed
seats is 129.2% higher.
• CHI (+110%), LAX (+64%), PHX (+29%), HOU (+40%), DFW (+31%),
DEN (+180%), and SEA (+594%) have the most significant increase in
service vs. 2019. However, a decrease of 51% is observed in San +133.6%
Diego.
• Los Angeles is the main issuing market in the U.S. (23% of the market),
followed by DFW (13%), Houston (11%), and Phoenix (8%).
• American, Alaska, Southwest, and United Airlines are the most
relevant (79% as a whole).
• For Jun-2021, the United States expects 31.2% more available seats
than those scheduled for 2019.
• For Canada, there are 30.2 thousand seats scheduled for the next 6
months, which is 32.8% fewer seats compared to the same period in 2019.
• When comparing the seats scheduled for the next 6 months against
the 2020 schedule (pandemic), the volume of programmed seats is
1,075% higher.
• There are 95.7% fewer available seats expected for Jun-2021 than
those scheduled for Jun-2019.
• All airports show a decrease in service within the next 6 months:
Calgary (-17.4%), Vancouver (-34.5%), Toronto (-68.7%), and
Edmonton (-49.9%).
• During this period, Swoop will reduce the number of seats by 100%.
Air Canada, Sunwing, and WestJet will do so by 90%, 96%, and 14%,
respectively (compared to those scheduled for 2019).
• Load factors of international airlines for Mar-2021 were: American (35%),
Alaska (37%), Delta (32%), United (44%), and Southwest (45%).LOS CABOS TOURISM OBSERVATORY PUBLIC RELATIONS
Public relations: notes and scope
• In the domestic market:                                                            CANADIAN MARKET NOTES: TOTAL & SCOPE
      • During May-2021, 28 placements were introduced, accounting for 2.9
        million impressions. An average of 46 placements has been published
        monthly since the pandemic started in April 2020, with a monthly
        reach of 3.6 million.

• In the international market:
      • In May-2021, 11 placements and 622 thousand impressions were
        achieved in the United States. An average of 26 placements has been
        published monthly since the pandemic started, with a monthly reach
        of 884 thousand.
      • No placements were delivered in Canada throughout May-2021. An
        average of 7 placements has been published monthly since April, with                         SOURCE: JESSON+CO
        a monthly reach of 4.9 million.
                  NATIONAL NOTES: TOTAL & SCOPE                                          U.S. MARKET NOTES: TOTAL & SCOPE

SOURCE: GAUDELLI (Feb-2018 to Jan-2019), LLORENTE & CUENCA (Feb-2019 to Apr-   SOURCE: NJF (Feb-2018 to Jan-2019), OGILVY (Feb-2019 to Apr-2021)
                                   2021)
LOS CABOS TOURISM
OBSERVATORY
DEFINITIONSDefinitions
• Congress. Non-business-oriented meetings in which people gather in large groups, generally to discuss and exchange points of view on a topic of interest (including professional,
cultural, sports, theological, social, governmental, academic, and more). These meetings often last several days and have simultaneous sessions, as well as a predefined
multiannual or annual periodicity.
• Convention. Trade or business meetings usually sponsored by a corporation, where participants represent the company, corporate group, or customer-supplier relationships.
Their participation could be mandatory, so travel expenses are borne by the corporation. This category includes general and formal legislative, social or economic meetings, to
provide information, deliberate, establish consensus or deal with participants’ policies, as well as address a market's, product's or brand's commercial issues. It may include a
secondary presentation element.
• Available romos. The number of rooms in service. It doesn't account for out of service rooms due to repair or some other cause.
• Tourist destination. The main target of a tourist's trip. The visiting place is fundamental for the decision-making process to plan a trip. The main reason for the trip.
• Seasonality. It means that tourist flows tend to be distinct across different seasons (around certain times of the year), repeating this process annually.
• Length of stay. It results from dividing the total number of room nights by the number of bookings per month. The obtained result expresses the number of days a tourist stays.
• Events or incentive trips. Incentive travel is a new strategy that recognizes people who have reached or exceeded goals generally related to sales or productivity. It is addressed
to participants who have better job performance, gifting them with a remarkable travel experience.
• Room nights. Obtained from the daily number of rooms occupied by tourists, times their length of stay (number of nights that they spend in the establishment). Classified
according to the place of origin, and residency or non-residency status.
• Inflation. General and continuous rise in the prices of goods and services marketed in an economy. It is the average growth rate of the goods and services' prices between one
period and the next.
• Underlying inflation. The prices’ increase in a subset of the INPC (National Consumer Price Index), which includes generics with less volatile prices. It measures the inflation
trend in the medium term. The 283 generic concepts that make up the goods and services basket of the INPC are classified into subsets that respond to particular needs of
analysis. Among the most well-known classification, there is the object of expenditure, which refers to the origin of goods and services' sector; and the durability of goods and the
underlying inflation.
• Passenger arrivals. Passengers carried on scheduled services by airlines.
• Tourist arrivals. Corresponds to the number of tourists that visited the establishment throughout the month.Definitions
• Visitor’s nationality. Granted by the country that issues the passport or other identity documents, even when residing in another country.
• Non-resident. The person whose habitual environment is outside the Mexican territory and visits the latter for less than 12 months for any reason (including business, vacation,
and more), excluding those who get paid for working in activities at the visiting place.
• Hotel occupancy. The accommodation occupancy rate is a supply-based concept. It is an important indicator that provides information on the use of different accommodation
types and, if the data is obtained monthly, it also indicates the seasonal pattern use of tourist accommodations.
• RevPAR. RevPAR is the most important metric used in the hotel industry to assess the financial performance of an establishment or a chain (it assesses a property's ability to fill
its available rooms at an average rate). RevPAR is short for Revenue Per Available Room (income per available room). It refers to a specific period (weekly, monthly, annual, etc.).
One way to calculate RevPAR is through the formula: RevPAR = It/ΣHt, where It equals the total room revenue and ΣHt equals the number of rooms available during a period (the
multiplication of total establishment’s rooms by the room nights in that period, minus the number of rooms that are not available).
• Resident. Individual who lives permanently or on a long-term basis in the territory of the United Mexican States.
• Residence. The place/country where the traveler has stayed most of the past year (12 months), or has stayed for a shorter period and plans to return within 12 months to live in
that country.
• Average daily rate. Commonly known as ADR. It is a statistical unit that represents the average rental income per paid occupied room in a given period. Along with the
occupation of the property, both are the basis of the property's financial performance. ADR is calculated dividing room revenue by the number of rooms sold. Houseguest rooms
(also known as "house use") and free rooms (known as "complementary rooms") should be excluded from the denominator.
• Tourist. Any individual who travels outside their usual environment for less than 12 months for any reason, except those who engage in activities that will generate income at the
travel destination: refugees or migrant workers, diplomats, seasonal workers, or travel employees.
• Visitor. Any individual who travels outside their usual environment for less than 12 months for leisure, business, religious, medical, or other reasons. Exceptions include people
who engage in activities that will generate income at the travel destination: refugees or migrant workers, diplomats, seasonal workers, tourism employees, or people looking for a
new residence or job.LOS CABOS TOURISM OBSERVATORY
All rights reserved. Total or partial reproduction is prohibited.
Developed by STA Consultants S.C.
www.staconsultores.com | info@staconsultores.comYou can also read