Research Progress of Urban Heat Wave Environment - IOPscience
←
→
Page content transcription
If your browser does not render page correctly, please read the page content below

IOP Conference Series: Earth and Environmental Science

PAPER • OPEN ACCESS

Research Progress of Urban Heat Wave Environment
To cite this article: Yimeng Gong et al 2021 IOP Conf. Ser.: Earth Environ. Sci. 634 012034

View the article online for updates and enhancements.

                               This content was downloaded from IP address 46.4.80.155 on 24/03/2021 at 01:45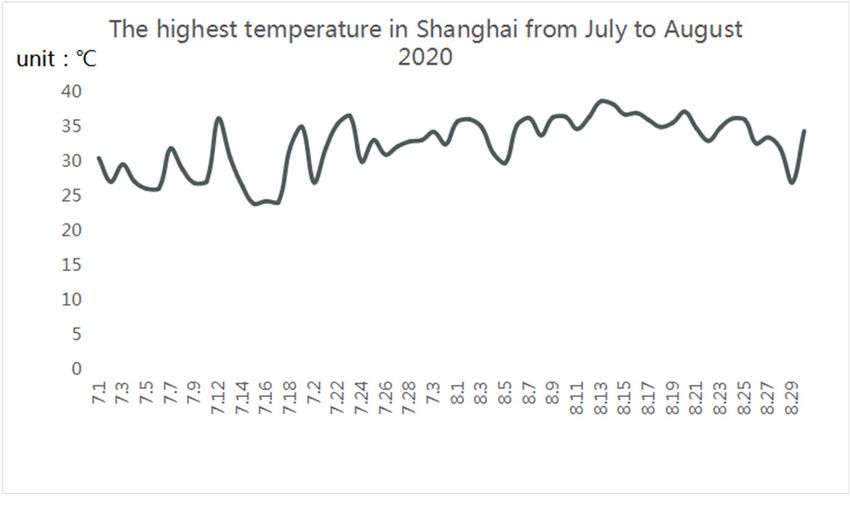
CCESEM 2020                                                                                                    IOP Publishing
IOP Conf. Series: Earth and Environmental Science 634 (2021) 012034                        doi:10.1088/1755-1315/634/1/012034

Research Progress of Urban Heat Wave Environment

                     Yimeng Gong1, Aiping Gou2 and Ming Tang1*
                     1
                      Cological Technology and Engineering, Shanghai Institute of Technology, Shanghai,
                     201418, China
                     2
                      Cological Technology and Engineering, Shanghai Institute of Technology, Shanghai,
                     201418, China
                     *
                         186111116@mail.sit.edu.cn
                     *
                         Corresponding author’s e-mail: 294841510@qq. com

                     Abstract. High temperature heat wave is one of the disasters with higher frequency and greater
                     impact in extreme weather. This article starts with the definition, disaster and health,
                     influencing factors, prevention and control of high temperature heat wave. The results show
                     that: (1) The current situation of high-temperature heat waves is obvious. After 2000, my
                     country's high-temperature heat waves showed a rapid growth trend. The high-temperature
                     heat waves lasted for a long time and the highest temperature exceeded the historical extreme.
                     ②High temperature and heat waves have a major impact on human health, and at least they
                     may induce heatstroke and other symptoms, and may cause death. And high temperature not
                     only directly harms human health, but also indirectly affects the human body from the
                     environment, such as inducing malaria. ③ Currently, the research on the influencing factors
                     of high temperature heat wave generally conducts quantitative and qualitative research on the
                     thermal environment from the on-site environmental assessment, high temperature heat wave
                     model, and thermal simulation. ④At present, my country's prevention and control of high-
                     temperature heat waves started relatively late, and the construction of developed countries
                     such as Japan, the United States, and Germany, which are more comprehensive in prevention
                     and control, is less complete.

1. Introduction
With the global climate change, extreme weather has become more and more frequent in recent years,
which has a significant impact on people's physical and mental health. According to the global Risk
Report from 2017 to 2020, extreme weather has now become the first risk facing human survival.
Among all types of extreme weather, extreme high temperature heat waves have the highest
probability of occurrence, the largest impact range, and the strongest risk hazard. Although extreme
weather is unevenly distributed in space, if there is no proper response policy when a disaster occurs,
it is not only for disasters. The destruction of the physical space of the location will also have a
significant impact on the local society and economy, such as the Chicago heat wave in 1997 and the
European heat wave in 2003[1].
    The definition of high temperature has two main categories, single-element and multi-element.
Single element refers to the division based on temperature. The international standard of the World
Meteorological Organization (WMO) defines the heat wave: the maximum daily temperature is above
32℃and lasts for more than 3 days. The China Meteorological Administration defines a high-
temperature heat wave as: a daily maximum temperature of 35°C is defined as a high-temperature day,
              Content from this work may be used under the terms of the Creative Commons Attribution 3.0 licence. Any further distribution
              of this work must maintain attribution to the author(s) and the title of the work, journal citation and DOI.
Published under licence by IOP Publishing Ltd                          1
CCESEM 2020 IOP Publishing
IOP Conf. Series: Earth and Environmental Science 634 (2021) 012034 doi:10.1088/1755-1315/634/1/012034
and a high-temperature day with more than 3 consecutive days is called a high-temperature heat
wave[2]. Multiple factors combine various indicators. For example, the United States and Canada
often judge the high temperature index based on indicators that affect the human body such as
temperature, relative humidity, and wind speed[3]. The Fifth Assessment Report of the United
Nations Intergovernmental Panel on Climate Change (IPCC) in 2013 pointed out that the temperature
has increased significantly in the past few decades. The average global surface temperature rose by 0.
85°C from 1880 to 2012. The development situation will rise by 0. 3°C-0. 7°C from 2016 to 2021,
and the temperature will continue to rise by 0. 3°C-4. 8°C until the end of the 21st century[4]. In
2016, the team of Professor Zhang Ren from the PLA University of Science and Technology studied
753 weather stations in China from 1983 to 2012 and found that China’s temperature has fluctuated
and increased since 2000. The frequency of high temperatures in the past decade has increased
significantly compared with the past, which is much higher than the historical average. In 2010,
there were 11, 342 high-temperature weather at the highest peak in 2010, and the high-temperature
average was twice that of the 1980s[5]. In 2013, 8 provinces (cities) including Jiangnan, Jianghuai,
Jianghan and Chongqing had an average high temperature of 31. 6d, which was nearly double the
previous average of 15. 1d[6]. In the summer of 2018, there was a severe fever in the northern
hemisphere. From July 14 to August 25, China’s Central Meteorological Observatory issued a high
temperature warning for 33 consecutive days, the longest high temperature warning since 2010, with
57 meteorological observatories. The highest temperature on the release day broke the historical
extreme value[7]. In 2020, El Niño is likely to cause a warm winter, and southern China’s summers
are hot for a shorter period of time. The statistics of the highest temperature in Shanghai from July to
August in 2020 (Figure 1) found that there are more than 38 days with temperatures above 32°C and
over 35 days on the 19th. ℃, the heat wave phenomenon is still obvious.
Figure 1. The daily maximum temperature in Shanghai from July to August 2020.
2. The harm of high temperature heat wave to human body
According to research, the most suitable temperature for the human body is between 15-25℃. When
the temperature exceeds the suitable value, every 1℃ increase, the risk of death increases by 1.03
times[8]. When a person is exposed to high temperatures, heat-related diseases can occur, and their
body cannot be sufficiently cooled by sweating. Symptoms range from mild swelling, rash, or cramps
to heat stroke that can be fatal. High temperature heat waves will cause the body's own temperature
regulation organs to be extremely overloaded, causing damage to the original functions of the organs
and destruction of inter-organ tissues, thereby inducing diseases or causing aggravation of diseases
and causing deaths. The mortality rate of people during high temperature heat waves is compared
with other people. The time period has increased significantly. Cardiovascular and cerebrovascular
diseases, heatstroke and other heat-related diseases are the more common causes of death; in addition,
high temperature heat waves can also cause water and electrolyte disturbances, kidney failure,
urinary tract infections and other diseases[9].
2CCESEM 2020 IOP Publishing
IOP Conf. Series: Earth and Environmental Science 634 (2021) 012034 doi:10.1088/1755-1315/634/1/012034
Table 1. Statistics of different countries
Country Date Case
14, 802 people died during the 20-day heat wave.
France Year 2003 Approximately one-third of the deaths were recorded directly
from heat stroke.
The highest record in 130 years. From August 4th to 13th,
United Kingdom Year 2003
2045 people died of heat in just 9 days.
From 2001 to 2010, approximately 28, 000 people in 20 U. S.
states were hospitalized for high temperature related diseases.
In 2004, there were an average of 1. 1 cases of related diseases
per 100, 000 people. In 2006, there were 2. 5 cases of related
diseases per 100, 000 people. The average incidence in 2010
was 1. 8 cases. The death rate is even higher. From 1979 to
United States 1979 to 2014 2014, the death rate caused by direct exposure to high
temperature (or a potential cause of death) hovered at 0.5 to 1
per million people, and there was an increasing trend in certain
time periods. Since 1979, about 9, 000 Americans have died
from heat-related causes, and about a quarter of heat-related
deaths are directly related to cardiovascular and cerebrovascular
diseases.
In the 33 years from 1975 to 2007, the number of deaths due to
heat waves was 5877, with an average of 178 per year. After
1995, the number of deaths due to heat waves was significantly
Japan 1975 to 2007
higher than before 1994. Akita Prefecture had the highest death
rate, followed by Luer. Island and Gunma, lower in
Hokkaido, Kanagawa and Nagano.
In 1983, the number of deaths due to the high temperature and
heat wave was about 17 times that in 982, in 1988 it was about
100 times that in 1987, and in 1998 it was about 190 times that
in 1998. In 1998, the death toll was the highest at 1, 658
India 1983 to 2012
people. There were 33 heat waves, and they all set new highs at
the end of the 20th century. In April, May, June and July 2012,
India experienced severe heat waves. The total number of
deaths reached 575.
The risk of non-accidental deaths caused by heat waves in China is relatively high. Only between
2006 and 2011, the number of deaths caused by heat wave exposure in Northeast China accounted for
2.35% of the number of deaths in the region, ranking first in the country with 1520 people; followed
by North China In the region, the attributable heat wave exposure resulted in a total of 861 cases with
a mortality rate of 1.79%; then in Central China and East China, the attributable mortality rate was
1.79% and 1.64%, respectively, and the attributable death rate was 1933 and 2140; finally, the
Southwest and East China regions In South China, the attributable mortality rate is 1.27% and 0.24%,
and the number of deaths is 1470 and 194. The data in Northwest China is not clear due to statistical
problems[10].
High temperature disasters not only directly harm human health, but also indirectly affect the
human body from the environment; for example, rising temperature provides favorable conditions for
the parasitism, reproduction and transmission of vectors and pathogens, and enhances their ability to
treat diseases, thereby harming them. Human health, research shows that whenever the global
temperature rises by 1℃, the potential pollution hazard of dengue fever will increase by 3.1%-4.7%,
and the global incidence of malaria will increase greatly, posing a major challenge to the field of
public health[11]. High temperature and heat waves can also cause the destruction of water bodies,
3CCESEM 2020 IOP Publishing
IOP Conf. Series: Earth and Environmental Science 634 (2021) 012034 doi:10.1088/1755-1315/634/1/012034
the imbalance of ecological balance, and the melting of permafrost glaciers, which will have a
significant impact on human survival.
3. Research on the influencing factors of heat wave disasters
The analysis and research on the factors affecting high temperature heat waves are generally divided
into three categories: site environmental assessment, model research, and thermal simulation. On-
site environmental assessment generally involves directly scoring the factors affecting heat at the
survey site and setting weights to obtain the evaluation score, and dividing the evaluation interval to
compare different locations. Model research generally involves obtaining heat wave-related data
through the Internet or on-site to construct analysis models for analysis and comparison. Thermal
simulation generally uses simulation software to model or visualize the analysis area, and to compare
the gap before and after the analysis by changing the parameters of the influencing factors.
3.1. On-site environmental assessment of high temperature heat wave
At present, there are three commonly used methods of on-site environmental evaluation: POE evaluat
ion method, Defil method evaluation and AHP analytic hierarchy process.
(1) POE evaluation method: The evaluation takes the feelings of local residents as the main body a
s the starting point to obtain complete evaluation data of the thermal environment in the life system to
analyze the comprehensive index of the built thermal environment[12-13]. Evaluation ideas:1. Surv
ey/understand the situation, complete through visits, conversations and document review. 2. The res
earch method setting (determine the question to be investigated, the object, the method, the content t
o be tested, the index, etc.) is completed through the investigation. 3. Data collection (user's subjectiv
e perception of the physical environment, objective measurement of the physical environment, such a
s temperature, humidity, light, sound, working area, traffic distance) survey users determine the obj
ective physical environment to determine the number of survey objects to obtain. 4. Data analysis (usi
ng data analysis method).
(2) Fadfair method: also called the expert investigation method. It was founded and implemented
by the American Rand Corporation in 1946. On the basis of setting the research question, firstly solici
t expert opinions on the question, sort it out, summarize and count it; then anonymously feed back the
statistical results of the previous round to the experts for the second round of opinion collection, summ
ary and statistics And feedback, iteratively until the consensus of the experts is obtained, and the opini
on is used as the evaluation standard[14].
AHP Analytic Hierarchy Process: Proposed by the American operations researcher Professor T.L.
Saaty in the 1970s, it is a combination of quantitative and qualitative analysis methods. It is a scienti
fic system engineering decision-making method. Its main idea is to divide complex problems into var
ious constituent factors, and establish a hierarchical structure model for these factors according to the
dominant relationship. Through the pairwise comparison of the factors at each level, the relative imp
ortance is judged, and finally the judgment matrix is constructed to calculate the weight of each (level)
index. In the actual problem, the problem is divided into various levels, weights are assigned to the
measured target, and the results are obtained by constructing the judgment matrix formula in the com
puter to compare the results. The AHP analytic hierarchy process is used in multiple fields to evaluat
e and analyze complex problems. Get evaluation results[15].
3.2. High temperature heat wave model
He Xiaodong et al. constructed a gridded urban canopy parameter model to use the current and
predicted weather conditions, field observations and kilometer-scale simulations to study the behavior
of local-scale urban heat islands during a heat wave in Beijing. This is currently the most common
heat wave research model[16]. Sun Yijie’s team analyzed the characteristics of drought and heat
waves in the Loess Plateau from 1960 to 2016 with the help of high temperature thresholds and
standardized precipitation indicators, and used superimposed statistical analysis methods to find the
trend of simultaneous drought and heat wave events[17]. From the perspective of geography, Xue
4CCESEM 2020 IOP Publishing
IOP Conf. Series: Earth and Environmental Science 634 (2021) 012034 doi:10.1088/1755-1315/634/1/012034
Qian and others used spatial assessment as an entry point to formulate three assessment frameworks
(stress-state-response vulnerability assessment, socio-economic system vulnerability assessment, and
man-natural coupling vulnerability assessment) to analyze high temperature heat waves The
vulnerability[18]. Chen Kai et al. took the single high temperature and heat wave event in Beijing as
the research object and formulated three new vulnerability assessment frameworks (natural disaster-
oriented vulnerability evaluation, socioeconomic-oriented vulnerability evaluation, and
comprehensively-oriented vulnerability evaluation), and identified The spatial distribution of the
vulnerability of high-temperature heat waves in central Beijing[19]. Seung-Ki Min and others used
high-resolution large-scale regional climate models (RCM) and global climate models (GCM) to
quantify the contribution of humans to the duration of the longest summer heat wave in South Korea
in 2018. They compared the real world and the counterfactual world (no The possibility of extremely
long duration of heat waves between human influences)[20].
3.3. Thermal simulation
Thermal simulation mainly analyzes the thermal environment under different conditions by constructi
ng a 3D model and changing parameters. At present, the more common simulation software is ENVI
-met and PHOENICS two microclimate simulation software[21]. ENVI-met is a three-dimensional n
on-stationary microclimate model, including a simple one-dimensional soil model, radiation transfer
model and vegetation model (Bruse and Fleer, 1998). The software was developed by Professor M.
Bruse of University of University. ENVI-met can carry out qualitative and quantitative research on ur
ban thermal environment by accurately controlling all atmospheric parameters combined with GIS and
remote sensing technology. PHOENICS is a CFD (computational fluid dynamics) software. It is the
world's first commercial software for calculating fluid and heat transfer developed by CHAM in 1981.
It can be directly imported from SketchUp, AutoCAD, Rhino and Revit, thus The modeling process
is simplified and the research efficiency is improved. By changing the parameters, the range of sunli
ght exposure, wind environment and heat flow can be obtained[22].
4. Prevention and control of heat wave disasters at home and abroad
Japan responded to the high temperature heat wave earlier. In 1991, Tokyo promulgated the urban
greening law and officially started to deal with the high temperature heat wave from the regulations.
The main measures: 1. Strengthen urban greening and improve the nature of the underlying surface of
the city 2. Strengthen the observation and forecast system 3. Reasonable planning Urban building
layout to improve the urban ecological environment 4. Reduce urban man-made heat emissions 5.
Utilize urban water bodies, expand urban water surface area, and effectively use water resources 6.
Develop new pavement materials 7. Build underground pipe cooling systems 8. Use natural wind The
sea breeze cools the heat island; the main measures in the United States are: 1. Planting trees and
vegetation on the roof 2. Painting the buildings with white paint 3. Changing the pavement to bright
colors to alleviate the urban heat island effect 4. Controlling the urban population; Germany was the
first in the world to develop green roofs and The technology is leading in the world, the roof greening
rate is more than 14%, and the pavement reconstruction has been carried out since the 1980s. At
present, 90% of the roads in the cities of the country are permeable pavements[23]. The prevention
and control of high temperature heat waves in my country started late, and there are few written
records that can be found. At present, the main measures are to increase roof gardens, increase urban
green area, improve urban wind environment, increase urban air duct planning, reduce urban man-
made heat emissions, and build urban high temperature warning mechanisms. Enhance the public's
awareness of the prevention and control of urban heat waves, etc. Style and spacing
5. Footnotes
A large number of scholars in my country began to pay attention to urban thermal environment and
heat wave disasters only after 2010. Judging from the papers published after 2020, my country’s
current research papers on heat wave disasters rank second only to the United States, but my country
5CCESEM 2020 IOP Publishing
IOP Conf. Series: Earth and Environmental Science 634 (2021) 012034 doi:10.1088/1755-1315/634/1/012034
has published a large number of papers, But the center has low intermediary and low quality, and has
less influence. The future research on heat waves in my country should not be limited to evaluating
the heat waves of the city as a whole or urban agglomerations from the macro perspective of the city.
It is also possible to start from the meso and micro perspectives of a certain area or several locations in
the city, which is more conducive for city managers to formulate different heat wave prevention and
control standards for different types of land in accordance with local conditions, and to deal with high
temperature heat waves scientifically and effectively.
References
[1] Huang, X.J., Wang, B., Guo, M.M., Li,Y.Y. (2020)High temperature characteristics and so
cial vulnerability evaluation of Chinese cities. Geographical Research, 39(07): 1534-15
47.
[2] Xu, D.D, Ban, J., Chen, C., Zhang, Y., Wang, W. T., Li, X.Y. (2017)The impact of high tem
perature and heat wave events in Shanghai from 2013 to 2015 on the risk of death. Journal
of Environment and Health, 34(11): 991-995.
[3] Wei, H.R., Wang, Y., Gao, Y.P., Xie, J.M. (2016)The characteristics of high temperature heat
wave circulation in Yuncheng City and its impact on human health. . (eds. ) The 33rd An
nual Meeting of the Chinese Meteorological Society S16 Climate Change and Human Health.
Xi'an . pp. 198-204.
[4] IPCC.(2014) Climate change 2013: the physical science basis[EB /OL]. http: / /www. i
pcc. ch /report /ar5 /wg1 /#. Uq-tD7KBRR1.
[5] Zhang, J.H., H, B., Liu, X.Q., Nie, J.D., Wang, J. (2020)Knowledge Atlas Analysis of Heat
Wave Research Based on CiteSpace. Climate Change Research Progress, 16(03): 383-389.
[6] Wang, L.W., Wang, C.C, Wang, Y.P., Xu, J., Huang, X.L. (2016)The formation mechanism of
high temperature and heat wave in North China and East China. . (eds. ) The 33rd Annual
Meeting of the Chinese Meteorological Society S6 East Asian climate variability and extrem
e events and their prediction. Xi'an. . pp. 23-32.
[7] Zhang, J.Y., Qian, C. (2020)Linear trend analysis method and change trend of China's high te
mperature heat wave from 1960 to 2018. Climatic and Environmental Research , 25(0
3):225-239.
[8] Hajat, S. Kovats, R.S. , Lachowycz, K. (2007)Heat -related and cold -related deaths in Eng
land and Wales:who is at risk. Occup Environ Med, 64:93-100.
[9] Huang, C.R. (2020)How does climate change affect human health? . Sustainable Development
Economic Guide , 05:26-28.
[10] Lin, Q.X. (2017). Research on the definition of heat waves and death burdens in different regi
ons of China based on death risk assessment (Master's thesis, Jinan University).
[11] Wang, MZ., Zheng, S., Wang, S.G., Shang, K.Z. (2012)Research progress on the impact of hig
h temperature heat waves on human health. Journal of Environment and Health , 29(0
7):662-664.
[12] Kui, J.Q., Peng, Y.L., Zhou, P.G, Wang, R., Yang, B. (2019)A preliminary study on the role o
f POE evaluation in the renewal of urban public spaces. Huazhong Architecture (09), 70-7
3. 56
[13] Zhao, D.H. (2007)Post-use evaluation of the development characteristics of POE abroad and it
s applicability in China. Journal of Peking University (Natural Science Edition), 37(0
9): 797-802. 533
[14] Chen, N., Xiang, H., Ye, Q., Zhu, X.T. (2016)Research on a flexible city evaluation system ba
sed on analytic hierarchy process. Journal of Hunan University (Natural Science Edition) ,
43(07):146-150.
6CCESEM 2020 IOP Publishing
IOP Conf. Series: Earth and Environmental Science 634 (2021) 012034 doi:10.1088/1755-1315/634/1/012034
[15] Li, B., Zhu, S.H., Lu, Y.X., Li, D.S. (2019)Urban earthquake disaster risk assessment based on
the analytic hierarchy process. Sichuan Architecture Science Research , 02:21-27.
[16] He, X., Wang, J., Feng, J., et al. (2020)Observational and modeling study of interactions betwe
en urban heat island and heatwave in Beijing. Journal of Cleaner Production,247:119-16
9.
[17] Sun, Y.J., Liu, X.F., Ren, Z.Y. , Duan, Y.F. (2020)Temporal and spatial changes of drought an
d heat waves in the Loess Plateau from 1960 to 2016. Advances in Geographical Sciences ,
39(04):591-601.
[18] Xue, Q., Xie, M.M., Guo, Q. Wang, Y.N., Wu, R.R., Liu, Q. (2020)Research progress in urban
high temperature heat wave vulnerability assessment from the perspective of geography. A
dvances in Geographical Sciences , 39(04): 685-694.
[19] Chen, K., Tang, Y. (2019)Urban high-temperature heat wave vulnerability identification and pl
anning strategy response: a case of Beijing central city. Urban Planning , 43(12):37-4
4+77.
[20] KIM, Y., Choi, Y. (2020) A Study on the Characteristic Analysis of Extreme High Temperatur
e Phenomenon in Korea by Geographic Spatial Range Type . Journal of the Korean Geogra
phical Society, 55(2): 83-95.
[21] Huttner, S. (2012)Further development and application of the 3D microclimate simulation EN
VI-met. Mainz: Johannes Gutenberg-Universitat in Mainz. 147.
[22] Shang, Y. (2020)PHOENICS-based Simulation Study on Winter Wind Environment in Outdoo
r Space of Old Communities—Taking Sanlihe Community of Beijing as An Example. IOP
Conference Series: Earth and Environmental Science. IOP Publishing, 560(1): 012064.
[23] Zhang, Q.Y., Zhao, H.L. (2018)How to prevent high temperature weather in cities abroad. W
orld Environment, 05: 82-85.
7You can also read