Adults' Media Use & Attitudes report 2020 - Making sense of media - Ofcom
←
→
Page content transcription
If your browser does not render page correctly, please read the page content below

Adults’ Media Use & Attitudes
                         report 2020

Making       Making
sense        sense
o f media    of media     Published 24 June 2020

Gwneud       Gwneud
synnwyr ’r   synnwyr ’r
Overview
This report examines adults’ media literacy. Ofcom’s definition of media literacy is ‘the ability to use,
understand and create media and communications in a variety of contexts’. The report is a reference
document for industry, stakeholders and the general public.

The Communications Act 2003 places a responsibility on Ofcom to promote, and to carry out
research into, media literacy. This report supports our work in this area and our wider Making Sense
of Media programme.

Drawing largely on our quantitative Adults’ Media Literacy Tracker, the report provides evidence on
media use, attitudes and understanding, and how these change over time, among UK adults aged 16
and over. This includes a particular focus on critical thinking, or awareness, which is a core
component of media literacy, enabling people to assess and evaluate their media environment. The
report also includes a particular focus on those groups who tend not to participate digitally.

This report also draws on our qualitative Adults’ Media Lives research 1 and quantitative Technology
                                                                             0F

Tracker to provide an over-arching narrative on the key themes of adults’ media experience in 2019.
More detail, including additional demographic analysis and all questions that were not possible to fit
in this report, can be found in the accompanying full chart pack.

It is important to note that fieldwork for the Adults’ Media Literacy Tracker was carried out in
autumn 2019, so the current coronavirus concerns and restrictions were not a factor. We recognise
that a number of the trends may have changed and/or intensified during the current crisis.

1
  Our Adults’ Media Lives research is a qualitative, longitudinal ethnographic video-based project which has
been running since 2005. The research has followed the same (as far as possible) 19 participants over time,
interviewing them at home to understand their relationship with digital media.

                                                          1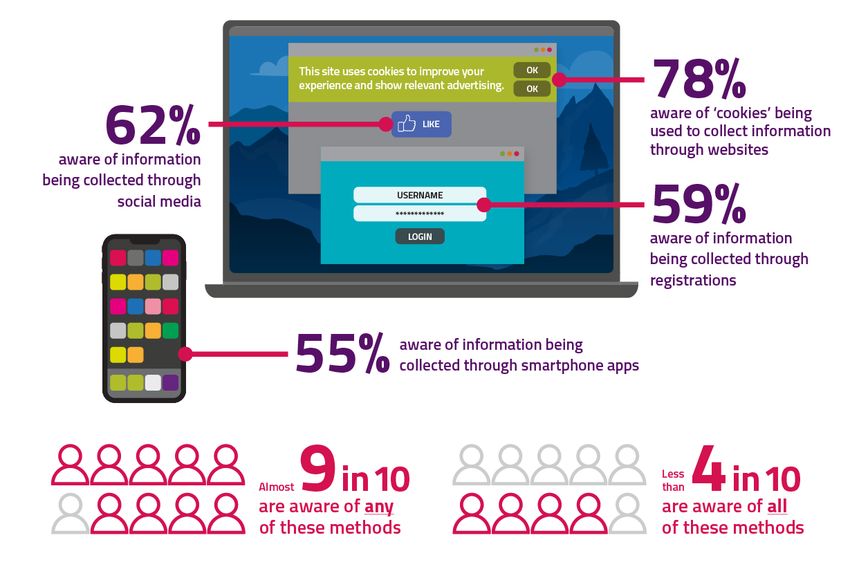
Key findings:
Digital media take-up and use

•   Adults increasingly prefer smaller, portable devices for going online: 34% only use devices
    other than a computer to go online, an increase since 2018, and 11% only use a smartphone to
    go online.

•   Connected devices and smart technologies are increasingly being adopted.

•   Thirteen per cent of UK adults do not use the internet, unchanged since 2014, and three-
    quarters of them say that nothing would encourage them to go online in the next 12 months.

•   Those aged 55+ or in the DE socio-economic group remain less likely to go online.

•   Two-thirds of UK adults access content on demand, an increase since 2018.

•   Social media users are increasingly using multiple social media sites/apps.

•   Internet users are less likely than in 2018 to agree that people should be able to hide their
    identity online to express their views anonymously.

•   Device use and online activity can also impact critical engagement.

Critical understanding

•   Internet users are less likely than in 2018 to validate online information sources, and one in
    ten internet users do not consider the truthfulness of factual information they find online.

•   People are increasingly aware of personal data issues, but there is still a gap between their
    stated confidence in managing personal data and their understanding of the different ways in
    which companies collect personal data online.

•   Similarly, there is a continued gap in confidence vs. understanding of online advertising; only
    half of search engine users can correctly identify advertising on Google search results and
    understand that this is the only reason these results appear at the top of the list.

                                                     2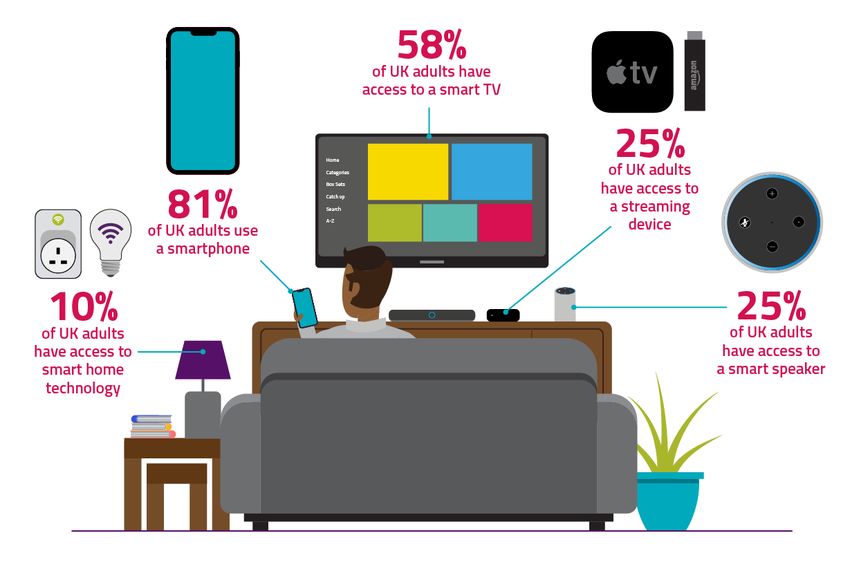
Media use, by age: a snapshot
16-24s:                                               25-34s:

99% use a mobile phone                                99% use a mobile phone
16% only use a smartphone                             20% only use a smartphone
to go online                                          to go online
76% watch on-demand or streamed content               77% watch on-demand or streamed content
95% have a social media profile                       93% have a social media profile
44% correctly identify advertising on Google          54% correctly identify advertising on Google
(among search engine users)                           (among search engine users)
89% are aware of at least one way in which            91% are aware of at least one way in which
companies can collect personal data online            companies can collect personal data online
(among internet users)                                (among internet users)
2% do not use the internet
55-64s:                                               65-74s:

95% use a mobile phone                                88% use a mobile phone
6% only use a smartphone                              3% only use a smartphone
to go online                                          to go online
59% watch on-demand or streamed content               47% watch on-demand or streamed content
58% have a social media profile                       39% have a social media profile
50% correctly identify advertising on Google          48% correctly identify advertising on Google
(among search engine users)                           (among search engine users)
88% are aware of at least one way in which            82% are aware of at least one way in which
companies can collect personal data online            companies can collect personal data online
(among internet users)                                (among internet users)
17% do not use the internet                           30% do not use the internet

75+:

75% use a mobile phone
3% only use a smartphone
to go online
23% watch on-demand or streamed content
21% have a social media profile
40% correctly identify advertising on Google
(among search engine users)
63% are aware of at least one way in which
companies can collect personal data online
(among internet users)
51% do not use the internet

                                   More likely than the UK average

                                    Less likely than the UK average

                                                    4
Media use, by socio-economic group: a snapshot
AB: C1:
97% use a mobile phone 96% use a mobile phone
2% only use a smartphone to 8% only use a smartphone to
go online go online
80% watch on-demand or streamed content 71% watch on-demand or streamed content
79% have a social media profile 78% have a social media profile
54% correctly identify advertising on Google 51% correctly identify advertising on Google
(among search engine users) (among search engine users)
94% are aware of at least one way in which 89% are aware of at least one way in which
companies can collect personal data online companies can collect personal data online
(among internet users) (among internet users)
4% do not use the internet 7% do not use the internet
C2: DE:
96% use a mobile phone 89% use a mobile phone
15% only use a smartphone to 19% only use a smartphone to
go online go online
60% watch on-demand or streamed content 45% watch on-demand or streamed content
70% have a social media profile 59% have a social media profile
48% correctly identify advertising on Google 41% correctly identify advertising on Google
(among search engine users) (among search engine users)
86% are aware of at least one way in which 78% are aware of at least one way in which
companies can collect personal data online companies can collect personal data online
(among internet users) (among internet users)
14% do not use the internet 27% do not use the internet
More likely than the UK average
Less likely than the UK average
5Media use, by nation: a snapshot
England: Northern Ireland:
95% use a mobile phone 98% use a mobile phone
10% only use a smartphone to go online 29% only use a smartphone to go online
64% watch on-demand or streamed content 60% watch on-demand or streamed content
72% have a social media profile 66% have a social media profile
49% correctly identify advertising on Google 32% correctly identify advertising on Google
(among search engine users) (among search engine users)
88% are aware of at least one way in which 73% are aware of at least one way in which
companies can collect personal data online companies can collect personal data online
(among internet users) (among internet users)
12% do not use the internet 11% do not use the internet
Scotland: Wales:
90% use a mobile phone 95% use a mobile phone
14% only use a smartphone to go online 11% only use a smartphone to go online
71% watch on-demand or streamed content 66% watch on-demand or streamed content
69% have a social media profile 70% have a social media profile
58% correctly identify advertising on Google 51% correctly identify advertising on Google
(among search engine users) (among search engine users)
82% are aware of at least one way in which 91% are aware of at least one way in which
companies can collect personal data online companies can collect personal data online
(among internet users) (among internet users)
17% do not use the internet 13% do not use the internet
More likely than the UK average
Less likely than the UK average
6Summary of
key findings
The move to smaller, smarter devices
People increasingly prefer smaller, portable devices for going online.
Adult internet users estimate they spend an average of 25.1 hours online per week, unchanged since
2018 and 2017. What is changing, though, is the way in which people access the internet. Nearly all
UK internet users now use at least one device other than a computer 2 to go online (93%), and a
1F
growing proportion of adults only use devices other than a computer to go online (34% of all adults,
up from 29% in 2018). This is the continuation of a long-term trend; use of only non-computer
devices was just 6% in 2014. Eleven per cent of adults only use a smartphone to go online, up from
3% in 2014.
Younger adults and those in C2 and DE households are more likely than average to only use devices
other than a computer to go online (43% of 16-24s, 48% of 25-34s, 41% of C2s, and 43% of DEs).
Those aged 25-34 (20%), C2s (15%) and DEs (19%) are also more likely to access the internet only via
a smartphone. Among adults of working age (16-64) in DE households, this difference is even more
pronounced: 52% only use devices other than a computer to go online, compared to 33% of
working-age adults in ABC1/C2 households, and 24% are smartphone-only, compared to 10% of
working age ABC1/C2s.
2
Any type of computer, whether a desktop PC, laptop or netbook.
7Adults are increasingly adopting connected devices and smart technologies.
Nearly all adults use a mobile phone (95%), and for the vast majority, this is a smartphone (81% of all
adults). Both these measures are unchanged since 2018. A majority of adults also have access to a
smart TV at home, and this has risen to 58% from 53% in 2018. 3 This has led to the level of use of
2F
smart TVs (56%) aligning with that of standard TV sets (54%) for the first time.
The smart device market has expanded in recent years and use of these new devices is growing. For
instance, there has been an increase in access to smart speakers (25%, up from 17% in 2018). 4 This 3F
year, for the first time, we measured access to smart home technology 5 (10%) and streaming
4F
devices 6 (25%).
5F
Take-up varies across the population. Adults in DE households are less likely, and those in AB
households more likely than average to have access to any of the smart devices mentioned.
The qualitative Adult Media Lives study also saw an increase in the reported level of ownership of
connected devices (such as Google Home and Amazon Echo), and use of various forms of voice
activation technology (Siri, Alexa, etc.). This is a marked change compared to previous waves. Just
under half of the sample now claim to own a smart speaker but are currently often using them in
3
This just measures access to the device, while the Technology Tracker 2020 suggests 90% of adults with a
smart TV connect it to the internet.
4
This is statistically in line with data from the Technology Tracker 2020. For more information on smart device
take-up, see Online Nation 2020.
5
Technology used to control or monitor your home remotely, such as heating, lighting or seeing who is at the
door, using a smartphone or another electronic device.
6
A device plugged in to a TV set or computer (like Apple TV, Amazon Fire TV stick, Chromecast, Roku).
8‘experimentation’ mode rather than as a direct replacement for the other devices like the radio, for
example. 7 6F
“Because we don’t have a TV we were both sat here doing a bit of work and we were getting
the rugby scores through from Alexa every ten to fifteen minutes. We’ve just been playing
about with her at the moment, so you can say ‘Alexa tell me a joke’ and she’ll tell you a joke.”
Female, 31, doctor, London
In 2019, as in 2018, half of adults (49%) say their mobile phone is the device they would miss the
most if it were taken away. Adults aged 16-54 are more likely than average to give this response.
From the age of 55, adults are more likely to say they would most miss their TV set (52% compared
with 29% of all adults).
Digital exclusion
The proportion of adults offline is unchanged since 2014 and many have no interest in
going online.
Over the past five years there has been no change in the incidence of adults who do not use the
internet (13% offline in 2019 vs. 14% in 2014). Non-users tend to be older and in lower socio-
economic groups: 40% of non-users are aged 75+; 53% of non-users are in DE households. When
considering only those of working age (16-64), we still see a split by socio-economic group, with
7
This echoes the findings in our Children and Parents: Media Use & Attitudes report 2019.
9those in DE households much more likely to be offline (13% of working age DEs vs. 3% of working
age ABC1/C2s).
Many non-users demonstrate a lack of appetite for going online in the near future: 77% say that
nothing would encourage them to go online in the next 12 months, and 61% say they don’t currently
go online due to a lack of interest or need. One in five state a reason either related to cost (19%) or
difficulty (‘being too complicated’) (17%) as a barrier to their going online.
There are further divisions among those who are online, due to devices, activities or
capabilities.
There is also the potential for a digital divide among those who are online, where dependence on
small screens can create problems. Thirty-four per cent of adults only use devices other than a
computer to go online, and 11% of adults only use a smartphone to go online. However, 65% of
smartphone users agree that it is more difficult to complete forms, and work on documents, on their
smartphone than on a computer (although this is down from 73% in 2018). Meanwhile, a rising
proportion are reporting using their smartphone for these activities: 72% of smartphone users have
used their smartphone to complete a form or application, up from 67% in 2018.
As well as limiting online activities, device use can affect critical engagement. For instance, those
who are smartphone-only are less likely than other internet users to recognise sponsored links at the
top of search engine results (44% vs. 61%). This lack of understanding, combined with the smaller
screen size reducing the number of results shown without scrolling, could lead to people being more
susceptible to the paid-for results.
There can also be variations in the levels of activities undertaken and the capabilities of those online.
For instance, internet users aged 65+ (53%) and in DE households (46%) are less likely to bank online
(73% overall) or to complete most public or civic processes online.
10An increasingly on-demand world
Adults are increasingly accessing content on demand.
The growth in use of smart TVs and streaming devices corresponds with a drop in the use of digital
video recorders (DVRs) (42%, down from 47% in 2018). It also corresponds with growth in the use of
video-on-demand (VoD) services (64% of all adults, up from 60% in 2018 and 55% in 2017). This is a
particularly common method of accessing content for younger adults (76% of 16-24s, 77% of 25-34s
and 78% of 35-44s) and those in ABC1 households (80% of AB and 71% of C1 households).
These trends are reflected in the Adults’ Media Lives study, with the majority of the sample (16/19)
now having access to at least one paid-for streaming video-on-demand service. Netflix is by far the
most common service; Amazon Prime Video and Now TV were subscribed to by a small minority at
the time of fieldwork. There was an increased incidence of all these services compared to previous
years and this reflects part of a long-term trend of increasing fragmentation and personalisation of
participants’ viewing behaviour. Participants also reported more viewing on mobile devices than in
previous years. This included viewing both in and out of the home, and a mix of streaming content
and downloads.
“When I’m getting ready, I’ve got a dressing room and there’s no telly in there, so I just use my
phone as a TV.” Female, 27, trainee solicitor, Edinburgh
“On the weekend [daughter] had a friend sleep over. We’ve got the Amazon Prime Video app
on the iPad, so I purchased a film for them, and they watched Aladdin together when they
were upstairs, on the iPad.” Female, 42, fundraising manager, Cardiff
“We were coming back on Sunday night from being away and we had downloaded something
on iPlayer, so we watched it on the laptop on the way home. Just this week, for the very first
time, I started watching stuff on my phone on my commute.” Male, 36, financial services
executive, London
“I’ve watched things on my phone so when I’m going to London or Edinburgh, I’ll either
download a couple of episodes or, if there’s wi-fi available I’ll sign into the wi-fi and I’ll watch
something on my phone.” Female, 42, fundraising manager, Cardiff
Three-quarters of internet users watch content on video-sharing sites like YouTube, Vimeo, Snapchat
and Facebook (74%) though this is slightly down from 2018 (78%). As with VoD, younger adults are
more likely to watch content on video-sharing sites (90% of 16-24s, 88% of 25-34s and 80% of 35-
44s) but there are no differences by socio-economic group.
In 2019, we saw increased dissatisfaction with TV content.
When asked whether they had any concerns about what is on TV, 42% of adults expressed at least
one concern, up from 35% in 2018. This overall increase is attributable to a rise in stated concerns
about the quality of content or number of repeats (26% concerned, up from 18%) and the
amount/length of advertising (9%, up from 6%). Twenty-one per cent are concerned about harmful
or offensive content.
11This is reflected in the Adults’ Media Lives study, where some participants said that programmes
such as soaps and mainstream programmes were less important to them than before, and they were
critical of what they perceived as a lack of innovation in these genres.
“I’m not even into the soaps as much now. Every time I put the soaps on it’s something
depressing – someone’s dying. They all copy each other; they all have the same storyline.”
Female, 58, unemployed, London
“We used to really look forward to watching I’m a Celebrity, The X Factor and Britain’s Got
Talent but I suppose they’ve become boring now.” Female, 53, housing officer, Coventry
“When something becomes successful everyone copies it and, before you know it, all of
television is like The Only Way is Essex.” Female, 58, unemployed, London
Social media
Social media users are increasingly using multiple sites and apps, and WhatsApp,
Instagram and YouTube are all growing in popularity.
A large majority of internet users have a social media profile (82%, which equates to 72% of all UK
adults). Although Facebook remains the most popular site, social media users are diversifying. In
2014, 97% of social media users had a Facebook profile and 48% used Facebook as their only social
media site/app. Five years later, 88% of social media users have a Facebook profile, but just 16% are
Facebook-only. The proportion with a Facebook profile is consistent across ages among social media
users, but 55-64s (23%) and over-65s (39%) are more likely than average to be Facebook-only.
This year, there has been continued growth in the incidence of social media users with profiles or
accounts on WhatsApp (70%, up from 61% in 2018 and 24% in 2014), Instagram (43%, up from 38%
in 2018 and 16% in 2014), and YouTube (42%, up from 35% in 2018 and 17% in 2014). It is worth
noting that despite the growing take-up of multiple social media accounts and the move away from
‘Facebook-only’, the increasingly popular WhatsApp and Instagram are both Facebook-owned.
Only 2% of adult social media users have an account on TikTok, suggesting this was not yet a big
player in the adults’ market at the time of the fieldwork. However, as with most social media
sites/apps, 16-24s are more likely to have a TikTok account (8% of social media users aged 16-24). 8 7F
A majority of social media and messaging site users still consider Facebook to be their main site/app
(56%) and a quarter consider WhatsApp to be their main site/app (24%). No other platform is
considered as the main site/app of more than 10% of social media users. Older social media users
(aged 65+) are more likely than average to consider Facebook their main site (70%), while those
aged 16-24 are less likely than average to do so (45%) and are more likely than average to select
Instagram (15%) or Snapchat (15%).
8
More recently, it’s possible that Covid-19 restrictions may have had an effect on take-up of some sites and
apps like TikTok. See Online Nation 2020 for more recent usage figures of video-sharing-sites.
12A quarter of social media users say they often share, post or comment on social media sites or apps
(25%). A similar proportion are more passive in their use, saying they tend to only read things on
these sites or apps and rarely ‘like’ or post anything (23%).
In our Adults’ Media Lives study, some participants claimed to use Facebook less than before,
although many are increasingly active on Facebook-owned platforms such as Messenger, Instagram
and WhatsApp. This claimed reduction in use tended to be among younger participants.
“I would have been on Facebook all the time whereas now, I’ve gone off it, I won’t really be
checking it as much.” Female, 19, student, Belfast
“My profile still exists but I haven’t logged on, probably for nearly three months now.” Male,
23, tutor, London
Internet users are less sure than in 2018 on the right to anonymity online.
Compared to 2018, internet users are less likely to agree with the statement ‘I think people should
have the right to hide their identity online in order to express their views anonymously’ (34%, down
from 41% in 2018). This is attributable to an increase in the proportion who answer ‘neither agree
nor disagree’ or ‘don’t know’ (25%, up from 20% in 2018). An unchanged 42% disagree with the
statement. Younger adults aged 16-24 (44%) are more likely than average to agree that people
should be able to hide their identity online to express their views anonymously, and males (37%) are
more likely to agree than females (30%).
Internet users are also less likely than in 2018 to agree with the statement ‘I think it is important that
people can say what they want online even if it is controversial or hurtful to others’ (28%, down
from 36% in 2018) and half of internet users now disagree (50%, up from 43% in 2018). Those aged
16-24 (34%) are more likely than average to agree with this statement and those aged 65+ (60%) are
more likely to disagree. Males are more likely to agree than females (35% vs. 21%).
Online exploration and fact-checking
The online behaviour of some internet users may limit their exposure to a plurality of
views.
Understanding the extent to which people are willing to explore online is important context for
many of their attitudes and behaviours. A quarter of social media users say they rarely see views on
social media that they disagree with (27%). This is unchanged since 2018 (24%) but is a significant
increase since 2017 (18%) and is consistent across age and socio-economic group. Among those
whose only social media profile is on Facebook, a third say they rarely see views they disagree with
(33%).
Only a quarter of internet users reported using lots of new websites in the past month (24%) with a
higher proportion saying they had only used websites or apps they’ve used before (35%). These
percentages have remained broadly consistent over time despite the growing size of the online
world and the number of websites and apps: in 2014, 25% reported using lots of new websites while
1331% said they only used websites or apps used before. This may be a result of people’s increasing
use of the major platforms for a lot of their online activity. 9 8F
Younger adults and those in AB households tend to be more exploratory online: 34% of internet
users aged 16-24 and 30% of internet users in AB households say they have used lots of websites or
apps they’ve not used before. This drops to 10% of those aged 65+, and 16% in DE households, with
half of each group saying they only use websites or apps they’ve used before (51% of over-65s and
47% of DEs).
In the context of rising online news consumption, 10 internet users are less likely to
9F
validate online information sources. 11 10F
Our survey shows that 10% of internet users do not consider the truthfulness of factual information
they find online. A further 2% think all information online is truthful, 25% think most is, and 59%
show a greater degree of critical understanding, thinking that only some of it is truthful.
On top of that, internet users are less likely than in 2018 to make checks on the factual information
they find online. 12 Twenty-nine per cent don’t make any checks on the information they find, up
1F
from 23% in 2018. This reverses the trend seen in the previous year; a decrease from 27% in 2017 to
23% in 2018.
Similarly, social media users are less likely to check the information in articles they see on social
media to establish its truth: 26% wouldn't tend to check vs. 18% in 2018. 13 Again, this is a reversal of
12F
the previous year’s trend, returning to the 2017 level (23%).
9
More recently, it’s possible that Covid-19 restrictions may have had an effect on people’s online exploration,
with big increases in the take-up of sites like Zoom or Houseparty. See Online Nation 2020 for more
information on the variety of services people use.
10
Observed in our separate News Consumption research.
11
The findings in this section are particularly noteworthy given the current focus on the proliferation of fake
news around coronavirus. You can find more information about encountering misinformation in our Covid-19
tracker.
12
Checks include if the same information appears on different websites, the website address looks genuine,
the site looks professional, the credibility of the information (author’s name or link to original publication),
whether people they trust use the site, whether the site is regularly updated.
13
Checks include if it was by an organisation they’re familiar with, if it was by an organisation they thought
trustworthy, if the same information appears elsewhere, how professional the article looks (e.g. are there
spelling mistakes, do the images or videos look high quality), what other people have said about the article,
thinking about what the article is about to assess the likelihood it is true, whether the person who shared it
was someone they trusted, if it was a first-hand account.
14Most search engine users demonstrate a level of critical understanding in interpreting search results,
believing that some of the listed websites will be accurate or unbiased and some won’t (58%). But
many search engine users lack this consideration or understanding; 20% think that if websites have
been listed by the search engine, they must contain accurate and unbiased information, while 18%
don’t really think about whether or not they are accurate or unbiased, and just use the sites they like
the look of.
In the Adults’ Media Lives study, we found that although participants claimed to access an
increasingly eclectic range of news sources from across the world, via a mix of social media, apps,
websites, podcasts, TV and radio, their judgement of the trustworthiness of a news source or story
tended to be heavily influenced by the degree to which it reflected their own attitudes. Even those
who claimed to access a range of views often sought those views from like-minded sources.
When deciding whether or not to trust online content, participants cited a number of factors
including awareness, knowledge or (ideally) previous experience of the site or source. The latter was
perhaps the most important factor in determining the level of trust accorded to it.
“I guess you do trust the apps and the sites that you’ve used before more so than if you are –
for example – booking a holiday with a company you’ve never used before… Our local council
website I hope that I could trust that.” Female, 42, fundraising manager, Cardiff
“Somebody that I went to university with shared something about hormone replacement or
contraception for girls and it was this massive thing, but I wondered where her sources were…
She’s not an idiot and she was sharing it on her story saying it was important but not
15questioning it. She shares it, the next person shares it and the next minute people think it’s
Bible.” Female, 27, trainee solicitor, Edinburgh
Other factors included making a judgement based on visual cues from the website or video itself
(production values, size of audience for a live event, etc.), the number and nature of comments
made on an article or video, the number of similar search results, and the number and quality of
ratings and reviews (where relevant).
“I think it’s evident that the [TLDR News YouTube channel] is pretty non-partisan, I think it’s
also interesting that the comments on the videos often say ‘Thank you for presenting this in
such an unbiased, matter of fact way’. In some cases there is validation in the comments on
these videos.” Male, 23, tutor, London
Increasing consciousness of personal data issues
People are increasingly aware of personal data issues, but there is still a gap between
their stated confidence in managing personal data and their actual understanding.
A majority of internet users feel confident about managing access to their personal data online: 38%
say they are very confident and 35% fairly confident. 14 16-44s are more likely than average to say
13F
they are very confident, and those aged 45+ are less likely. The small proportion who say they are
not at all confident has risen since 2018: it is now 6%, up from 4% in 2018. This response is more
likely among those aged 75+ (13%) or in DE households (9%).
There is some evidence that critical understanding of personal data collection is improving. Our
survey prompts internet users with four ways in which online companies can collect their personal
information and asks which they are aware of. 15 Awareness of at least one of these ways has risen to
14F
88%, up from 81% in 2018. However, a large proportion are not fully equipped to manage their
personal data online; only 39% of internet users are aware of all four ways. This is unchanged since
2018 (37%).
14
Participants are prompted with the following explanation: “By this I mean knowing how to stop companies
from getting access to information like your personal details (like your address, phone number, date of birth
etc.) or information on things like where you shop or your interests”.
15
The four ways are: (i) using ‘cookies’ to collect information about the websites people visit or what products
interest them; (ii) collecting information from social media accounts i.e. about users interests, ‘likes’, location,
preferences; (iii) asking customers to register with a website and opt in/out to receiving further information
from them of their partners and; (iv) using apps on smartphones to collect data on users’ locations of what
products and services interest them.
16In fact, 44% of those who say they are confident in managing their personal data are unaware that
information about them can be collected through their smartphone apps. Moreover, although
cookies were the most recognised method of personal data collection in our research, 20% of those
who said they were confident were unaware of the use of cookies. So although a majority of people
report confidence, many are not aware of how their data is being collected.
Additionally, a majority of internet users say they usually accept terms and conditions without
reading them, although this is less likely than in 2018 (65% vs. 69%).
Similarly, most participants in the Adults’ Media Lives study continue to accept cookies, terms and
conditions and privacy policies without question. Sometimes they justify this by arguing that they
have no choice but to accept them, or they assume that such terms and conditions are standardised
across sites (so there is no need to read them each time) or they believe that as individuals, they are
not important enough for the companies in question to care about.
[Do you ever read the terms and conditions?] “No. Does anyone? You should do really
shouldn’t you.” [Why don’t you?] “I thought it was all the same.” Male, 30, plasterer, Swansea
“I just don’t think I do anything so interesting that Amazon would want to listen in to it. I’m
sure if I was famous I would take exception to it but I don’t think I’m who Amazon wants to
listen in to.” Female, 31, doctor, London
“They always say ‘Do you want to accept the cookies?’ or whatever and you accept it.
Sometimes you don’t want to accept it but you need to accept it just to see the screen. So in a
sense you’ve got no choice.” Male, 33, station assistant, Birkenhead
17A growing proportion of internet users say they are not happy for online companies to collect and
use their personal information under any circumstances: 45%, up from 39% in 2018. The most
common reason that internet users give for being happy with data collection is if they receive
appropriate reassurance about the protection and use of their data: 29% are happy for companies to
collect and use personal information if they can choose to opt out at any point and the company will
stop using their data; 27% are happy if they are clear about how companies will use their
information; and 25% are happy if they are reassured that companies will not share their
information with other companies.
Internet users are also more likely than in 2018 to make ‘appropriate’ checks before registering
personal details online: 74% claim to do this, up from 67% in 2018. 16 Similarly, 79% of internet users
15F
claim to make ‘appropriate’ checks before entering financial information online, up from 74% in
2018. But in both cases, one in five still make ‘less appropriate’ or no checks. 17 16F
Critical understanding of online advertising and website funding
There is a still a gap between confidence level and understanding of online advertising.
An element of critical thinking is the ability to recognise what is a commercial and what is an
editorial message online. A large majority of internet users feel confident that they can recognise
online advertising (46% very confident, 39% fairly confident). Many internet users take exception to
online advertising and even actively avoid it: 42% of internet users say they dislike all online
advertising, up from 36% in 2018, and 72% claim to take some action to avoid online adverts, such as
unticking a box to prevent companies sending them information on offers, using ad-blocking
software, or registering using false information.
However, when asked if they recognised advertising, only half of search engine users correctly
identified sponsored links on Google search results and understood that this is the only reason these
results are displayed at the top of the list (49%). 18 This is unchanged since 2015.
17F
When asked about the type of adverts they see online, 20% of internet users are unaware of
personalised advertising, believing that everyone sees exactly the same adverts as they do. A further
19% answer ‘don’t know’ in response to this question.
16
‘Appropriate’ checks include; checking if the site looks secure (padlock symbol or https), if familiar with the
company or brand, if there is a link to another reputable service like PayPal, if there is a guarantee personal
details won’t be shared with anyone else and if the site is recommended by friends and family.
17
‘Less appropriate’ checks include checking if the site is listed by a search engine. Not making any checks
includes; entering personal details if it’s the only way to get a product or service wanted or entering details
whenever required.
18
Search engine users can select more than one response to this question. 49% is the proportion of those who
give only the correct response and do not select any other options.
18Awareness of websites’ funding is much lower than awareness of TV channels’ funding,
and is unchanged since 2017.
Another element of media literacy is understanding how different media and online services are
funded, enabling a better understanding of the motivations of the companies or organisations
providing the content on such services.
Awareness of the licence fee as the main source of funding for BBC TV programmes is high and has
increased since 2018 (83%, up from 80%). However, awareness of the licence fee as the main source
of funding for the BBC website (63%) and BBC iPlayer (53%) is lower and is unchanged since 2018.
There is a similar awareness gap between commercial TV and commercial online offerings, where
advertising is the main source of funding. Seventy-three per cent of adults are aware that advertising
is the main source of funding for commercial TV programmes, up from 69% in 2018. But this drops to
53% for search engines and 43% for YouTube, both unchanged since 2018.
19You can also read