Battery Characterization via Eddy-Current Imaging with Nitrogen-Vacancy Centers in Diamond - MDPI
←
→
Page content transcription
If your browser does not render page correctly, please read the page content below
applied
              sciences
Article
Battery Characterization via Eddy-Current Imaging with
Nitrogen-Vacancy Centers in Diamond
Xue Zhang 1,2 , Georgios Chatzidrosos 1,2 , Yinan Hu 1,2 , Huijie Zheng 1,2, * , Arne Wickenbrock 1,2, * ,
Alexej Jerschow 3 and Dmitry Budker 1,2,4

                                          1   Department of Physics, Johannes Gutenberg-Universität Mainz, 55128 Mainz, Germany;
                                              xuezhang@uni-mainz.de (X.Z.); gechatzi@uni-mainz.de (G.C.); yinanhu1@uni-mainz.de (Y.H.);
                                              budker@uni-mainz.de (D.B.)
                                          2   Helmholtz-Institut, GSI Helmholtzzentrum für Schwerionenforschung, 55128 Mainz, Germany
                                          3   Department of Chemistry, New York University, New York, NY 10003, USA; alexej.jerschow@nyu.edu
                                          4   Department of Physics, University of California, Berkeley, CA 94720, USA
                                          *   Correspondence: zheng@uni-mainz.de (H.Z.); wickenbr@uni-mainz.de (A.W.)

                                          Abstract: Sensitive and accurate diagnostic technologies with magnetic sensors are of great im-
                                          portance for identifying and localizing defects of rechargeable solid batteries using noninvasive
                                          detection. We demonstrate a microwave-free alternating current (AC) magnetometry method with
                                          negatively charged NV centers in diamond based on a cross-relaxation feature between nitrogen-
                                          vacancy (NV) centers and individual substitutional nitrogen (P1) centers occurring at 51.2 mT. We
                                          apply the technique to non-destructively image solid-state batteries. By detecting the eddy-current-

                                   induced magnetic field of the battery, we distinguish a defect on the external electrode and identify
                                          structural anomalies within the battery body. The achieved spatial resolution is 360 µm. The maxi-
Citation: Zhang, X.; Chatzidrosos,
                                          mum magnetic field and phase shift generated by the battery at the modulation frequency of 5 kHz
G.; Hu, Y.; Zheng, H.; Wickenbrock,
                                          are estimated as 0.04 mT and 0.03 rad respectively.
A.; Jerschow, A.; Budker, D. Battery
Characterization via Eddy-Current
Imaging with Nitrogen-Vacancy
                                          Keywords: battery diagnostics; NV-centers in diamond; eddy current imaging; nondestructive evaluation
Centers in Diamond. Appl. Sci. 2021,
11, 3069. https://doi.org/10.3390/
app11073069
                                          1. Introduction
Academic Editor:                                Sensitive and accurate diagnostic technologies with magnetic sensors are of great
Alexander Chroneos                        importance for identifying and localizing defects of rechargeable solid batteries using
                                          noninvasive detection. Negatively charged nitrogen-vacancy (NV) centers have been
Received: 3 March 2021
                                          extensively exploited as precise nanoscale probes in applications such as measurement of
Accepted: 26 March 2021
                                          magnetic fields [1], temperature [2], strain [3], rotation [4,5], electric fields [6,7] and so
Published: 30 March 2021
                                          forth. Recently, NV centers have also been utilized for eddy-current imaging. Eddy-current
                                          detection was demonstrated with vapor-cell magnetometers [8–10], and later also with NV
Publisher’s Note: MDPI stays neutral
                                          diamond [11]. Compared with other sensors, diamond-based devices can be used over a
with regard to jurisdictional claims in
                                          wide temperature range, can have nanoscale spatial resolution, high sensitivity and wide
published maps and institutional affil-
                                          bandwidth. In [11], a microwave-free eddy-current imaging device based on NV centers
iations.
                                          in diamond was demonstrated making use of a NV–NV cross-relaxation feature between 0
                                          and 20 mT. In this paper, we report imaging based on a much narrower cross-relaxation
                                          feature between the NV centers and substitutional nitrogen (P1) centers and apply it to
                                          perform non-destructive evaluation experiments on small solid-state batteries.
Copyright: © 2021 by the authors.
                                                The imaged sample is an all-ceramic multilayer solid-state battery produced by TDK
Licensee MDPI, Basel, Switzerland.
                                          Corporation. It incorporates inner electrodes, electrolyte and external electrodes. When the
This article is an open access article
                                          battery is placed in an oscillating magnetic field (primary field), eddy currents flow in the
distributed under the terms and
                                          electrodes and the electrolyte, which, in turn, in our case induce an alternating magnetic
conditions of the Creative Commons
                                          field (secondary field).
Attribution (CC BY) license (https://
creativecommons.org/licenses/by/
                                                We demonstrate all-optical AC magnetometry to detect the secondary field as a
4.0/).
                                          function of position. The secondary field is anti-parallel to the primary field and exhibits a

Appl. Sci. 2021, 11, 3069. https://doi.org/10.3390/app11073069                                            https://www.mdpi.com/journal/applsci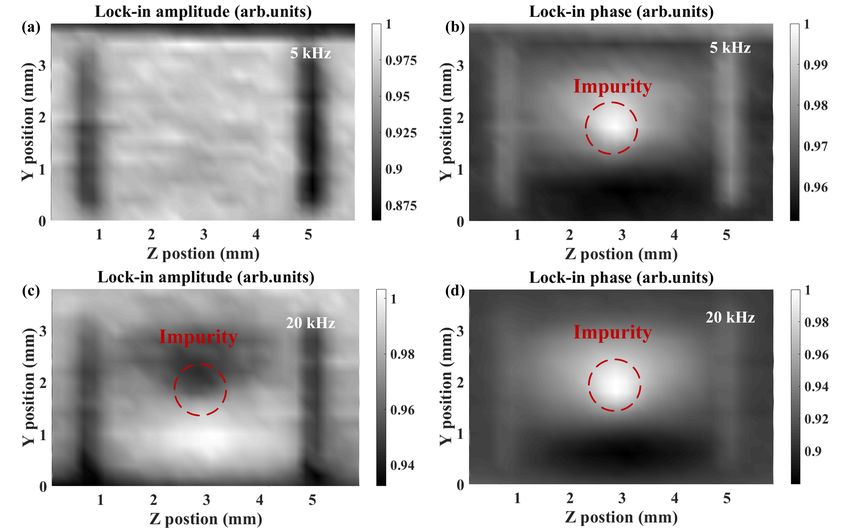
Appl. Sci. 2021, 11, 3069                                                                                                   2 of 9

                            phase delay. These quantities relate to a number of characteristics in the imaged sample,
                            such as shape, dimensions, conductivity and susceptibility. As a result, one can use NV
                            centers as probes to distinguish textures and identify structural anomalies inside and
                            outside the battery.

                            2. Experimental Apparatus
                                 A schematic of the experimental setup is shown in Figure 1. Linearly polarized light
                            from a continuous-wave green laser at 532 nm is continuously pumping the NV centers
                            in a diamond sample. The laser power can be adjusted with a polarizer and a half-wave-
                            plate. NV centers in the excited state decay back to the ground state both via radiative
                            and nonradiative transitions, with red photoluminescence (PL) emitted in the former
                            case. The fact that NV centers in the ms = ±1 magnetic sublevels have significantly
                            higher probability to undergo an intersystem crossing (ISC) [12], i.e., a nonradiative
                            transition from the triplet to the singlet excited state, results in the majority of NV centers
                            being optically pumped into the ms = 0 spin projection. In order to minimize the noise
                            caused by intensity fluctuations in the laser beam, we use a light-power stabilization loop
                            incorporating a photodiode (PD2), a proportional-integral-differential (PID) controller,
                            and an acousto-optic modulator (AOM).

                            Figure 1. Experimental setup. 1–4: mirrors; 5: dichroic mirror; 6: lens; 7: parabolic concentrator; 8:
                            RF coil; 9: diamond; 10: battery; 11: notch filter. PBS: polarizing beamsplitter; AOM: acousto-optic
                            modulator; PD1,2: photodiodes; PC: personal computer; PS: power supply.

                                 A dichroic mirror and a notch filter are used to filter out red PL from the green light.
                            The diamond used in this setup is a type-Ib, (111)-cut, high-pressure-high-temperature-
                            grown sample with dimensions 3.0 × 3.0 × 0.4 mm3 . The initial nitrogen concentration
                            was specified as less than 110 ppm. Then nitrogen-rich sample was electron-irradiated and
                            annealed [11]. The diamond is glued on the top plane of a parabolic concentrator used
                            to collect fluorescence. A radio-frequency (RF) coil is made from copper wire of 0.1 mm
                            diameter. It has five turns and is wound around the diamond to provide a modulation field
                            to both the diamond and battery. The modulation field is provided by the lock-in amplifier
                            (LIA) used for the AC magnetometric scheme. The frequency of the field (maximum
                            4 MHz) is also used as the LIA reference for detection.
                                 A 3D translation stage is used to fast-scan the battery in front of the diamond. The bat-
                            tery is glued on top of a 24 cm long polyvinyl chloride (PVC) rod attached to a motorized
                            three-dimension translation stage controlled by a computer. A variable background field is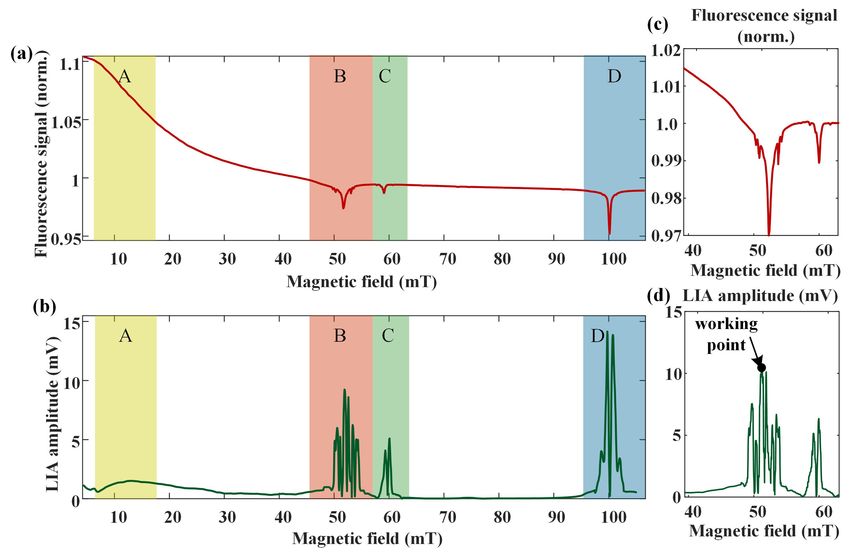
Appl. Sci. 2021, 11, 3069                                                                                                 3 of 9

                            provided by a custom-made electromagnet (EM). This field is required for the microwave-
                            free magnetic field detection method. The EM consists of approximately 200 turns wound
                            with a rectangular cross-section (1.4 × 0.8 mm2 ) wire around a 5 cm-diameter bore. The coil
                            is wound on a water-cooled copper mount, and produces a background field of 2.9 mT per
                            ampere supplied. Diamond, battery and RF coil are all placed inside the bore of the EM.
                            A LIA detects the amplitude (R) and phase (θ) of PL modulation. The LIA is connected
                            to the computer, and R and θ are recorded along with the position of the battery (the 3D
                            translation stage).

                            3. AC Magnetometry
                                 The PL of a diamond sample displays various cross relaxation features, extensively
                            discussed in the literature [13–15], as a function of the bias magnetic field, as shown in
                            Figure 2. In this paper, we exploit a cross-relaxation feature between NV and P1 centers
                            occurring at 51.2 mT (area B in Figure 2a). This feature is used in the battery measurement
                            because of its improved sensitivity compared to the broad NV–NV cross-relaxation feature
                            near the zero field (area A), and its reduced dependence on the magnetic field compared
                            to cross relaxation with NV centers not aligned along the magnetic field at 60 mT (area C)
                            and to the ground state level anticrossing (GSLAC) feature at 102.4 mT (area D). Figure 2b
                            shows the corresponding signal amplitude R detected with the LIA, demodulated at
                            the referenced frequency. To maximize the response to alternating signals, R has to be
                            maximized. The NV features seen in Figure 2 are expected to display a temperature
                            dependence. For example, the NV-P1 cross-relaxation features are expected to shift by
                            −1.34 µT/K at room temperature [16], which can lead to drifts and be interpreted as
                            magnetic field noise. As noted in the inset (d), we chose to use the features at 52.5 mT to
                            detect the AC magnetic signals. The noise sensitivity of the sensor
                                                                                              √ for the parameters used
                            in this experiment leads to an estimated sensitivity of 40 nT/ Hz with a bandwidth of
                            100 kHz. It should be pointed out that the bandwidth of this technique can be expanded up
                            to MHz, depending on pump-power intensity and NV-axis alignment with respect to the
                            external magnetic field [11].

                            Figure 2. (a) Photoluminescence (PL) of nitrogen-vacancy (NV) centers as a function of the back-
                            ground magnetic field. The four areas A, B, C and D that can be exploited for magnetometry indicate
                            features due to spin mixing, cross relaxation between NV centers and P1 centers, cross relaxation
                            with NV centers that are not aligned along the magnetic field, and ground state level anticrossing,
                            respectively. (b) Corresponding amplitude of lock-in amplifier (LIA) referenced at 100 Hz for those
                            features. (c) Zoomed-in B area of (a), PL recorded with field-modulation depth of 0.48 mT at 100 Hz.
                            (d) Zoomed-in B area of (b), indicating the working point at 52.5 mT.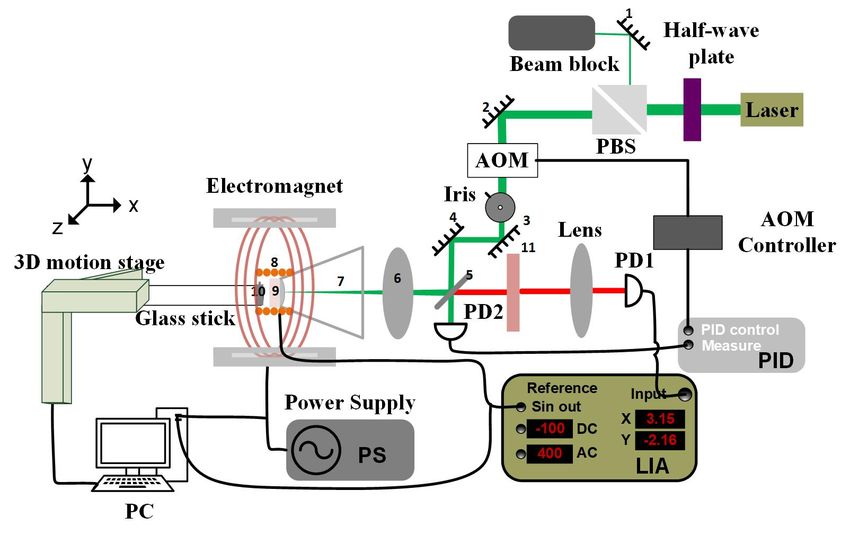
Appl. Sci. 2021, 11, 3069 4 of 9
4. Battery Measurement
The dimensions of the solid state battery measured in this work are 4.0 × 3.0 × 1.0 mm3 ,
and are shown in Figure 3a [17]. This comprises Li-based-ceramic-oxide inner electrodes
(noted as 2), a Li-based-ceramic-oxide electrolyte (denoted as 3), a copper charge collector
(indicated as 1), and external electrodes made of aluminum. Figure 3b shows a photograph
of the solid battery, which has an artificial 1 mm-length defect at the right external electrode.
The battery sample was placed at a distance of 0.1 mm to the diamond at the perpendicular
direction (x-direction), and scanned over the transverse plane (y-z plane). Figure 3g–j show
the spatially resolved phase signals of the LIA at the corresponding modulation frequencies
of 1 kHz, 5 kHz, 10 kHz and 40 kHz, respectively. The external electrodes including the
defect are distinctly visible under the modulation frequency of 1 kHz as shown in Figure 3g.
As the modulation frequency increases, the phase θ shows an image of the battery structure
between the electrodes. There the induced field from different portions of the battery can be
differentiated, as shown in Figure 3h–j. Figure 3c–f show the spatially resolved amplitude
signals of LIA at the corresponding modulation frequencies of 1 kHz, 5 kHz, 10 kHz and
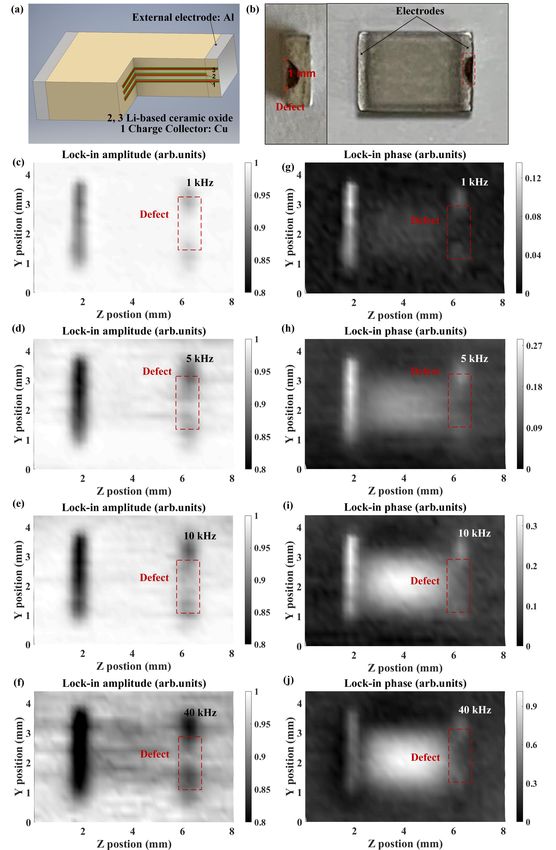
40 kHz. In order to investigate the ability of the diamond-based magnetometer to identify
structural anomalies inside batteries, we introduced two kinds of artificial anomalies. First,
an iron-containing brass cylinder with a height of 1 mm and diameter of 1 mm was placed
inside the battery, serving as an impurity. The results are shown in Figure 4a–d, displaying
the spatially resolved amplitude and phase signals of the LIA for the solid battery at
frequencies of 5 kHz and 20 kHz. This impurity is visible at both frequencies in the phase
signal, indicated with red dashed circles in Figure 4. The impurity image is absent in the
amplitude signal at frequencies lower than 5 kHz, this is because the amplitude variations
caused by the impurity, are smaller than the background shifts caused by temperature
changes, for the amplitude signal. The other anomaly is made by cutting the battery in
half and then attaching the halves back together, leaving no defect visible to the naked eye.
The results are shown in Figure 5, where (a)–(d) display spatially resolved amplitude and
phase signals of LIA for the solid battery at frequencies of 5 kHz and 20 kHz. The crevice
is distinctly visible in the middle of the battery in the phase signals at both frequencies,
indicated by the yellow ellipses in (b) and (d). In the amplitude signals the crevice is
absent again.
The primary field produced at the center of the coil where the battery is located is
given by:
µ0 × N × I
Bprimary = , (1)
2rcoil
where µ0 = 4π × 10−7 T × m/A is the permeability of free space, N = 4 is the number
of turns of the RF coil, I = 0.8 A is the amplitude of the alternating current through the
coil, and rcoil = 4.2 mm is the radius of the coil. To perform the LIA detection scheme the
modulated field amplitude was selected to be 0.48 mT, confirmed experimentally by the
GSLAC PL scan and theoretically by Equation (1).
For AC measurements, the magnetic susceptibility χm yields two quantities [18,19]:
the magnitude and phase of the susceptibility. Alternatively, we can express it in the form
of complex susceptibility with the real component χr and imaginary component χi ,
χm = χr + iχi (2)
where χr is the slope of the direct current (DC) magnetization curve M( H ) of the battery,
and χi indicates the dissipative processes in the battery. The secondary field produced by
the battery also depends on the skin depth in the conducting material:
s
2
δ= , (3)
σωµAppl. Sci. 2021, 11, 3069 5 of 9
Figure 3. (a) Battery schematic. The ceramic solid battery consists of external aluminum electrodes,
Li-based ceramic oxide inner electrodes (noted as 2), a Li-based ceramic oxide electrolyte (noted as
3), and a copper charge collector (indicated as 1). (b) A photograph of the battery with dimension
4 × 3 × 1 mm3 . Distinctly visible is the defect on the external electrode. (c–f) Maps of the R of LIA
for modulation frequencies of 1 kHz, 5 kHz, 10 kHz and 40 kHz. (g–j) Maps of the θ of LIA for
modulation frequencies of 1 kHz, 5 kHz, 10 kHz and 40 kHz, respectively.Appl. Sci. 2021, 11, 3069 6 of 9
Figure 4. Imaging pictures of solid batteries with the impurity. (a–d) are amplitudes and phases of
LIA for the battery with an impurity at frequencies of 5 kHz and 20 kHz.
Figure 5. Imaging pictures of solid batteries with the crevice. (a–d) are amplitudes and phases of LIA
for the battery with a crevice at frequencies of 5 kHz and 20 kHz.
where ω = 2π f denotes the angular frequency, σ is the conductivity of the material and
µ is the mutual permeability of the material. In order to estimate the AC magnetic field
generated by the battery, we adopted the calibration formula in refernce [8],
R0 cos (φ0 ) − Rm cos (φm )
δφ = arctan ( ),
Rm sin (φm ) (4)
q
δR = R2m sin (φm )2 + ( R0 cos(φ0 ) − Rm cos (φm ))2 ,
where δφ indicates the phase shifts generated by the battery, δR is the amplitude contrast
generated by the battery, R0 and φ0 are the background-corresponding amplitude and
phase of the LIA, respectively, and Rm and φm are the measured lock-in amplitude and
the phase, respectively. The calibrated results are shown in Figure 6. We calibrated theAppl. Sci. 2021, 11, 3069 7 of 9
magnetic field and phase shifts generated by the battery (the same as the one used in
Figure 3) at a modulation frequency of 5 kHz. The external electrode without the defect
induces the maximum magnetic field of 0.04 mT and phase shift of 0.03 rad.
Figure 6. Magnetic field and phase shifts generated by the battery at frequency of 5 kHz.
(a) Calibrated magnetic field generated by the battery. (b) Phase shifts generated by the battery.
5. Spatial Resolution
One of the advantages of diamond-based sensors is their spatial resolution. For deter-
mining the spatial resolution of this battery-measurement system, we used data from one of
the aluminum-made electrodes of the solid battery. As shown in Figure 7, the average cross
section of 0.3 mm-width electrode is expressed by a square function, noted as the green plot,
and a Gaussian-function, noted with red, was employed as a kernel to convolve the square
function to fit the measured data, denoted as blue dots. All traces have been normalized
for better comparison. By adjusting the full width at half-maximum of Gaussian function,
we can estimate the spatial resolution of the system. We represent those results with blue.
The spatial resolution of the system can be estimated form the full width at half maximum
(FWHM) of the kernel and is estimated as 360 ± 2 µm. It is mostly restrained by the distance
between the battery and diamond. Closer proximity could increase measurement contrast,
allowing a more legible image of small samples.
Figure 7. Determination of spatial resolution. The blues dots signify the average cross section of
the 0.3 mm-width electrode imaged by the sensor, the green trace denotes the width of electrode
of battery as a square function, and the red curve represents a Gaussian function, as a convolution
kernel of the green trace to fit the experimental data, noted as a blue trace.
6. Conclusions and Outlook
We demonstrated microwave-free eddy-current imaging with NV centers in diamond
exploiting the cross-relaxation feature between
√ the NV centers and P1 centers occurring at
51.2 mT. The magnetic sensitivity is 40 nT/ Hz with 100 kHz bandwidth, but as previouslyAppl. Sci. 2021, 11, 3069 8 of 9
demonstrated [11], it can be extended to a few MHz. The diamond-based sensor is used to
noninvasively image a mm-sized solid battery. The spatially resolved amplitude and phase
lock-in signals were used to determine the dimension and shape of the battery features,
including a 1 mm-wide artificial defect and 0.3 mm-wide electrodes, from which the spatial
resolution was calibrated as 360(2) µm, which was limited by the distance between the
sensor and the battery. Furthermore, the diamond-based probe also identified an anomaly
and a crevice inside the battery, demonstrating its ability to detect internal anomalies that
are not visible to the naked eye. The maximum magnetic field and phase shift generated
by the battery at a modulation frequency of 5 kHz were estimated as 0.04 mT and 0.03 rad,
respectively.
This paper mainly focuses on testing solid batteries. For future studies, the spatial
resolution could be further improved by either using a thinner diamond sample or a dia-
mond with a shallow implanted NV layer to shorten the sensor–sample distance. By tuning
the bandwidth, it would be possible to identify structures at different depths inside the
battery including electrodes, electrolytes [20] and even material components, which could
be useful for battery assessment and development.
Author Contributions: X.Z., G.C. and A.W. conceived the initial idea for the experiment in consulta-
tion with D.B., X.Z., G.C. and A.W. designed the experiment with input from all authors. X.Z. and
G.C. wrote and implemented control and automation software. X.Z., G.C. and H.Z. constructed the
apparatus, performed the experiments, and analyzed the data, with assistance from A.W. and D.B. in
data acquisition. All authors discussed results and contributed to the writing of the manuscript. All
authors have read and agreed to the published version of the manuscript.
Funding: This work was funded in part by a grant from the U.S. National Science Foundation under
award CBET 1804723 and the the German Federal Ministry of Education and Research (BMBF) within
the Quantumtechnologien program (FKZ13N14439 and FKZ 13N15064), and by EU FET-OPEN
Flagship Project ASTERIQS (action 820394).
Conflicts of Interest: The authors declare no conflict of interest.
References
1. Wickenbrock, A.; Zheng, H.; Bougas, L.; Leefer, N.; Afach, S.; Jarmola, A.; Acosta, V.M.; Budker, D. Microwave-free magnetometry
with nitrogen-vacancy centers in diamond. Appl. Phys. Lett. 2016, 109, 053505. [CrossRef]
2. Kucsko, G.; Maurer, P.C.; Yao, N.Y.; Kubo, M.; Noh, H.J.; Lo, P.K.; Park, H.; Lukin, M.D. Nanometer scale thermometry in a living
cell. Nature 2013, 500, 54–58. [CrossRef] [PubMed]
3. Ovartchaiyapong, P.; Lee, K.W.; Myers, B.A.; Jayich, A.C.B.; Stacey, A.; Budker, D.; Hollenberg, L.C.L. Dynamic strain-mediated
coupling of a single diamond spin to a mechanical resonator. Nat. Commun. 2014, 5, 4429. [CrossRef] [PubMed]
4. Ajoy, A.; Cappellaro, P. Stable three-axis nuclear-spin gyroscope in diamond. Phys. Rev. A. 2012, 86, 062104. [CrossRef]
5. Ledbetter, M.; Jensen, K.; Fischer, R.; Jarmola, A.; Budker, D. Gyroscopes based on nitrogen-vacancy centers in diamond.
Phys. Rev. A 2012, 86, 052116. [CrossRef]
6. Dolde, F.; Fedder, H.; Doherty, M.W.; Nobauer, T.; Rempp, F.; Balasubramanian, G.; Wolf, T.; Reinhard, F.; Hollenberg, L.C.L.;
Jelezko, F.; et al. Electric-field sensing using single diamond spins. Nat. Phys. 2011, 7, 459–463. [CrossRef]
7. Block, M.; Kobrin, B.; Jarmola, A.; Hsieh, S.; Zu, C.; Figueroa, N.L.; Acosta, V.M.; Minguzzi, J.; Maze, J.R.; Budker, D.; et al.
Optically Enhanced Electric Field Sensing using Nitrogen-Vacancy Ensembles. arXiv 2020, arXiv:2004.02886.
8. Wickenbrock, A.; Jurgilas, S.; Dow, A.; Marmugi, L.; Renzoni, R. Magnetic induction tomography using an all-optical 87Rb
atomic magnetometer. Opt. Lett. 2014, 39, 6367–6370. [CrossRef] [PubMed]
9. Marmugi, L.; Hussain, S.; Renzoni, F. Electromagnetic induction imaging with a radio-frequency atomic magnetometer.
Appl. Phys. Lett. 2016, 108, 103503.
10. Wickenbrock, A.; Leefer, N.; Blanchard, J.W.; Budker, D. Microwave-free magnetometry with nitrogen-vacancy centers in
diamond. Appl. Phys. Lett. 2016, 108, 183507. [CrossRef]
11. Chatzidrosos, G.; Wickenbrock, A.; Bougas, L.; Zheng, H.; Tretiak, O.; Yang, Y.; Budker, D. Eddy-current imaging with
nitrogen-vacancy centers in diamond. Phys. Rev. Appl. 2019, 11, 014060. [CrossRef]
12. Acosta, V.M.; Bauch, E.; Jarmola, A.; Zipp, L.J.; Ledbetter, M.P.; Budker, D. Broadband magnetometry by infrared-absorption
detection of nitrogen-vacancy ensembles in diamond. Appl. Phys. Lett. 2010, 97, 174104. [CrossRef]
13. Zheng, H.; Chatzidrosos, G.; Wickenbrock, A.; Bougas, L.; Lazda, R.; Berzins, A.; Gahbauer, F.H.; Auzinsh, M.; Ferber, R.;
Budker, D. Level anti-crossing magnetometry with color centers in diamond. Proc. SPIE 2017, 10119, 101190X.Appl. Sci. 2021, 11, 3069 9 of 9
14. Hall, L.T.; Kehayias, P.; Simpson, D.A.; Jarmola, A.; Stacey, A.; Budker, D.; Hollenberg, L.C.L. Detection of nanoscale electron spin
resonance spectra demonstrated using nitrogen-vacancy centre probes in diamond. Nat. Commun. 2016, 7, 10211. [CrossRef]
[PubMed]
15. Anishchik, S.V.; Ivanov, K.L. Sensitive detection of level anticrossing spectra of nitrogen vacancy centers in diamond. Phys. Rev.
B 2017, 96, 115142. [CrossRef]
16. Acosta, V.M.; Bauch, E.; Ledbetter, M.P.; Waxman, A.; Bouchard, L.S.; Budker, D. Temperature Dependence of the Nitrogen-
Vacancy Magnetic Resonance in Diamond. Phys. Rev. Lett. 2010, 104, 070801. [CrossRef] [PubMed]
17. Hu, Y.; Iwata, G.Z.; Bougas, L.; Blanchard, J.W.; Wickenbrock, A.; Jakob, G.; Schwarz, S.; Schwarzinger, C.; Jerschow, A.; Budker, D.
Rapid online solid-state battery diagnostics with optically pumped magnetometers. Appl. Sci. 2020, 10, 7864. [CrossRef]
18. Gomory, F. Complex Harmonic Susceptibilities of Bi2Sr2Ca2Cu3Oy with Different Critical-Current Density. Supercond. Sci.
Technol. 1997, 10, 523–542.
19. Mulder, C.A.M.; van Duyneveldt, A.J.; Mydosh, J.A. Susceptibility of the Cu Mn spin-glass: Frequency and field dependences.
Phys. Rev. B 1981, 23, 1384. [CrossRef]
20. Hu, Y.; Iwata, G.Z.; Mohammadi, M.; Silletta, E.V.; Wickenbrock, A.; Blanchard, J.W.; Budker, D.; Jerschow, A. Sensitive
magnetometry reveals inhomogeneities in charge storage and weak transient internal currents in Li-ion cells. Proc. Natl. Acad.
Sci. USA 2020, 117, 10667–10672. [CrossRef] [PubMed]You can also read