Introduction to the standard reference data of electron energy loss spectra and their database: eel.geri.re.kr
←
→
Page content transcription
If your browser does not render page correctly, please read the page content below
Chae et al. Applied Microscopy     (2020) 50:2
https://doi.org/10.1186/s42649-019-0015-3
                                                                                                                            Applied Microscopy

 SHORT REPORT                                                                                                                                  Open Access

Introduction to the standard reference data
of electron energy loss spectra and their
database: eel.geri.re.kr
Jeong Eun Chae, Ji-Soo Kim, Sang-Yeol Nam, Min Su Kim and Jucheol Park*

  Abstract
  Electron energy loss spectroscopy (EELS) is an analytical technique that can provide the structural, physical and
  chemical information of materials. The EELS spectra can be obtained by combining with TEM at sub-nanometer
  spatial resolution. However, EELS spectral information can’t be obtained easily because in order to interpret EELS
  spectra, we need to refer to and/or compare many reference data with each other. And in addition to that, we
  should consider the different experimental variables used to produce each data. Therefore, reliable and easily
  interpretable EELS standard reference data are needed.
  Our Electron Energy Loss Data Center (EELDC) has been designated as National Standard Electron Energy Loss Data
  Center No. 34 to develop EELS standard reference (SR) data and to play a role in dissemination and diffusion of the
  SR data to users. EELDC has developed and collected EEL SR data for the materials required by major industries and
  has a total of 82 EEL SR data. Also, we have created an online platform that provides a one-stop-place to help users
  interpret quickly EELS spectra and get various spectral information. In this paper, we introduce EEL SR data, the
  homepage of EELDC and how to use them.
  Keywords: Electron energy loss spectroscopy, Electron energy loss data center, Standard reference, Transmission
  electron microscopy

Introduction                                                                           The shape of EELS high-loss spectra is related with
Electron energy loss analysis performed on transmis-                                 density of states, more specifically the unoccupied states
sion electron microscopy can provide the chemical                                    in the conduction bands of the atoms that make up ma-
and physical information of materials and is the only                                terials. By interpreting their shape, we can obtain chem-
means to measure the electronic structure that can                                   ical and physical information such as chemical bonding
determine the properties of the materials at specific                                states and coordination number of atoms. So we can dis-
area with atomic-scale spatial resolution. And EELS                                  tinguish various materials composed of the same ele-
analysis can identify almost all elements from hydro-                                ments by using EELS analysis (Verbeeck and Aart 2004;
gen (H) to uranium (U) on the periodic table of the                                  Tan et al. 2012).
elements and also can measure the atomic numbers                                       However, the analytical interpretation of EELS spec-
and elemental compositions of the compound mate-                                     tra is slightly complicated. In the case of low-loss
rials. Therefore, the need of EELS analysis has in-                                  EELS spectrum, its shape reflects the effects of several
creased because nanoscale analysis of key materials                                  factors including volume plasmon, surface plasmon,
becomes increasingly important as the high-tech in-                                  inter-band transition and semi-core state transition.
dustry develops (Egerton 2009; Zhu et al. 2013).                                     In the case of high-loss spectrum, the overlap of
                                                                                     ionization edges, chemical shift, change of white-line
                                                                                     L3/L2 ratio and near-edge fine structure can make it
* Correspondence: jcpark13@geri.re.kr                                                difficult to interpret the EELS spectrum. In order to
Test Analysis Research Center, Innovative Technology Research Division,              accurately interpret EELS spectra, we should refer to
Gumi Electronics & Information Technology Research Institute, Gumi 39171,            as much reference data as possible through
South Korea

                                      © The Author(s). 2019 Open Access This article is distributed under the terms of the Creative Commons Attribution 4.0
                                      International License (http://creativecommons.org/licenses/by/4.0/), which permits unrestricted use, distribution, and
                                      reproduction in any medium, provided you give appropriate credit to the original author(s) and the source, provide a link to
                                      the Creative Commons license, and indicate if changes were made.
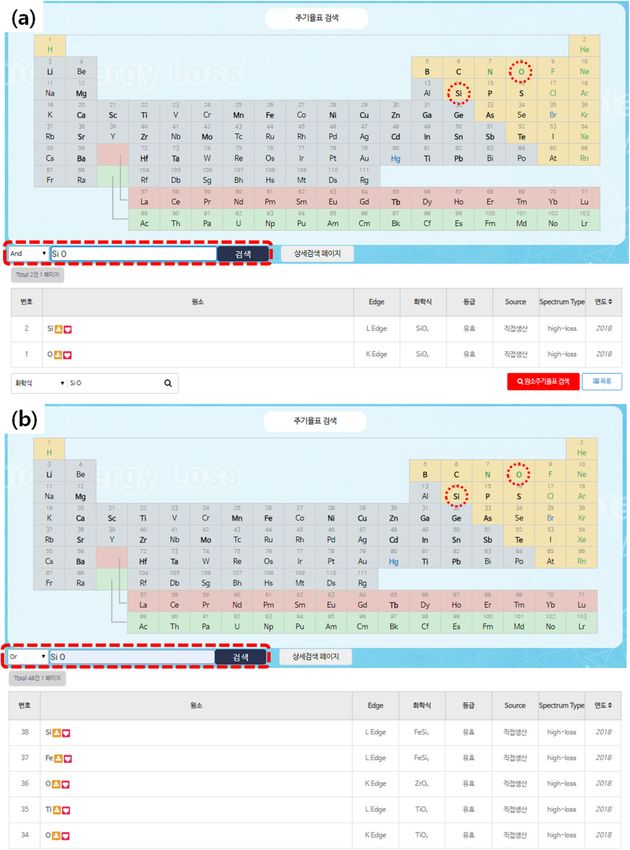
Chae et al. Applied Microscopy       (2020) 50:2                                                                             Page 2 of 7

experimentation, theory calculation and literature sur-                      production of standard reference data will be published
vey, with prior knowledge of materials themselves.                           in another paper.
The most common way to interpret EELS spectrum is
to compare it with already verified experimental data
(Riedl et al. 2006; Lajaunie et al. 2015; Krivanek et al.                    Materials and methods
2019). However, it should be very careful because the                        Production of EELS reference data
reference data also could be obtained under different                        EELS analysis was performed using a Gatan Quantum
experimental conditions.                                                     GIF965 dual EELS spectrometer attached to the
   Up to now, the reference data commonly used for EELS                      transmission electron microscope (JEOL ARM-200CF)
analysis has been the data of the EELS Atlas book pub-                       equipped with a cold field-emission electron gun and
lished in 1983 by the equipment manufacturer. However,                       probe spherical-aberration corrector.
some data from EELS Atlas have turned out to be rela-                          Reference materials used to maintain a traceability of
tively poor in terms of quality and accuracy with com-                       specimen was NiO which has been traditionally used by
pared to data recently obtained with high-performance                        EELS manufacturer. The samples had been kept uncon-
equipment showing excellent energy resolution and signal                     taminated, and carbon contamination was removed be-
intensity. And there are also database (DB) systems of                       fore and/or during the measurement. The measurement
EELS reference data built in the U.S. (WEELS) and Europe                     mode is STEM mode or diffraction mode. After check-
(EELS DB). However, they have still limited reference data                   ing the degree of carbon contamination and oxidation,
for application to high-tech industry and cutting-edge re-                   in dual EELS mode, acquisition of EELS data was re-
search. Therefore, the development of many reliable EELS                     peated five times in different locations and their average
data have been increasingly needed (P Ewels et al. 2016).                    values of on-set energy were used. Then, the data was
   In this paper, we will introduce the some EEL standard                    evaluated in accordance with the SR data evaluation pro-
reference (SR) data and our database system of 82 EEL                        cedures established by our data center. Detailed proce-
SR data. How to use of EEL SR data of our database will                      dures and explanations will be mentioned in another
be mentioned. More detailed explanation for the                              paper.

 Fig. 1 Main page of Electron Energy Loss Data Center (EELDC) website (http://eel.geri.re.kr)
Chae et al. Applied Microscopy     (2020) 50:2                                                                              Page 3 of 7

Table 1 Meta information of EEL SR data                               Table 1 Meta information of EEL SR data (Continued)
General                                                                 Dispersion (eV/pixel):                      0.25
  Element:                                       Ti                     Data Range (eV)                             406–918
  Formula:                                       TiO2                   ZLP Resolution (eV):                        1.5
  Name:                                          Titanium               High-Loss Exposure Time (sec):              0.5
  Classes:                                       Element                Number of Readouts (times):                 100
Specimen Information                                                    Edge Energy (eV):                           457.4
  Sample Production Method:                      Standard Materials     Extended Uncertainty (eV):                  1.0
                                                 TED PELLA-18241
                                                                      Data Correction
  Specimen Preparation Method:                   FIB
                                                                        Dark Current Correction:
  Specimen Type:                                 Bulk
                                                                        Gain Variation Spectrum:
  Relative Thickness (t/λ):                      0.73
                                                                        Calibration:
Data
                                                                        Deconvolution Methods:
  Bandgap Energy (eV):
                                                                      Citation
  Plasmon Energy (eV):
                                                                        Author Name(s):
Equipment Information
                                                                        Journal:
  Microscope Name / Model:                       JEOL
                                                                        url site:
  Gun Type:                                      Cold FEG
                                                                      Notes
  Detector:                                      GIF965-ER
                                                                        Carbon contamination: none
  Acquisition Mode:                              Diffraction mode
  Convergence Semi-angle (mrad):                 0.001                Construction of EELS database
  Collection Semi-angle (mrad):                  10.4                 We constructed the homepage (eel.geri.re.kr) of our
Probe Size (nm):                                                      EELS data center through HTML5-based reactive web
  Beam Current (pA):                             100                  (CSS) to improve database usability and has applied a
                                                                      user-friendly interface. To facilitate the search and
  Incident Beam Energy (keV):                    200
                                                                      utilization of EELS standard reference data, data search
  Best Energy Resolution (eV):                   0.33
                                                                      system was constructed based on the periodic table of
  Incident Beam Energy (keV):                    200                  elements displayed on the main screen of the website
  Energy Resolution (eV):                        0.33                 (Fig. 1). On the menu bar, the introduction of general
  Vacuum status                                  1.10E-05             standard reference data, EEL data center and EELS SR
Spectrum Information                                                  data, and another separate search function were pre-
                                                                      pared. In addition, maintenance functions such as bul-
  Dispersion (eV/pixel)                          0.05
                                                                      letin manager and user manager were added to
  Data Range (eV)                                446–548
                                                                      efficiently operate our website and improve it by reflect-
  ZLP Resolution (eV):                           0.65                 ing feedbacks from users.
  High-Loss Exposure Time (sec):                 2.0
  Number of Readouts (times):                    100                  Results and discussion
  Edge Energy (eV):                              457.4                Standard reference data of EELS
                                                                      “Standard reference (SR) data” can be defined at the
  Extended Uncertainty (eV):                     0.6
                                                                      data that are certified through scientific analysis and
Spectrum Information
                                                                      evaluation of the accuracy and reliability of measure-
  Dispersion (eV/pixel):                         0.1                  ment data and information, and can be used continu-
  Data Range (eV):                               436–641              ously or repeatedly in all fields of national society. In
  ZLP Resolution (eV):                           0.8                  short, the SR data should be recognized and shared
  High-Loss Exposure Time (sec):                 1.0                  as reliable reference data at the national level. In
                                                                      order to create a SR data, a quality system should be
  Number of Readouts (times):                    100
                                                                      established to produce, collect and evaluate measure-
  Edge Energy (eV):                              457.4
                                                                      ment data. In November 2016, our group was desig-
  Extended Uncertainty (eV):                     0.6                  nated as the 34th National Reference Standard
Spectrum Information                                                  Electron Energy Loss Data Center (EELDC) to play a
                                                                      role in developing and disseminating EELS reference
Chae et al. Applied Microscopy (2020) 50:2 Page 4 of 7
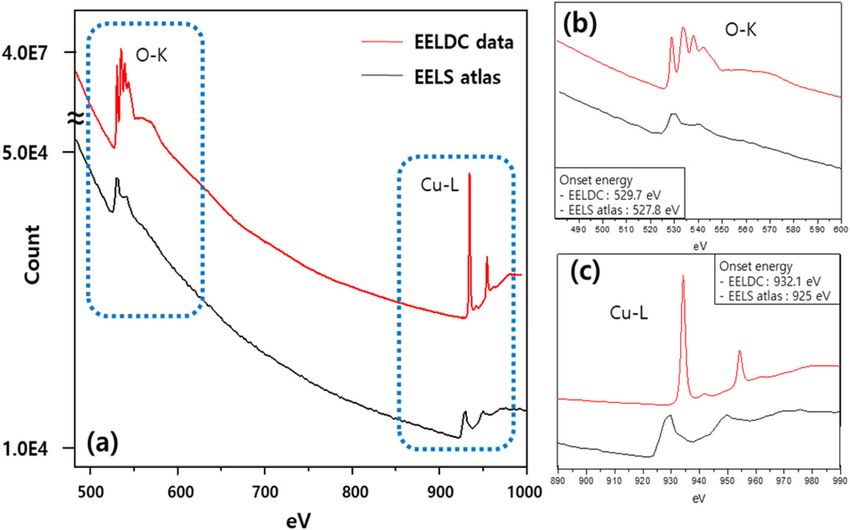
Fig. 2 Comparison of (a) existing reference data (EELS Atlas) and the recent standard reference data (EELDC) of CuO. The magnified areas of O-K
and Cu-L are shown in (b) and (c), respectively
data by the Ministry of Trade, Industry and Energy of was compared in Fig. 2. They show spectral shape
Korea. difference. It is possible because they are obtained by
All EELS SR data produced by EELS DC were ac- different acquisition condition such as energy range
quired according to our standard procedures for EELS and beam intensity. However, onset energy position of O
production certified by the National Reference Stan- K-edge and Cu L-edge and details of their peak shape
dards Center of Korea. All information related to show inconceivable differences shown in Fig. 2b and c.
measurement, such as samples, equipment specifica- EELS SR data show very sharp peak shape and exact onset
tion and measurement conditions, was recorded in position of O K-edge and Cu L-edge.
the meta-information table as shown in Table 1. Also,
the SR EELS data were evaluated and certified based
on the overall criteria of the data assessment provided How to use the data search system
by the National Reference Standards Center of Korea. We constructed an online database system of the 82
Currently, EELDC has produced 82 SR EELS data EELS SR data for immediate and convenient use. By
which includes core materials needed in major indus- using our database through web server, the interpret-
tries such as semiconductors, displays and secondary ation of EELS spectra can be easily performed without
batteries. the individual hassle of searching for structural informa-
Each EELS SR data consist of several spectra with tion, characteristics or phase identification. Also, how to
different dispersions and meta-information which in- use EELS SR data and website homepage is designed to
cludes material name, element name, sample informa- be relatively easy and convenient. Users who access the
tion, equipment information, measurement conditions homepage are guided into four main categories, which
and uncertainty values. The uncertainty values are are the introduction of our data center, SR data search,
provided to ensure measurement traceability and reli- SR information and bulletin board at the top of the
ability of our measurements. homepage. Through simple membership, users can get
various useful information from each menu.
Comparison between EELS atlas and SR EELS data Data searching method using the periodic table of ele-
Previous EELS reference data have showed some reli- ments was adopted for intuitive and efficient use. The
ability issue due to poorer equipment performance instruction manual of the periodic table search system is
and the lack of data for new materials compared to shown in Fig. 3. How to use is as follows: select the de-
the most recent EELS reference data. As an example, sired element in the periodic table and click ‘Search’. If
the EELS spectra of CuO in the existing reference the compound you are looking for consists of two or
data (EELS Atlas) and in the recent SR data (EELDC) more elements, you can click ‘and’ and select anotherChae et al. Applied Microscopy (2020) 50:2 Page 5 of 7 Fig. 3 Data search methods and their retrieved results. a Searching for Si and O by selecting ‘and’ results in the materials containing both Si and O. b Searching for Si and O by selecting ‘or’ results in the materials containing Si or O element of the compound. On the other hand, if you by moving x-axis slide bar below the spectrum and the de- search by selecting ‘or’, all materials including the ele- tailed shape of them can be observed. As x-axis range is ments that you selected will be retrieved. Another data freely selected, the y-axis is automatically adjusted accord- search function is shown in the menu of reference ing to the maximum intensity at each range. CSV files can standard search. be downloaded by clicking the blue name below each The retrieved list is represented by edge type, chemical spectrum (Fig. 4). For users to process the spectra directly, formula, data class, production method and spectrum DM files as raw data will also be provided. type. A searched data consist of various spectra with dif- Also, each spectrum data has its own meta-information ferent dispersion (at least 2 to 3) and different energy consisting of general information, specimen information, range (low and high region). The spectra can be magnified equipment information and spectrum information
Chae et al. Applied Microscopy      (2020) 50:2                                                                                          Page 6 of 7

 Fig. 4 EEL standard reference spectra of Ti-L edge of TiO2 with the 0.05, 0.1 and 0.25 eV dispersion. CSV files can be downloaded by clicking the
 blue name below each spectrum

(Table 1). In the spectrum information, specifically                        system of EEL SR data as shown in Fig. 2. The home-
onset energy and measurement uncertainty values for                         page also provides a calendar (displaying the relevant
data reliability and accuracy are provided.                                 event schedule), links to other EELS reference database
                                                                            homepage and user information management. The Elec-
Using the homepage                                                          tron Energy Loss Data Center has hold user training
Our homepage was organized according to itemized                            courses, forums, workshops and seminars to introduce
functions, such as the introduction of the data center                      various programs to promote and utilize EEL SR data.
and standard references, bulletin boards and the search                     All schedules and results to the events are posted on the
Chae et al. Applied Microscopy (2020) 50:2 Page 7 of 7
website, and users who want to participate in them can P. Ewels, T. Sikora, V. Serin, C.P. Ewels, L. Lajaunie, A complete overhaul of the
apply through our website. EELDC also has published EELS and XAS database: Eelsdb.Eu. Microsc. Microanal. 22, 717–724 (2016)
O.L. Krivanek, N. Dellby, J.A. Hachtel, J.C. Idrobo, M.T. Hotz, B. Plotkin-Swing, N.J.
annual EEL SR data books and has distributed them at Bacon, A.L. Bleloch, G.J. Corbin, M.V. Hoffman, C.E. Meyer, T.C. Lovejoy,
the events hosted by the data center. If you want to get Progress in ultrahigh energy resolution EELS. Ultramicroscopy 203, 60–67
the data books, you can apply for it on the homepage or (2019)
L. Lajaunie, F. Boucher, R. Dessapt, P. Moreau, Quantitative use electron energy-
by e-mail. Related details will be posted on the home- loss spectroscopy Mo-M2,3 edges for the study of molybdenum oxides.
page notice. The homepage of the Electron Energy Loss Ultramicroscopy 149, 1–8 (2015)
Data Center will be continually reorganized as required T. Riedl, T. Gemming, K. Wetzig, Extraction of EELS white-line intensities of
manganese compounds: Methods, accuracy, and valence sensitivity.
by users and ask their requirements and questions Ultramicroscopy 106, 284–291 (2006)
through bulletin boards or e-mail. H. Tan, J. Verbeeck, A. Abakumov, G.V. Tendeloo, Oxidation state and chemical
shift investigation in transition metal oxides by EELS. Ultramicroscopy 116,
24–33 (2012)
Conclusion J. Verbeeck, S.V. Aart, Model based quantification of EELS spectra.
We introduced the electron energy loss standard refer- Ultramicroscopy 101, 207–224 (2004)
G. Zhu, S. Lazar, A.P. Knights, G.A. Botton, Atomic-level 2-dimensional chemical
ence and the website of electron energy loss data center mapping and imaging of individual dopants in a phosphor crystal. Phys.
(eel.geri.re.kr). The electron energy loss standard refer- Chem. Chem. Phys. 15, 11420–11426 (2013)
ence (EEL SR) database is provided on the website of the
electron energy loss data center and is easily accessible Publisher’s Note
to users through the search system using the periodic Springer Nature remains neutral with regard to jurisdictional claims in
published maps and institutional affiliations.
table of elements. Eighty-two EELS SR spectra with vari-
ous dispersions and detailed meta-information are pro-
vided to make it much easier to effectively utilize the
data. The website was designed to be simple to zoom in
and out the spectra online and check spectrum shape
and energy values. The EELS SR data with detailed
meta- information can be downloaded as CSV or DM
files for users to conveniently process and analyze them.
Abbreviations
EELDC: Electron Energy Loss Data Center; EELS: Electron energy loss
spectroscopy; SR: Standard reference; STEM: Scanning transmission electron
microscope
Acknowledgments
Not Applicable.
Authors’ contributions
JEC have contributed to EELS data analysis and writing the manuscript.
JSK have contributed to sample preparation and performing FIB
experiment. SYN and MSK have contributed to producing experimental
resources, data acquisition. JCP has supervised the project along with
advising and reviewing the manuscript. All authors read and approved
the final manuscript.
Funding
This research was supported by the MOTIE (Ministry of Trade, Industry &
Energy (project number 10080654) and KSRC (Korea Semiconductor Research
Consortium) support program for the development of the future
semiconductor device.
Availability of data and materials
The datasets used and/or analyzed during the current study are available
from the corresponding author on reasonable request.
Competing interests
The authors declare that they have no competing interests.
Received: 4 September 2019 Accepted: 25 October 2019
References
R.F. Egerton, Electron energy-loss spectroscopy in the TEM. Rep. Prog. Phys. 72,
016502 (2009)You can also read