Investor Presentation - Digital presence for brick-and-mortar stores in 40+ countries - Investor Relations | Wish
←
→
Page content transcription
If your browser does not render page correctly, please read the page content below

LOCAL

         Digital presence for
          brick-and-mortar
            stores in 40+
    Investor Presentation
              countries
    January 2021

1                               Copyright © Wish 2020.
Disclaimer / Safe Harbor
    THE PURPOSE OF THIS PRESENTATION IS TO INTRODUCE YOU TO CONTEXTLOGIC INC. D/B/A WISH                               New risk factors and uncertainties may emerge from time to time, and it is not possible to predict all risk
    (“WISH”, “WE” OR “OUR”).                                                                                           factors and uncertainties nor can we assess the impact of all factors on our business or the extent to which
                                                                                                                       any factor, or combination of factors, may cause actual results to differ materially from those contained in,
    This presentation contains forward-looking statements that involve risks and uncertainties. Forward-looking        or implied by, any forward-looking statements. In light of these risks, uncertainties and assumptions, the
    statements are neither historical facts nor assurances of future performance. Instead, they are based on our       forward-looking events and circumstances described in this presentation may not occur and actual results
    current expectations and projections about future events and financial trends that we believe may affect our       could differ materially and adversely from those anticipated or implied in the forward-looking statements
    financial condition, results of operations, business strategy, and financial needs. All statements other than      contained in this presentation.
    statements of historical facts contained in this presentation, including any statements regarding our
    expectations of the potential market opportunity, potential growth opportunities; effectiveness of our             Certain information contained in this presentation and statements made orally during this presentation relate
    platform in attracting and engaging users and merchants; growth in mobile usage; our ability to expand our         to or are based on estimates and information concerning our industry, including market position, market
    offerings; network effects to drive growth; our operating leverage and our ability to flex growth and margin;      size, and growth rates of the markets in which we participate, that are based on industry publications and
    our ability to scale and effectively manage growth; the impact of COVID-19 on our business; and our                reports. This information involves a number of assumptions and limitations, and you are cautioned not to
    financial performance and projections relating to our competitors and our industry, are forward-looking            give undue weight to these estimates. We have not independently verified the accuracy or completeness of
    statements. The words “may,” “will,” “expect,” “anticipate,” “aim,” “estimate,” “intend,” “plan,” “believe,”       the data contained in these industry publications and reports. In addition, industry publications, studies and
    “is/are likely to,” “potential,” “continue” and other similar expressions are intended to identify forward-        surveys generally state that they have been obtained from sources believed to be reliable, although they do
    looking statements, although not all forward-looking statements contain these identifying words. The               not guarantee the accuracy or completeness of such information. While we believe that each of these
    forward-looking statements in this presentation are only predictions and represent our views as of the date        studies and publications is reliable, we have not independently verified market and industry data from third
    of this presentation. Although we believe the expectations reflected in such forward-looking statements are        parties. Further, information contained in this presentation and statements made orally during this
    reasonable, we can give no assurance that such expectations will prove to be correct. The forward-looking          presentation also relate to or are based on our internal company research and commissioned studies and
    statements are subject to a number of risks, uncertainties, and assumptions, including, but not limited to: (i)    while we believe such internal company research and commissioned studies are reliable and the market
    our efforts to acquire new users and engage existing users; (ii) retaining the services of Peter Szulczewski,      definitions are appropriate, neither such research nor these definitions have been verified by any
    our founder, Chief Executive Officer, and Chairperson, or other members of our senior management team;             independent source. The industry in which we operate is subject to a high degree of uncertainty and risk
    (iii) maintaining a good relationship with platform providers; (iv) merchants using unethical or illegal           due to variety of factors, including those described Wish’s filings with the SEC, including its final prospectus
    business practices, including the sale of counterfeit or fraudulent products, or our policies and practices with   filed with the SEC on December 17, 2020, and future reports that Wish may file with the SEC from time to
    respect to such sales being perceived or found to be inadequate; (v) our ability compete effectively; (vi) the     time. These and other factors could cause results to differ materially from those expressed in these
    impact of the ongoing COVID-19 pandemic on our business and results of operations; (vii) economic tension          publications, reports, and internal research and commissioned studies.
    between the United States and China, or between other countries; (viii) the impact of significant disruption
    in service on our platform or in our computer systems; and (ix) our involvement in litigation matters or other     In addition to the U.S. GAAP financials, this presentation includes certain non-GAAP financial measures. The
    legal proceedings, which could be expensive and time consuming. Further information on these and                   non-GAAP measures have limitations as analytical tools and you should not consider them in isolation or as a
    additional risks that could affect Wish’s results is included in its filings with the Securities and Exchange      substitute for the most directly comparable financial measures prepared in accordance with GAAP. There are
    Commission (“SEC”), including its final prospectus filed with the SEC on December 17, 2020, and future             a number of limitations related to the use of these non-GAAP financial measures versus their nearest GAAP
    reports that Wish may file with the SEC from time to time, which could cause actual results to vary from           equivalents. Other companies, including companies in our industry, may calculate non-GAAP financial
    expectations.                                                                                                      measures differently or may use other measures to evaluate their performance, all of which could reduce the
                                                                                                                       usefulness of our non-GAAP financial measures as tools for comparison. We urge you to review the
    Accordingly, readers are cautioned not to place undue reliance on these forward-looking statements. Except         reconciliation of our non-GAAP financial measures to the most directly comparable GAAP financial measures
    as required by applicable law, we do not plan to publicly update or revise any forward-looking statements          set forth in the Appendix, and not to rely on any single financial measure to evaluate our business.
    contained herein, whether as a result of any new information, future events, changed circumstances or
    otherwise. No representations or warranties (expressed or implied) are made about the accuracy of any such
    forward-looking statements. We operate in a very competitive and rapidly changing environment.

2                                                                                                                                                                                                           Copyright © Wish 2020.
LOCAL

                             Our Mission

                             Bring an affordable and entertaining
                             mobile shopping experience to billions
                             of consumers around the world.
                             billions
      Digital presence for   of consumers around the world.
       brick-and-mortar
         stores in 40+
           countries

334                                                   Copyright © Wish 2020.
Global marketplace                                                                                                      100+
                                                                                                                                    Countries
         underpinned by
         technology and data

        90%+
                                                                            100M+                                                  #1              500K+
         Mobile

        $2.3B
         LTM Revenue
                                                                                                         MAUs
                                                                                                                                Most downloaded
                                                                                                                                                   Merchants

                                                                                                                                 shopping app
        32%
         YTD 2020 YoY Growth
                                                                                                                                  2017-2019

                                                                                                                                640M+
                                                                                                                                   Items Shipped
    Note: Wish is the most downloaded app for each of the last 3 years. MAUs refer to Monthly Active Users. LTM revenue as of
4   September 30, 2020. Over 90% of our user activity and purchases occur on our mobile app. 640M+ items shipped in the last                        Copyright © Wish 2020.
    twelve months ended September 30, 2020. Countries, Merchants, and MAU data as of September 30, 2020.
    Source: Sensor Tower, Analysis of store intelligence platform data, November 2019.
Our merchants offer unbranded products
                        at significant discounts to branded
                                    alternatives

                           VS                                                    VS

    Branded                     Unbranded                 Branded                     Unbranded

    $173      3K Reviews        $85         14K Reviews   $165      2K Reviews        $20     24K Reviews

5                                                                                      Copyright © Wish 2020.
User-Generated Content (UGC) serves as a
                       source of trust and quality for our unbranded
                                           products
          85M Product Ratings     1.9M Videos       10.5M Images  72M Store Ratings

6   Note: All metrics for the nine months ended September 30, 2020.       Copyright © Wish 2020.
Value-conscious consumers have been left behind by ecommerce
                                    We believe the next billion ecommerce customers will be these value-conscious consumers.

       Signifies number of
       households with annual
       income < $75,000

                             ~60M                                                                        ~ 75%                             ~ $50K
                                                                                      Of people surveyed prioritize the price of          Wish buyer median
                          United States                                               an item over brand and delivery time             annual household income

                           ~300M                                                                                                           ~75%
                                                                                                                                      Of Wish users have an annual
                               Europe                                                                                              household income less than $75,000

       1B+ Global Households
                     ex. China and India

7   Source: Wish survey, conducted in August 2020 across 2,850 consumers in select countries; U.S. and                                               Copyright © Wish 2020.
    European household income from Euromonitor International Limited, Economies and Consumers,
    updated August 2020. Global Households are according to our estimates.
Traditional ecommerce has not met evolving consumer behavior

                     Discovery-based shopping creates                    Search-driven ecommerce serves predetermined
                      purchase intent for new items.                            purchase intent for specific items.

                89% of women and 78% of men who visit
                physical stores frequently add additional items
                to their cart beyond their identified need

8   Source: First Insight, The State of Consumer Spending, March 2019.                                  Copyright © Wish 2020.
No two user feeds are the same
    Karla C.                                Israel V.                                                  Susanne &
    LOCATION                                LOCATION                                                   Cristoffer
    Bellflower,                             Mexico City, Mexico
    California                                                                                         LOCATION
                                            CUSTOMER SINCE
                                                                                                       Tierp, Sweden
    CUSTOMER SINCE                          2016
    2017                                                                                               CUSTOMER SINCE
                                            PURCHASES LAST YEAR
                                                                                                       2019
    PURCHASES LAST YEAR                     46
    40                                                                                                 PURCHASES LAST YEAR
                                            FAVORITE CATEGORIES
                                                                                                       63
    FAVORITE CATEGORIES                     Car
    Women’s                                 Accessories                                                FAVORITE CATEGORIES
    Fashion                                 Tools                                                      Women’s
    Makeup     /                            Electronics /                                              Fashion Home
    Beauty  Home                            Gadgets                                                    Decor Makeup
    Decor                                                                                              / Beauty

9
9                                                                 Copyright © Wish 2020. Confidential
                                                                                              Copyright
                                                                                                      and©proprietary.
                                                                                                           Wish 2020.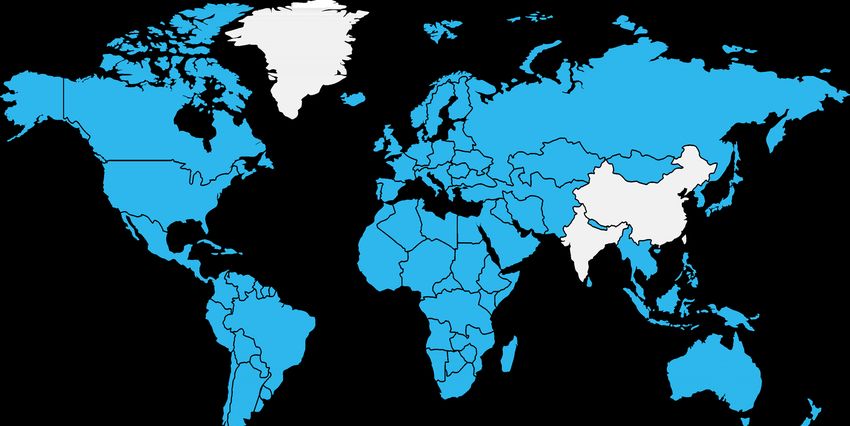
We enable a
     discovery-based
     and entertaining
     shopping experience

     500+                   Distinct products seen per active user
                            on a daily basis across multiple
                            categories

70%+                         Of the sales on our platform do
                             not involve a search query

65%+                        Of our users click on a product
                            detail page from the main feed

            9+              Minutes spent per day on the Wish platform

10   Note: 9 minutes per day stat calculated as average over the last twelve months ended     Copyright © Wish 2020.
     September 30, 2020. 500+ distinct products stat calculated as an average between April
     2020 and September 2020. All other stats as of September 30, 2020.
Our comprehensive suite of indispensable merchant services
Demand Data Business
Generation Intelligence UGC Creation Logistics Operations
11 Copyright © Wish 2020.Electronics Merchant 34% Increase AOV
VIP Outlet Increase in
484% Impressions
We enable merchants to
amplify reach and sales
through ProductBoost
~ 30%
Of our merchants have
used ProductBoost
~ $138M
ProductBoost
YTD 2020 Revenue
Family Brand Merchant 5x Increase in Sales
Keaworld 69%
Increase in
Impressions
Wish ProductBoost:
Pick products to promote
Decide how much to spend and set budget
Algorithmic-based model to accelerate
product exposure
12 Note: % of merchants using ProductBoost calculated as of the nine months ended Copyright © Wish 2020.
September 30, 2020. ProductBoost YTD 2020 revenue is as of September 30, 2020.Our robust global logistics platform
Packages shipped through our proprietary logistics platform have grown substantially.
Potential to extend logistics platform beyond core marketplace business.
First Mile Bundling Transportation Warehousing Last Mile
Enables efficient first Combines orders Partners with logistics Connects to a network of Enables dropship, last mile
mile collection into one parcel vendors; optimizes pricing warehouse partners delivery and fulfillment in
and service level local stores
Wish Logistics Services WishPost | Bundling | A+ | Fulfillment by Wish | Fulfillment by Store
13 Copyright © Wish 2020.The largest home-sharing company
does not own any real estate
The largest ridesharing company
does not own any cars
LOCAL
Perhaps the biggest retailer
does not need to own any stores
Digital presence for
brick-and-mortar Store Benefits Benefits Consumer Benefits
stores in 50 countries Digital storefront Local warehousing
without owning any
Product verification
Online reach and Faster pick-up
real estate
discovery
More savings
Increased foot traffic Cost-effective
and sales fulfillment
14
14 Note: Country count as of September 30, 2020. Copyright © Wish 2020.Data science at scale is a unique advantage and core to our
business
100M+ User Data, History
and Context
MAUs
Location, Age and Gender,
Items Viewed, Device Type
User Lifetime Value
Acquisition Maximization
150M+ Activity-Based Data
Clicks and Scrolls, Impressions,
Items Listed
User of Features, Search
History, Daily Items Sold User and
Dynamic
Merchant
Pricing
500K+ Merchant Data
Performance, Refund Rates
Support
Merchants
Logistics Data ProductBoost User
Shipping Times, Shipping Logistics Personalization
Carriers, Wish Local,
640M+ Foot Traffic
Merchant
Items Shipped Insights
Product Data, History
and Context
Ratings, Videos, Photos
Vast Data Repository and Types of Data Organization Personalization Data Driven Decisions
15 Note: MAU, items shipped and merchants data as of September 30, 2020. 640M+ Copyright © Wish 2020.
items shipped in the last twelve months ended September 30, 2020.We have an extensible platform with significant avenues for
growth
Grow Users Grow Merchants Expand Offering Expand Platform
Acquire New Users Diversify Merchant Base Broaden Merchant Services Monetize Brick-and-Mortar Stores
Drive User Conversion Expand Product Categories Expand Logistics Platform Add New Product Categories
Drive Profitable LTV Grow Wish Local Offering Expand to New Advertising Partners
Expand Geographically Grow First-Party Sales
Open Commerce Platform
to Additional Businesses
16 Copyright © Wish 2020.Extensible platform driving
diversification of revenue
Powerful combination of
global scale and growth
Key financial highlights Significant operating leverage with
ability to flex growth and margin daily
Attractive unit economics underpinned by
data-driven user acquisition and engagement
Highly capital efficient model with
$1B+ of cash on balance sheet
17 Note: $1B+ cash balance is the sum of cash, cash equivalents and Copyright © Wish 2020.
marketable securities as of September 30, 2020.Extensible platform driving diversification of
revenue
Revenue by Geography Revenue by Service Mix of Services
Rest of World
10% Marketplace Revenue
South • Core Marketplace Revenue
America
5% • Commission Revenue
Logistics
• Dynamic Pricing
18%
• ProductBoost Revenue
ProductBoost
• Revenue from native
Europe
43% 8% advertising tool
North
America
42% Logistics Revenue
Core Marketplace
• Revenue from cross-border
74% logistics solutions for
merchants
18 Note: Revenue by geography is based on the ship-to address of the user and calculated as the geographic breakdown of Core Marketplace Revenue as of Copyright © Wish 2020.
the nine months ended September 30, 2020. Revenue by Service as of the nine months ended September 30, 2020.Powerful combination of global scale and growth
MAUs (in Millions) Revenue ($ in Millions)
116
$1,901
109
$137
2015-19 CAGR 100 2015-19 CAGR $1,728
44% 90
91% $6
$701
73 $101 $606
$1,101
$152
$440
49 $1,764
$1,722 $56
30 $600
$445
21 $454
$384
$144
2015 2016 2017 2018 2019 Q1 2020 Q2 2020 Q3 2020 2015 2016 2017 2018 2019 Q1 2020 Q2 2020 Q3 2020
YoY Growth 44% 62% 51% 22% 46% 53% 7% YoY Growth 209% 147% 57% 10% (2)% 67% 33%
Marketplace Logistics
19 Copyright © Wish 2020.Normalizing growth following an investment year in
2019 and COVID impact in H1 2020
Quarterly Revenue ($ in Millions) Quarterly Adjusted EBITDA Margin
Slowed marketing to
2019 YoY YTD Q3 2020 YoY Accelerated
focus on logistics,
10% 32% platform quality and
experience
marketing to
drive growth
21%
$701
$606
$576
6%
2%
$450 $455 $440
$420
(12)% (11)%
(20)%
(29)%
Q1 2019 Q2 2019 Q3 2019 Q4 2019 Q1 2020 Q2 2020 Q3 2020 Q1 2019 Q2 2019 Q3 2019 Q4 2019 Q1 2020 Q2 2020 Q3 2020
Adj. EBITDA Margin
20 Note: See Appendix for non-GAAP reconciliations. Copyright © Wish 2020.Unpacking the impact of COVID-19 in 2020 YTD
Marketplace Revenue ($ in Millions) Logistics Revenue ($ in Millions)
Core Marketplace ProductBoost
$555
$405 $152
$340
$101
$56
$44 $45 $49
Q1 Q2 Q3 Q1 Q2 Q3 Q1 Q2 Q3
YoY Growth (8)% 67% 17% (34)% (36)% (32)% 367% 461% 311%
• Q1 – Impacted by Manufacturing and Supply • Q1 – Business Activity Shutdown in China • Continued Expansion Throughout 2020
Chain Disruption in China
• Q2 – Surge in Consumer Demand • Improving “Time-to-Door”
• Q2 – COVID-Related Logistics Disruption Offset
• Q3 – Gradual Recovery • Refund Rate Down by 30%+ Between March and
by Increase in Demand
September
• Q3 – Impact from Logistics Disruption in Q2 and
Early Q3
21 Copyright © Wish 2020.Significant operating leverage with ability
to flex growth and margin daily
S&M as % of Revenue OpEx as % of Revenue Adj. EBITDA Margin
389% 19% 2%
96% (7)%
90% 91%
(12)% (12)% (12)% (11)%
78%
15%
67% 10%
63% 64%
9%
7% 4% (30)%
6% Revenue Per Employee
6% 5%
5%
$2.6M $2.8M
5% 3%
3% 2%
4% 2% 2017 LTM Q3
6% 2020
4% 4% 3% 4%
3% 3% (349)%
2%
2015 2016 2017 2018 2019 Q1 Q2 Q3 2015 2016 2017 2018 2019 Q1 Q2 Q3 2015 2016 2017 2018 2019 Q1 Q2 Q3
2020 2020 2020 2020 2020 2020 2020 2020 2020
Product Development G&A
22 Note: See Appendix for non-GAAP reconciliations. Operating Expenses calculated as the sum of Product Development and G&A expenses. Headcount as of Copyright © Wish 2020.
September 30, 2020 was 828.Increasing portion of revenue is from existing
$2.5 B buyers
$2.0 B
31%
$1.5 B
$1.0 B
69%
$0.5 B
43%
57%
$0.0 B
Q1 2017 Q1 2018 Q1 2019 Q1 2020 Q3 2020
LTM Revenue from Existing Buyers LTM Revenue from New Buyers
23 Note: Existing buyer revenue and new buyer revenue represents LTM revenue ending in each quarter Copyright © Wish 2020.
shown.Data-driven user acquisition and engagement
strategies to maximize ROI, LTV, and conversion
Average Revenue Per Active Buyer by Cohort Cumulative Lifetime Value Per Buyer by Cohort
$40
$30
$35
$25
$30
$20
$25 2018
2019
$20 $15
2017
$15 $10
2016
$10
Year 1 Year 2 Year 3 Year 4
$5 2016 Cohort 2017 Cohort 2018 Cohort 2019 Cohort
$0
Year 1 Year 2 Year 3 Year 4 CAC payback period is under 2 years for all cohorts since 2016
2016 Cohort 2017 Cohort 2018 Cohort 2019 Cohort
24 Note: LTV is calculated as cumulative gross profit. Copyright © Wish 2020.Highly capital efficient model with $1B+ of cash on balance sheet
Cash from Ops and Adj. EBITDA ($ in Millions) Capex as % of Revenue
$12 $20 $11 $1
$146
$24
$(60)
$(94) $(99)
1.1% 1.2%
$(135) $(127)
0.6%
$(211) 0.1%
2017 2018 2019 YTD 2020 2017 2018 2019 YTD 2020
Cash Flow from Ops Adj. EBITDA Capex ($ in Millions)
25 Note: See Appendix for non-GAAP reconciliations. $1B+ cash balance is the sum of cash, cash equivalents and Copyright © Wish 2020.
marketable securities as of September 30, 2020.Our financial model priorities
Scale and
Profitability
Monetization
Increase Scale and Grow User Base
Increase Lifetime Value of Users Leverage Scale of Business and Manage Costs
Diversify Merchant Base and Product Categories Invest in Sales and Marketing Engine
Innovate and Expand Wish Platform
26 Copyright © Wish 2020.Appendix 27 Copyright © Wish 2020.
GAAP to non-GAAP reconciliations
     ($in millions)                                         2015      2016      2017      2018                      2019

 Net loss                                                   $ (537)   $ (151)   $ (207)   $ (208)                  $ (129)

 Excluding

        Interest and other income (expense), net             $5        $5       $ (10)    $ (15)                   $ (19)

        Provision for income taxes                             -        -          -         -                         1

        Depreciation and amortization                         1         2         4          8                        10

        Stock-based compensation expense                      19        7         8          2                         2
        Remeasurement of redeemable convertible preferred
                                                              10        5         70         -                         3
        stock warrant liabilities
        Recurring other income items                           -        -          -         2                         5

 Adjusted EBITDA                                            $ (502)   $ (132)   $ (135)   $ (211)                  $ (127)

28                                                                                                  Copyright © Wish 2020.
GAAP to non-GAAP reconciliations (cont’d)
($ in Millions) Q1 2019 Q2 2019 Q3 2019 Q4 2019 Q1 2020 Q2 2020 Q3 2020
Net loss $ 87 $ 42 $ (134) $ (124) $ (66) $ (11) $ (99)
Excluding
Interest and other income (expense), net $ (5) $ (8) $ (3) $ (3) $ (3) $ (5) $8
Provision for income taxes - - - 1 - - 1
Depreciation and amortization 2 3 2 3 2 3 4
Stock-based compensation expense - 2 - - - - 9
Remeasurement of redeemable
convertible preferred stock warrant 10 (17) 4 6 15 28 12
liabilities
Recurring other income items 1 2 1 1 1 1 1
Adjusted EBITDA $ 95 $ 24 $ (130) $ (116) $ (51) $ 16 $ (64)
29 Copyright © Wish 2020.You can also read