PFIC Meeting Commercial Development Discussion Items - August 12, 2020 - DFW Airport
←
→
Page content transcription
If your browser does not render page correctly, please read the page content below
PFIC Meeting
Commercial Development Discussion Items

August 12, 2020
Agenda
Commercial Development Discussion Items
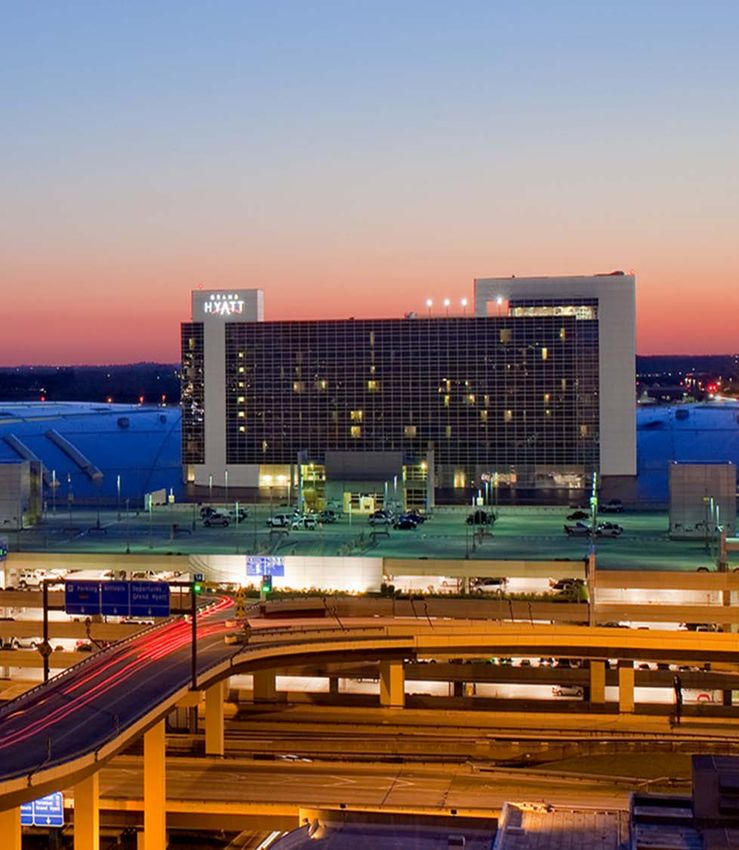
I. Grand Hyatt DFW Hotel
a. FY 2020 Review
b. FY 2021 Business Plan and Budgets
c. Renovation Update
II. Hyatt Place DFW Hotel
a. FY 2020 Review
b. FY 2021 Business Plan and Budgets
III. DFW Campus West
a. FY 2020 Review
b. FY 2021 Business Plan and Budgets
2
Grand Hyatt DFW Hotel

    John Brookby

    FY 2020 Review
            Marc Ellin
            Corinna Wenks

    FY 2020 Business Plan and Budgets
            Corinna Wenks

    Renovation Update
            Corinna Wenks

3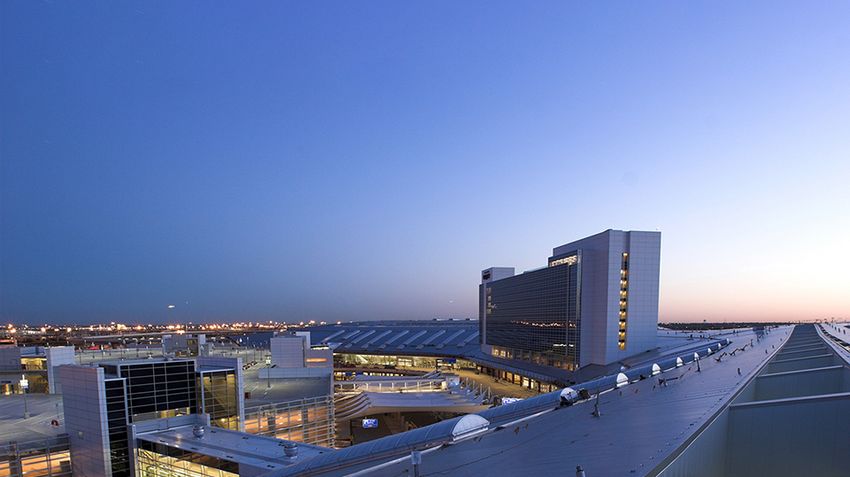
Introducing Corinna Wenks

Born and raised in Germany, Corinna began her Hyatt career
in 1996 as a Hotel Management at Hyatt Regency Cologne.
She grew her career in the Rooms Division at Hyatt Regency
                                                                   Corinna Wenks
Cleveland, Park Hyatt Beaver Creek, Hyatt Regency Waikiki,         General Manager Grand Hyatt DFW
Park Hyatt Chicago, and Grand Hyatt San Francisco.
In 2018, she was promoted to General Manager at the historic
hotel The Driskill in Austin. With her strong background in
the luxury hotel segment she was not only successful
in increasing the hotel's service performance but also
increasing the hotel's profitability with building a stronger
targeted customer base in a more efficient operation.
Corinna believes that care, purpose and strong values are the
keys to success and that actions speak for themselves. A
combination of humility and empathy can build a strong,
inclusive team that can accomplish anything.
Corinna loves to explore the cultural and culinary scenes in any
new destination to which she is traveling or moving to.

October 18th, 2019

4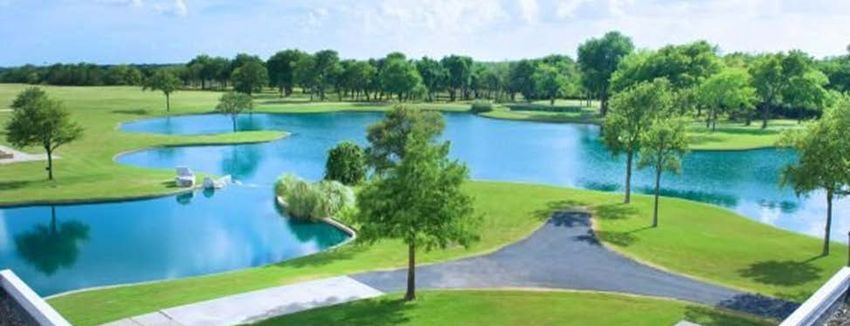
HOTEL INDUSTRY OVERVIEW

                                                                             COVID-19
                                                                             Impact Begins

    •   Data sources current and future projections: STR – competitive benchmarking and marketplace insights, CBRE reporting,
        Hotel Lodging Associations, Hotel industry booking engines with search engine optimizations, Hyatt's global data resources
5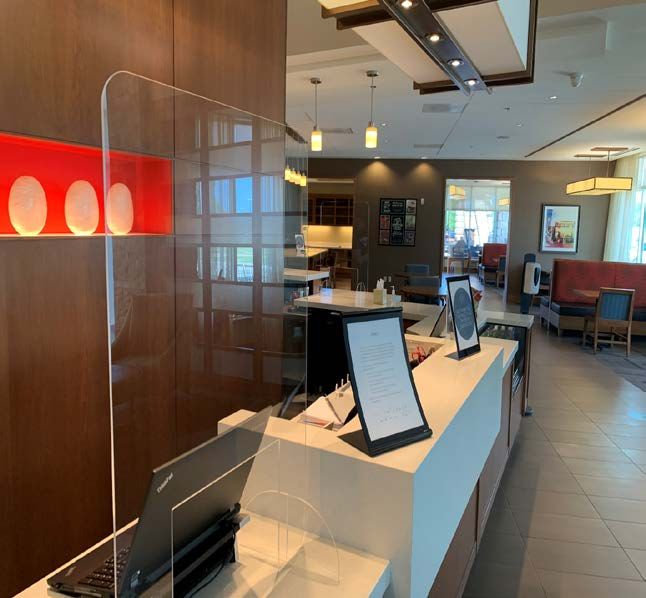
HYATT AMERICAS FULL SERVICE – AIRPORT LOCATIONS
              Top 10 Producing Airport Locations                                             Business Mix- Airport Hotels

                                                Data 04/23-7/22/20

    •   DCA/IAD growth contributed largely to the recent March on Washington on announcement for 8/24/20
    •   Internet is the largest producer which is consistent with the entire country as a whole
    •   Volume segment shows a greater production for airports compared to the other locations mainly driven by distressed passengers
6
FY2020 COVID-19 INITIATIVES
Hygiene and Guest related:
Social distancing and safety signage throughout the
property
Sanitizing stations and amenities in guest rooms
and public areas
Specific Hygiene and Wellness training for
the property with mandated guidance on
cleanliness procedures and PPE
GBAC certification and Hygiene Manager for
the property
Guest survey adjusted with COVID specific
questions (cleanliness, communication about the
hotel's safety initiatives, contactless options)
Cost Controls:
Micromanaged inventory controls and flexibility in
utilization of all raw and unfinished food and amenity
products to avoid waste and limit purchases
Cost Contingency Plans:
Reduction of staff by 70% with 39% loss in occupancy
year over year and 26% to budget
7 Operating Expense reduction by 37% to budget 7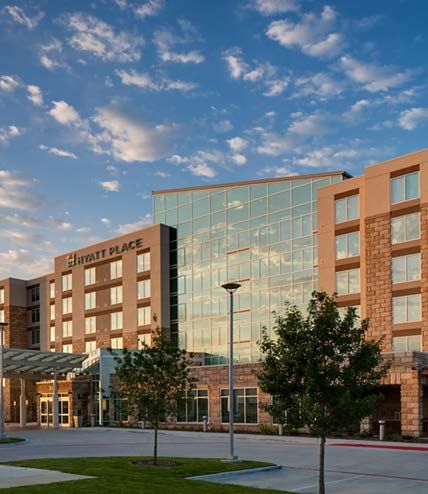
FY2020 GRAND HYATT DFW TOTAL REVENUE
$6.0
$5.0
$4.4 COVID-19 Impact Begins
$4.0
$3.0
$2.0
$1.0
$-
Oct Nov Dec Jan Feb Mar Apr May Jun Jul Aug Sep
Actual Budget Last Year
Total year performance: FY2020 (year-end forecast) $22,172 – down 41.2% to Budget
FY2020 Budget: $37,738
FY2019 Actuals: $44,081
8
FY2020 GRAND HYATT DFW GOP
$2.5 $2.3 COVID-19 Impact Begins
$1.5
$0.5
$(0.5)
$(1.5)
Oct Nov Dec Jan Feb Mar Apr May Jun Jul Aug Sep
Actual Budget Last Year
Total year performance: FY2020 (year-end forecast) $8,439 – down 46.8% to Budget
FY2020 Budget: $15,850
FY2019 Actuals: $21,595
9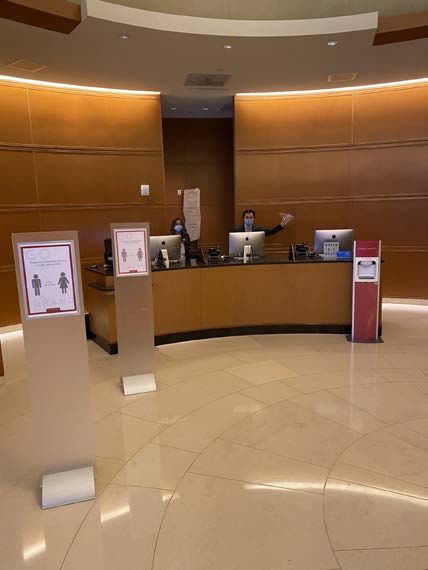
FY2020 GRAND HYATT DFW REVENUE TO OWNER
$2.5 $2.3
COVID–19 Impact Begins
$1.5
$0.5
$(0.5)
$(1.5)
Oct Nov Dec Jan Feb Mar Apr May Jun Jul Aug Sep
Actual Budget Last Year
Total year performance: FY2020 (year-end forecast) $7,047 – down 49.6% to Budget
FY2020 Budget: $13,982
FY2019 Actuals: $20,215
10FY2020 YEAR-END FORECAST
• Fiscal YTD through February month end reflected the following growth over 2019: ADR up $9.25 (3.5%) / Total Revenue up $222k (1.2%) / GOP up $425K / EBITA up $494k
• COVID-19 Revenue impact to budget beginning mid-March:
• 42% decline in RevPar due to loss in Occ and ADR with low business levels March – September
• Rooms Revenue decline $8.5m / ADR decline of $16, GOP loss of $730K
• F&B Revenue decline $6.8m / $4.9m loss in Banquet Revenue including 1.6m at 100% GOP flow through
• Between Mar 1 – Sep 30 : 154 Group cancels valued at $4m in addition to 50 Catering event cancelations valued at $100k
• Lead volume decline by 80% and transaction volume decline by 93%, primarily from Corporate & Pharmaceutical segment
11
• Cost reduction – 37% Operational expenses including $752k Hyatt Corporate COVID contract savings, $424k Management fee reductionMARKET PERFORMANCE – JUNE 2020 YTD
Contractual Comp Set:
% Change
CY 2020 Comp. Set DFWGH % Chg DFWGH Index
(Comp Set)
REVPAR -51.7% $58.32 -56.6% $100.56 172.4%
Area Hotel Set includes: Hyatt Regency DFW (811), Marriott North (491), Hilton DFW Lakes (393), Omni Mandalay (421),
Westin DFW (506), Embassy Suites DFW (329), Marriott South (295). Total Rooms 3,246
Omni Mandalay did not report in April/May due to closure
Luxury Hotel Set:
% Change
CY 2020 Comp. Set DFWGH % Chg DFWGH Index
(Comp Set)
REVPAR -43.1% $124.25 -56.6% $100.56 80.9%
Luxury Hotel Set includes: Mansion on Turtle Creek (143), Four Seasons Resort Las Colinas (431), Hotel Crescent Court
(220), Ritz-Carlton Dallas (218), W Hotel Dallas (252). Total Rooms 1,264.
Mansion / Four Seasons / Ritz did not report in April / May due to closure
Airport Comp Set:
% Change
CY 2020 Comp. Set DFWGH % Chg DFWGH Index
(Comp Set)
REVPAR -51.0% $82.17 -56.6% $100.56 122.4%
Airport Comp Set includes: Hyatt Regency Orlando Airport (445), Renaissance Atlanta Airport (387), Westin Detroit
Airport(404), Hilton Chicago O’Hare (840), Fairmont Vancouver (386), Westin Denver International (519). Total Rooms
3,001.
12 All reporting for full year / no closuresMEDALLIA RESEARCH
Rolling 12 months through July
Overall Rank
Guest Satisfaction Criteria Global Grand Rank
Americas
Customer Service 88% 1 2
Cleanliness of Room 99% 3 5
Condition of Hotel 90% 3 4
Overall F&B 71% 3 7
Meeting Planner Criteria
Likelihood to Recommend 94% 2 6
Overall Event F&B Experience 94% 2 6
• Overall Rank out of 26 Parks & Grands in Americas; 100 Parks & Grand Hyatt Hotels Globally
• Guest surveys were suspended from 04/03/2020-06/01/2020
• Meeting Planner ranking > 50 response sample size
13GRAND HYATT DFW HOTEL AWARDS
tripadvisor
#1 Ranking of 221 Dallas Hotels
Certificate of Excellence Award
& Hall of Fame Award
Hall of Fame award achieved with as a five-year consecutive
recipient of the Certificate of Excellence awarded; less than
1% of 700m companies listed receive this award
STR Market Leader
#1 in Competitive Set for KPI’s (ADR/RevPAR)
AAA
2020 Four Diamond Award
Only 6.5% of 32,000 hotels throughout the US, Canada,
Mexico and Caribbean are Four Diamond rated
Skytrax World Airport Awards
2020 Best Airport Hotels in North America
One of only five Airport Hotels selected in North America; over
21 million people surveyed
Dallas Morning News
Top 100 Places to Work
Ranked #9 out of 35 Midsize Companies, 2,936 total companies
14 invited to participate in surveyFY2021 OVERVIEW
• Covid-19 significantly reduced the corporate transient and group traveler in 2020, with lasting impact into 2021
• FY2021 budget baselines current market conditions as compared to the three-year average and FY2019
• Increase in transient room nights, 70% generated in 0-3 day booking window, consistent with FY2020 and expected PAX
increase through DFW airport in FY2021
• Group projections based on standardized industry practices: evaluation of current booked room nights, lead volume, client
feedback, PACE positioning and market data provided by STR & CBRE
15 • >50% decline in group leads and booking volumes from historically targeted group industry segment, Corporate PharmaceuticalFY2021 TOTAL REVENUE (000s)
-34.2% to FY20
-66.9% to FY19
$12,000
$10,000
$11,974
$11,853
$10,738
$10,603
$9,620
$8,000
$9,651
$6,000
$5,629
$4,000
$1,417
$1,017
$4,782
$818
$2,000
$2,770
$0
Q1 Q2 Q3 Q4
FY21 Budget FY20 Forecast FY19 Actual
• Total year performance: FY2021 Revenue Budget $14.6M
• FY2020 Forecast $22.2M
• FY2019 Actuals $44.1M
16FY2021 GOP (000s)
-64.0% to FY20
-85.9% to FY19
$7,500
$6,000
$6,155
$6,175
$4,500
$5,188
$4,941
$4,571
$4,323
$3,000
$115
$1,500
-$486
-$811
-$502
$2,019
$1,389
$0
-$1,500
Q1 Q2 Q3 Q4
FY21 Budget FY20 Forecast FY19 Actual
• Total year performance:. FY2021 GOP Budget $3.0M
• FY2020 Forecast $8.4M
• FY2019 Actuals $21.6M
17FY2021 REVENUE TO OWNER (000s)
-89.4% to FY20
-96.3% to FY19
$7,500
$6,000
$5,684
$5,698
$4,500
$4,795
$4,369
$4,466
$4,083
$1,430
$3,000
-$1,047
$813
-$1,148
-$451
$1,500
-$677
$0
-$1,500
Q1 Q2 Q3 Q4
FY21 Budget FY20 Forecast FY19 Actual
• Total year performance: FY2021 Budget $746K
• FY2020 Forecast $7.0M
• FY2019 Actuals $20.2M
18FY2021 OPERATING BUDGET
• Gradual occupancy growth: Q1 20.2% / Q2 31.7% / Q3 44.7% / Q4 51.1% (annual historical occ levels exceed 80%)
• Group production: slow return in 2nd part of Q2. YOY room night decline of 42.4% with an ADR decline of $44, overall revenue decline of 52% to 2020
• YOY F&B Revenue decline of $3.6m driven by Banquet loss in Q1 and Q2
• YOY GOP impact driven by loss in ADR ($1.7m), decreased Banquet average check ($3.6m), reduction in 100% flow through revenues ($700k)
19TOTAL CAPITAL REQUESTS – GRAND HYATT DFW
FF&E: $12 .3 million + Capital Reserve: $9.8 million = Total Available Reserves $22.1 million
20GRAND HYATT DFW RENOVATION
• Renovation suspended on 4/20/20
• Proposing restart of the renovation project
mid-end FY2022
• Advantages:
• Current expert estimate travel business to
return to 2019 occupancy and revenue levels
in 2023
• Entering the growing market with a new
product to stay ahead of the competition
• Current projections indicate no to limited
business displacement in 2022 for the
duration of the project
21Hyatt Place DFW Hotel
John Brookby
FY 2020 Review
Mike Gleeson
Ryan Dayton
Francis Jallow
FY 2021 Business Plan and Budget
Ryan Dayton
Francis Jallow
22Introducing Francis Jallow
Previously, as Regional Vice President of Operations for the
Managed West Region, Francis impacted many leaders,
owners and colleagues at various levels of the Hyatt
Francis Jallow
organization. During his tenure, he made significant
District Manager of Hyatt Place DFW and
contributions to the success of the Western Region Managed
Portfolio and the Hyatt team.
Hyatt House DFW
Francis’s career with Hyatt began in 2005. He has served in a
number of roles, including General Manager at Hyatt Place
Kansas City Overland Park, Hyatt Place Denver South/Park
Meadows, Hyatt House Denver Tech Center, where he also
served in an Area General Manager capacity, and most
recently as Regional Vice President, Operations. Francis is a
graduate of Colorado State University with a BS in
Management and where he is currently completing an MS in
Management.
Francis, his wife, Cawandra, and their two children, Madelyn
and Javin, are excited to be in Texas, which brings them closer
to family.
January 28, 2020
23Hyatt Select Global Review
• Hyatt Global Care & Cleanliness Commitment
• Hyatt Select Service Marketing Promotions
• Updated F&B Offerings
24FY2020 Total Revenue (000s)
COVID-19
$620 Impact begins
$520
$420
$320
$220
$120
$20
Oct Nov Dec Jan Feb Mar Apr May Jun Jul Aug Sep
Actual Budget Last Year
25FY2020 GOP (000s)
COVID-19
$350 Impact begins
$250
$150
$50
Oct Nov Dec Jan Feb Mar Apr May Jun Jul Aug Sep
-$50
26 Actual Budget Last YearFY2020 Revenue To Owner (000s)
COVID-19
Impact begins
$279
$179
$79
-$21 Oct Nov Dec Jan Feb Mar Apr May Jun Jul Aug Sep
Actual Budget Last Year
-$121
27FY2020 Year-End Update
% Var to
FY2020 Actuals Budget as
($ in 000’s) FY2020 Forecast FY2020 Budget % Var FY2019 Actuals % Var
as of Feb YTD of Feb
YTD
Occupancy 46.3% 78.0% -40.6% 80.1% -42.2% 77.9% 2.9%
Average Rate $ 128.26 $ 139.54 -8.1% $ 140.39 -8.6% $ 138.47 -2.9%
RevPAR $ 59.39 $ 108.86 -45.4% $ 112.50 -47.2% $ 107.93 0.0%
Total Revenues $ 3,346 $ 6,100 -45.1% $ 6,260 -46.5% $ 2,557 2.1%
Operating Expenses $ 2,400 $ 3,512 -31.7% $ 3,560 -32.6% $ 1,414 -3.9%
GOP $ 946 $ 2,587 -63.4% $ 2,700 -64.9% $ 1,143 10.6%
GOP % 28.3% 42.4% 43.1% 44.7%
Revenue To Owner $ 454 $ 2,075 -78.1% $ 2,184 -79.2% $ 917 11.6%
FY2020 forecast reflective of COVID-19 pandemic with total revenue decline of -45.1% vs FY 2020 budget, impacted by -40.6% occupancy and -5.8% rate declines
Incremental occupancy increases during the pandemic (COVID-19)
Reduction of expenses resulting in 30% additional savings
28
Hotel would have had historic cost savings in 2020, Pre COVID-19. Total revenues up $52K, GOP up $110K and Revenue to Owner up $95K vs budgetFY2020 Year-End Update
Historical STR & Market Performance
CY2017 CY2018 CY2019 CYTD May 2020
Occupancy Index 112.1% 119.2% 109.1% 113.0%
Average Rate Index 109.9% 109.5% 108.5% 107.1%
RevPAR Index 123.3% 130.6% 118.3% 121.0%
HP DFW is ranked #1 in Revenue Per Available Room (RevPAR) index vs its direct competitors
HP DFW still maintains over 100% index in all 3 metrics of Occupancy, Average Daily Rate (ADR) and Revenue Per Available Room
(RevPAR)
In spite of new supply in the market, HP DFW continues to perform well (3 Hotels opened within a five-mile radius to HP DFW)
HP DFW’s RevPAR is up $10.37 vs immediate competitive set and up $14.10 vs the Dallas market
Corporate Account Retention & New Account Activation
Continue relationships with existing accounts
Increased room nights production from new accounts (TuSimple & Aerologic Crew Business)
Effective Revenue Management
Immediate shift from primarily corporate accounts to available leisure business
Retraining of Front Desk associates to capture revenue opportunities
29FY2020 Year-End Update
COVID-19 Initiatives
COVID-19 Related Initiatives
Enhanced public area and guest room
cleaning
COVID-19 related signage throughout
Hotel and mask wearing mandate
Associate temperature checks daily
Certified Hygiene Manager
Cost Controls Pre COVID-19
Use of managers to work shifts as
needed, which helped with $31K in
labor savings (5.5%) – Fiscal through
Feb. 2020
Inventory Controls
Cost Contingency Plans
Reduction of staff by 42%
Complimentary Breakfast retooling with
focus on grab and go items (80%
savings)
30
Purchases made to critical items onlyProviding A Great Customer Experience
Guest Satisfaction Survey Results
HP-DFW NPS Hyatt Place Hotels In HP-DFW All Hyatt Properties HP-DFW
Guest Satisfaction Criteria Score Americas (324) Ranking World-Wide (888) Ranking
Customer Service 84.6 65.8 4 65.6 10
Helpfulness of Staff 85.8 72.5 18 72.5 30
Guest Room 82.8 55.8 8 54.3 18
Condition of Hotel 88.2 62.6 9 62.6 19
• HP DFW continues to perform well both against the HP brand and amongst all Hyatt Hotels world-wide
• Guest surveys were suspended from 04/03/2020 – 6/01/2020 due to COVID-19
• Scores based on rolling 12 months through July 2020
31
*Scores based on Net Promoter Score and not average percentage of responsesHyatt Place DFW Hotel Awards
OFFICIAL BEST OF AMERICA
Best Airport Hotel Texas 2020 ~ fourth consecutive year
tripadvisor
#1 Ranking
2020 CERTIFICATE of EXCELLENCE
Booking.com
Guest Review Award ~ 9.3 of 10
Hotels.com
“Loved by Guests - Most Wanted” Award
STR Market Leader
Only Hyatt Place General Manager training hotel in the Americas
32
Frequently selected beta test property for new products and initiativesFY2021 Overview
Annual Room Night Count
45,000
40,000
35,000
30,000
25,000
20,000
15,000
10,000
5,000
0
2018 2019 2020 2021
Transient Corporate Group Totals
- The FY2021 Budget was prepared using FY2020 as a baseline as trends continue to evolve
- FY2018 & FY2019 were used to show comparisons of performance during stable years
- Estimated decline in DFW outbound passenger air traffic for 2021 will affect room production
33
Data sources current and future projections: STR – competitive benchmarking and marketplace insights, CBRE reporting, Hotel Lodging Associations,
Hyatt's global data resources & DFW passenger trend and analysisFY2021 Total Revenue (000s)
$1,900
$1,600
$1,300
$1,000
$700
$400
$100
Q1 Q2 Q3 Q4
FY2021 Budget FY2020 Forecast FY2019 Actual
34FY2021 GOP (000s)
$900
$800
$700
$600
$500
$400
$300
$200
$100
$0
Q1 Q2 Q3 Q4
-$100
FY2021 Budget FY2020 Forecast FY2019 Actual
35FY2021 Revenue To Owner (000s)
$770
$570
$370
$170
-$30
Q1 Q2 Q3 Q4
-$230
FY2021 Budget FY2020 Forecast FY2019 Actual
36FY2021 Operating Budget
($ in 000’s) FY2021 Budget FY2020 Forecast % Var FY2019 Actuals % Var
Occupancy 50.1% 46.3% +8.2% 80.1% -37.1%
Average Rate $ 119.92 $ 128.26 -6.5% $ 140.39 -14.6%
RevPAR $ 58.51 $ 59.39 -1.5% $ 112.50 -46.3%
Total Revenues $ 3,233 $ 3,346 -3.4% $ 6,260 -49.2%
Operating Expenses $ 2,285 $ 2,400 -4.8% $ 3,560 -39.3%
GOP $ 948 $ 946 +0.2% $ 2,700 -62.2%
GOP % 29.3% 28.3% 43.1%
Revenue To Owner $ 412 $ 454 -9.25% $ 2,184 76.9%
Fiscal 2021 budget is reflective of current business climate and outlook later in the year for gradual ramp
Occupancy increase vs 2020 with decline in average rate mainly due to forecasted decline in Hotel’s corporate travel by 65%
GOP for the year primarily impacted by -6.5% (-$8.34) average rate decline, representing -$208K in rooms revenue loss
37
Revenue to owner in FY2020 aided by Hyatt management fee reductionFY2021 Capital Budget
HYATT PLACE DFW - Fiscal 2021 Capital Requests
Capital Requests for Approval Department Requested
IT Items Technology $ 4,000
F&B Equipment F&B $ 4,200
Rooms Department Equipment Rooms $ 5,300
Engineering Department Engineering $ 3,500
Miscellaneous Projects Owner $ 30,000
FY 2021 Total Capital Requests for Approval *1.5% of annual revenue* $ 47,000
FF&E: $1.2 million + Capital Reserve: $1.1 million = Total Available Reserves $2.3 million
38DFW Campus West
John Brookby
FY2020 Review
Sue Kunze
FY2021 Business Plan and Budgets
Sue Kunze
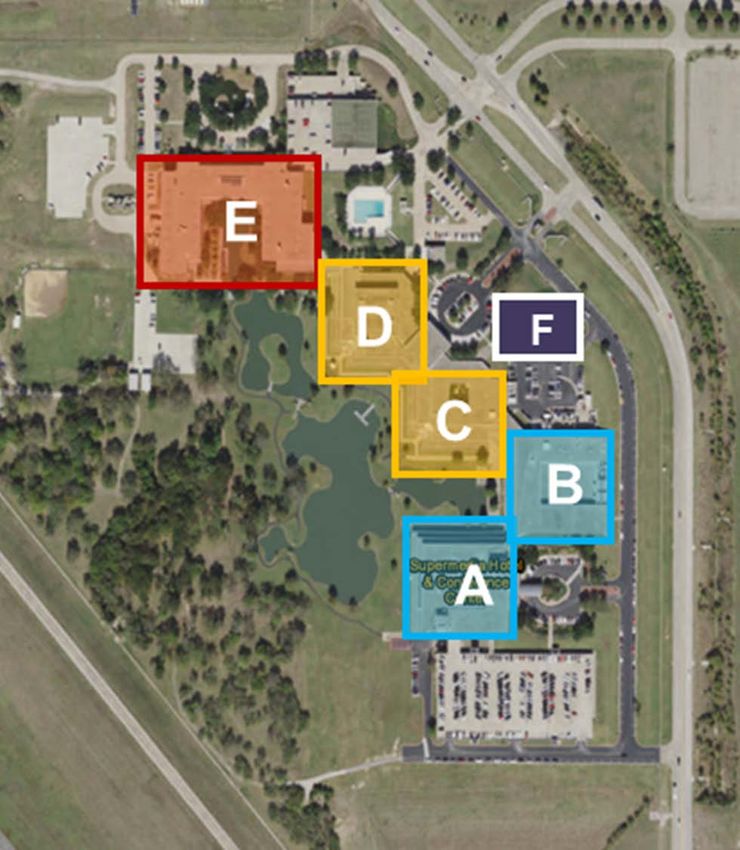
39DFW Campus West
Sue Kunze
±77.06-acre campus comprised of 645,865 sf of
office, recreation, hotel, cafeteria and meeting
space with these subtenants:
Thryv (formerly Dex) thru 12/31/2025; Five-year
renewal option
DFW ITS thru June 2025; Ten-year renewal option
Frontier Southwest Inc. thru 12/31/2026; Ten-year
renewal option
Building E has ±150,000 sf of vacant office
space. PFIC approved funds to white box
vacancy in Building E. RFP out for bid.
Preparing RFP's for both property management
and leasing for Buildings E and F
40FY2020 Year-End Update – DFW Campus West
FY2020 FY2020
Revenue and Expenses Outlook Budget Variance Variance %
Facilities Rent - Building E $ 753,814 $ 753,814 $ - 0%
Facilities Rent - Buildings A, B, C, D, F $ 5,219,516 $ 5,219,516 $ - 0%
ILEC Rent - Frontier $ 7,021 $ 7,021 $ - 0%
TOTAL REVENUE $ 5,980,351 $ 5,980,351 $ - 0%
Operating Expenses - Building E $ 1,335,356 $ 2,591,847 $ (1,256,491) -48%
Operating Expenses - Buidlings A, B, C, D, F $ 1,473,920 $ 1,480,106 $ (6,186) 0%
TOTAL OPERATING EXPENSES $ 2,809,276 $ 4,071,953 $ (1,262,677) -31%
OPERATING INCOME (before rent credits) $ 3,171,075 $ 1,908,398 $ 1,262,677 66%
Thryv Self Help $ (2,164,045) $ (5,157,064) $ 2,993,019 -58%
REVENUE TO OWNER $ 1,007,030 $ (3,248,666) $ 4,255,696 -131%
Thryv Self Help of $11M total (Verizon negotiated)
Self Help roofing project did not begin until April 2020 but Thryv spent $8M with rent credits through Nov. 2022.
Remaining Self Help rent credits (up to $3M) for retaining wall repairs, swimming pool removal and parking
garage repairs. Rent credits cannot be applied to Building E rents.
41FY2021 Operating Budget – DFW Campus West
Revenue and Expenses FY2021 FY2020
Facilities Rent - Building E $ 776,551 $ 753,814
Facilities Rent - Buildings A, B, C, D, F $ 5,257,722 $ 5,219,516
ILEC Rent - Frontier $ 7,021 $ 7,021
TOTAL REVENUE $ 6,041,294 $ 5,980,351
Operating Expenses - Building E $ 2,312,946 $ 2,591,847
Operating Expenses - Buildings A, B, C, D, F $ 1,503,938 $ 1,480,106
TOTAL OPERATING EXPENSES $ 3,816,885 $ 4,071,953
OPERATING INCOME (before rent credits) $ 2,224,410 $ 1,908,398
Thryv Self Help (Rent Credits) $ (5,236,388) $ (5,157,064)
REVENUE TO OWNER $ (3,011,978) $ (3,248,666)
Anticipates no leasing activity at Building E for the first three years of ownership (initially two
years but with COVID, leasing activity has slowed)
Does not include depreciation expenses of $530,900
Thryv Self Help of $8M spent to date (through Nov. 2022)
Rent credit for roof replacements
42FF&E Capital Requests – DFW Campus West
FY2021 Capital requests for approval Amount
Bldg E - Landscape renovations, tree removals and lighting/signage repairs $ 240,000
Bldg F - Mold remediation and repairs $ 150,000
Total FY2021 capital projects $ 390,000
Approved carry-over projects Amount
2020 - White box vacant space $ 2,327,250
2020 - Outdoor patio enhancements $ 100,000
2020 - Marketing brochures and broker functions $ 50,000
2020 - Landscape renovations and tree trimming $ 150,000
Total carry-over projects $ 2,627,250
FY2021
– Building E – Continued landscape replacements in neglected outdoor areas in preparation
for leasing activities. Will include exterior lighting for safety and directional signage.
– Building F - Mold remediation and interior/exterior waterproofing repairs.
FY2020 – With delays in obtaining management company, these approved projects were not
done. Planning for future OBA with these contracts in September/October.
43Thank You 44
You can also read