An Approach for Forecast Prediction in Data Analytics Field by Tableau Software - MECS Press
←
→
Page content transcription
If your browser does not render page correctly, please read the page content below
I.J. Information Engineering and Electronic Business, 2019, 1, 19-26
Published Online January 2019 in MECS (http://www.mecs-press.org/)
DOI: 10.5815/ijieeb.2019.01.03

      An Approach for Forecast Prediction in Data
         Analytics Field by Tableau Software
                                                  Bibhudutta Jena
                                           Email: bibhudutta93@gmail.com

                Received: 13 December 2017; Accepted: 18 October 2018; Published: 08 January 2019

Abstract—The current era is generally treated as the era     provide a frame work for parallel data processing and
of data, Users of computer are gradually increasing day      generation of analyzed results .MAPREDUCE method is
by day and vast amount of data is generated from             used for analysis of data using various data analysis
multiple domains such as healthcare- domain, Business        algorithms like clustering, fragmentation and aggregation.
related domains etc. The terminology Business                (BI) generally refers different technologies, applications
Intelligence (BI) generally refers different technologies,   and practices used for the collection, integration, analysis,
applications and practices used for the collection,          and presentation of information of business related
integration, analysis, and presentation of information of    domain[1]. The main motive for Business intelligence
business related domain. The main motive for Business        and analytics are to help in decision making process and
intelligence and analytics are to help in decision making    to enhance the profit of the organisation. Various
process and to enhance the profit of the organisation.       business related tools are used to analyze & visualize
Various business related tools are used to analyze &         different types of data which are generated frequently.
visualize different types of data which are generated        Data is one of the most important and vital aspect of
frequently. Tableau prepared its mark on the Field of BI     different activities in today's world. Now -a -days the
by being one of the first companies to permit business       modern civilization gradually more dependent on the age
customers the ability to achieve equitably arduous data      of information which is concentrated in computers, So the
visualization in a very interesting, drag and drop manner.   Society is becoming more dependent on computers and
Tableau will enhance decision making, add operational        technology for functioning in every- day life .As the
awareness, and increase performance throughout the           number of users are gradually increasing day by day, So
organization The presented paper describes different tools   the data generated by them is also enlarging
used for business intelligence field and provides a depth    gradually[2].The main aim of this paper is to describe
knowledge regarding the tableau tool. It also describes      how easily forecasting and analysis can be done by using
why tableau is widely used for data visualization purpose    this tool ,this paper has explained how easily prediction
in different organization day by day. The main aim of this   can be done through tableau by taking the dataset of a
paper is to describe how easily forecasting and analysis     superstore and predict the forthcoming sales and profit
can be done by using this tool ,this paper has explained     for the next four quarters of the forthcoming year. The
how easily prediction can be done through tableau by         reminder of this paper is organized as. Section II presents
taking the dataset of a superstore and predict the           a literature survey on various approaches and tools used
forthcoming sales and profit for the next four quarters of   for business intelligence and analysis purpose. Section III
the forthcoming year. In the collected dataset sales and     presents a brief idea about Tableau tools and its
profit details of different categories of goods are given    application. The motivation for this work is laid out in
and by using the forecasting method in tableau platform      Section II. Section IV represents the Implementation part
these two measures are calculated for the forthcoming        for the forecast analysis of sample retail store data Finally,
year and represented in a fruitful way. Finally, the paper   Section V concludes the paper.
has compared all the framework used for business
intelligence and analytics on the basis of various
parameters such as complexity, speed etc.                                     II. LITERATURE SURVEY

Index Terms—Big Data, Business Intelligence, Data               Tableau presently has the largest customer domain.
Visualization, Tableau, QlickVieew.                          When businesses organization are focusing for a BI
                                                             solution, it’s always their first choice. In the below
                                                             section the paper has described different BI tools that are
                    I. INTRODUCTION                          currently used in the business market for enhancing the
                                                             business strategy. Sisense is one of the leaders in the
  Due to the increased market competition increased data     market of BI and a winner of the Best Business
management and analysis has landed as in an era that         Intelligence Software Award given by Finances Online
requires further optimization data management and            [3][4], It was considered as one of the most adopted
analysis. Big data technologies like apache HADOOP           business, software review platforms. The users of this

Copyright © 2019 MECS                             I.J. Information Engineering and Electronic Business, 2019, 1, 19-26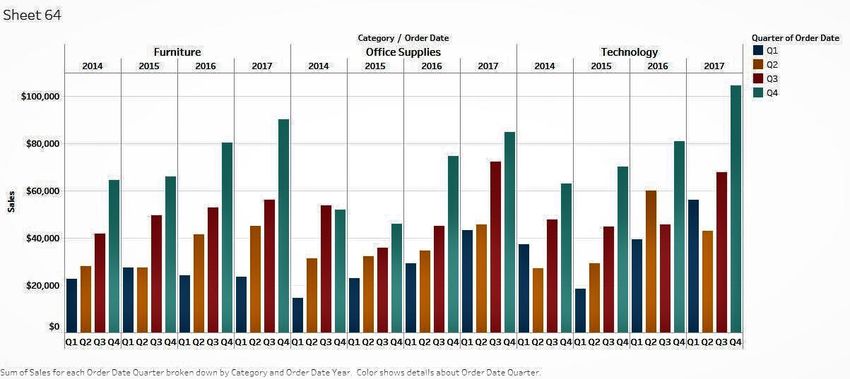
20                      An Approach for Forecast Prediction in Data Analytics Field by Tableau Software

tool will also enjoy effectively by using the in-chip            the below section the paper has described the how
technology in a database that operates the data much             smoothly the forecasting process can be done by tableau
more faste than the existing traditional systems. BIRT           tool by taking a business test case. Tableau clearly and
project is a flexible, Standalone, and 100% pure Java            beautifully visualizes your data. Tableau has the
reporting tool for creating and presenting reports in            functionality to present reports on supreme large sets of
opposition to data sources varying from typical business         data without enormously affecting network performance.
relational databases, to XML data sources, to in-memory          someone can easily go from novice to expert level with
Java objects. It is originated as a top-level project            proper assistance through this tool.
integrating with the Eclipse Foundation. Similarly icCube
is a SaaS end to end BI platform, particularly to be
ingrained in to the developed application[5][6]. It                                 IV. IMPLEMENTATION
amalgamates smoothly with any application due to on-
the-fly-authentication and authorization ability. icCube            This section describes how the data is processed in
can be treated as a dream for any software developer who         tableau platform and how forecasting can be done with
wants to present predicated dashboards or a solid web            the collected dataset. The data which are collected for
based self service BI solution, to their end-users. It is not    processing are from a sample store present in USA which
Cost effective. Business Optimization Software Domos             comprises of different attributes or fields , In the below
imports together the customers, the data, and the acumen         figure describes the excel format of data that is taken for
business users demand to present a detailed view of              processing in tableau platform. There are multiple ways
what’s happening in the organization[7][8]. The                  to import the data set in tableau software, One of the
Jaspersoft Business Intelligence Suite provides different        biggest leverage of tableau software is, it allows the user
ways for end customers to initiate interactive analysis. In      to import the data in portable document format and
the case of casual user, this might include simply               perform different data analytic operation by utilizing the
changing a filter setting on a report to present various         data. Tableau’s data virtualization is leader and shoulders
slice of data.This tool is generally helpful for data analyst    above what conventional BI vendors offer. Tableau done
to writing powerful, multi-dimensional expressions.              its mark on the world of BI by being one of the first
Microsoft also provides Business Intelligence platform           companies to give business users the propensity to
comprises of Analysis Services, Integration Services,            perform fairly complex data visualization in a very
Master Data Services, Reporting Services, and several            visceral drag and drop manner. Tableau assimilates with
client applications used for initiating or operating with        most data types and provides out of the box integration
analytical data. But this software is not able to make the       with a variety of big data platforms, comprising Hadoop.
dashboard attractive like other BI tools. This data is often     Tableau assimilates with R, the business intelligence
travelled across various databases in multiple locations         statistical language many data scientists use to dive deep
with different versions of database software. .Pentaho           into BI for statistical and advanced analytics,
platform provides an easier way for preparing and                   Tableau has a ample amount of partner and consultant
blending any data and adds a spectrum of tools to easily         base, as well as exhaustive online resources including
analyze, visualize, explore, report and predict[9]. In the       guides, online training and forums. Plus, the Tableau
above section the paper has discussed some business              community is well-known enthusiastic and engaging.,
intelligence tools which are earlier used for the business       Like most BI vendors, Tableau provides different
intelligence and business analysis processes. In the next        software licensing options. There’s a nonpaid version of
section the paper has described how tableau is helpful for       Tableau for personal use, but its scope is limited. To
business intelligence and analysis purpose which plays an        download Tableau to your desktop, you’ll pay in the
important role for decision making processes in the              range of $1000 and $2000 per year. Online or hosted
organisation.                                                    access to Tableau costs $500 per person, per year. In the
                                                                 below paragraph the paper has described some cons of
                                                                 tableau server and tool
                                                                    Hence, lot of organizations will need Tableau server.
                     III. TOOL STUDY
                                                                 Based on what companies that have considered Tableau
   Tableau prepared its mark on the Field of BI by being         (or have purchased it) tell us, an entry-level server license
one of the first companies to permit business customers          is about $1000 per user (with a 10-user minimum). If data
the ability to achieve equitably arduous data visualization      is in Excel or a CSV file format, you can upload it to
in a very interesting, drag and drop manner. Tableau’s           Tableau and perform different data analytical operations
data virtualization is head and shoulders above what             Tableau occupied its mark on the world of BI by being
traditional BI vendors offer[10]. Tableau occupied its           one of the first companies to give business customers the
mark on the world of BI by being one of the first                ability to operate fairly complex data visualization in a
companies to give business customers the ability to              very intuitive, drag and drop manner.. But, if you want to
operate fairly complex data visualization in a very              interact to a database, a developer skilled in SQL will
intuitive, drag and drop manner. In this platform                have to create the SQL query to retrieve the dataset.
visualization and analysis can be done without having               With the Tableau server, there is no term of versioning.
proper knowledge in programming domain, The output               You build your reports and dashboards through your
analyzed results can be shown in an effective manner. In         desktop and then publish them to the server. Once they’re

Copyright © 2019 MECS                                I.J. Information Engineering and Electronic Business, 2019, 1, 19-26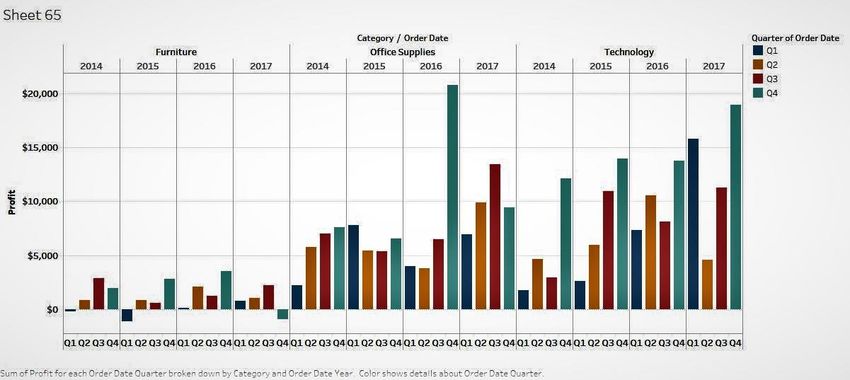
An Approach for Forecast Prediction in Data Analytics Field by Tableau Software 21
published, there’s no alternate way to retrieve previous excel format of data that is taken for processing in tableau
versions- once you overwrite there’s no pulling back platform.
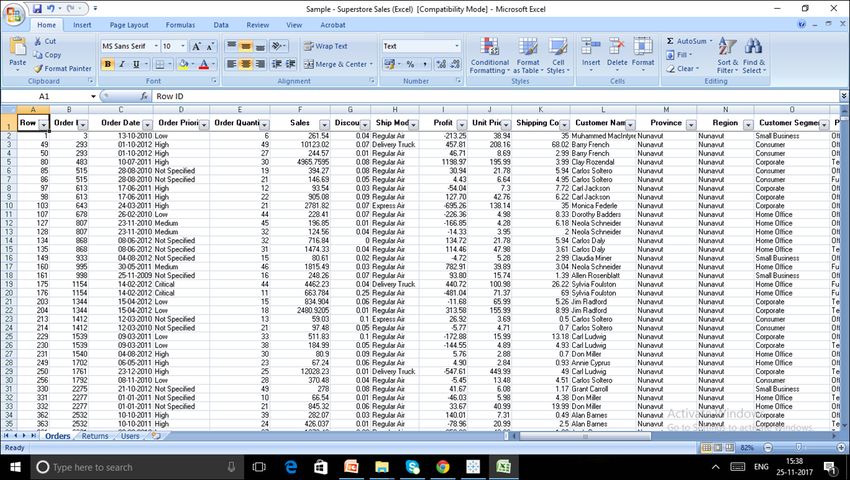
options is available. , In the below figure [1] describes the
Fig.1. Original Data source in excel sheet
The below figure [2] describes the process of importing the original data source which is present in excel format to
tableau-platform.
Fig.2. Importing data set in to tableau framework
Copyright © 2019 MECS I.J. Information Engineering and Electronic Business, 2019, 1, 19-26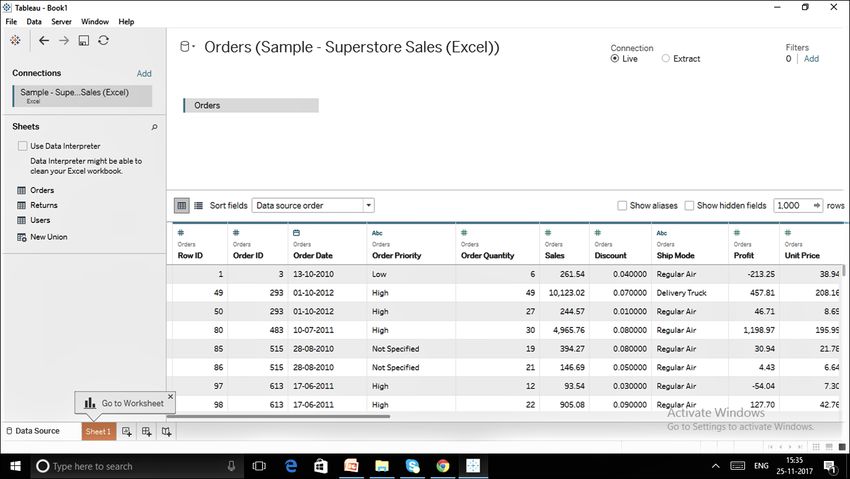
22                     An Approach for Forecast Prediction in Data Analytics Field by Tableau Software

   After successfully importing the data in to tableau              Figure [4] the paper describes the data that is present on
platform the data is divided in to two parts the numeric            the original data source ,In the original data set profit and
data are generally come in to the measure section and rest          sale information about various, categories of products are
other data come to the dimension section. This division of          present up to year 2017 and the paper has forecasted the
data is generally done by the tableau itself. The a division        profit and sale information on the forthcoming quarters of
of data in to dimension and measure section which is                2018.
done by tableau internally, In the below figure[3] and

                                          Fig.3. Profit Data Retrieve From Tableau Tool

                                            Fig 4.Sales Data retrieve from tableau tool

Copyright © 2019 MECS                                I.J. Information Engineering and Electronic Business, 2019, 1, 19-26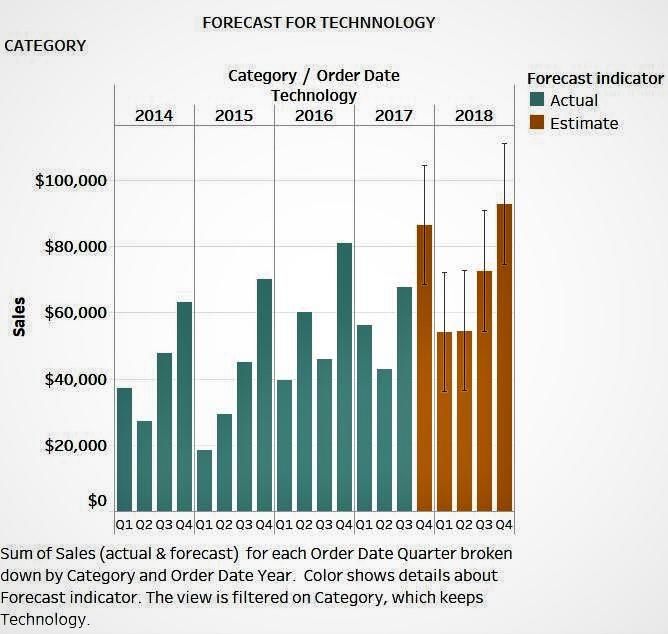
An Approach for Forecast Prediction in Data Analytics Field by Tableau Software 23
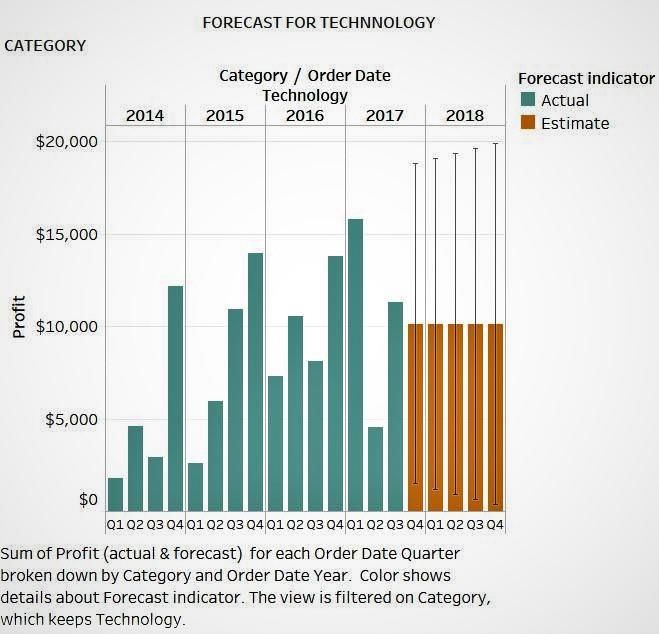
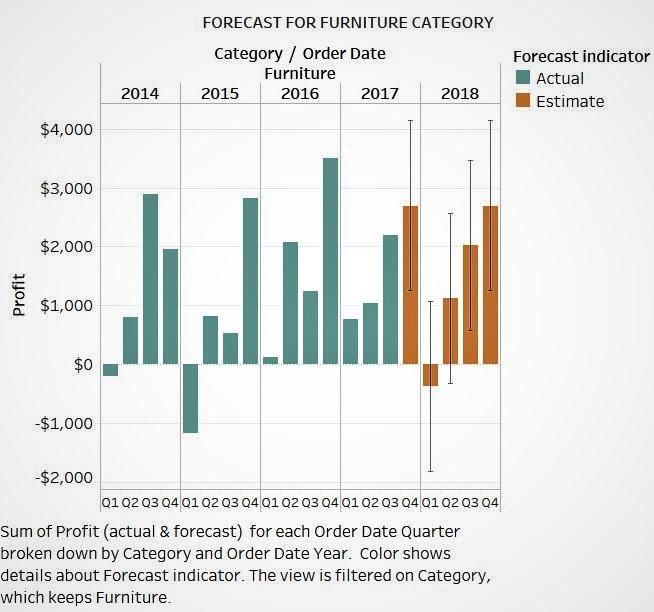
In the below section the paper has described the
estimated profit of different categories of product in
forthcoming quarters. In Figure [5] the estimated profit
for Furniture Category for forthcoming quarters are
calculated ,In similar manner Figure[ 6] provides the
estimate calculation of technology category product and
Figure [7] represents the estimated calculation Office
supplies product category, In tableau the forecast
calculation is done on the basis of import data .
Fig.7. Estimated Profit Calculation For Office Supplies Category
In the below section the paper has described the
estimated Sales of different categories of product in
forthcoming quarters. In Figure [8] the estimated sale for
Furniture Category for forthcoming quarters are
calculated ,In similar manner Figure[ 9] provides the
estimate sale calculation of technology category product
and Figure [10] represents the estimated sale calculation
of Office supplies product category, In tableau the
Fig.5. Estimated Profit Calculation For Furniture Category forecast calculation is done on the basis of currently
available sales data of different quarters. .
Fig.8. Estimated Sale Calculation For Furniture Category
Fig.6. Estimated Profit Calculation For Technology Category
Copyright © 2019 MECS I.J. Information Engineering and Electronic Business, 2019, 1, 19-26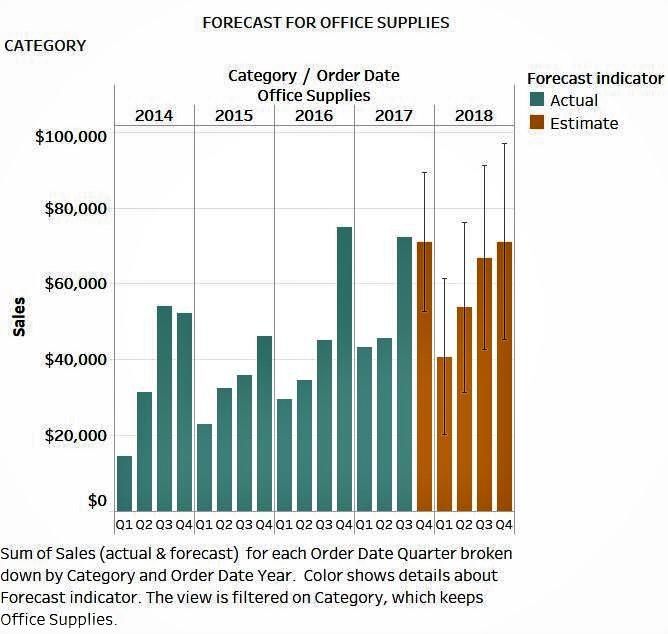
24                           An Approach for Forecast Prediction in Data Analytics Field by Tableau Software

                                                                         business intelligence field and provides a depth
                                                                         knowledge regarding the tableau tool. Data visualization
                                                                         plays an important role for the business analytics in order
                                                                         to do different operation with data. Tableau analytics is
                                                                         one of the easiest and most powerful analytics tools
                                                                         today’s era[13]. Tableau can assist to assemble sense of
                                                                         different types of data coming in from multiple sources
                                                                         and blend it into one unique platform so that everybody
                                                                         can make sense of it and utilize it[14].The Tableau
                                                                         Dashboard is an important feature of the Tableau Product
                                                                         that lets you allow to create unique data stories, It is
                                                                         constructed from the ground up for people who do not
                                                                         have any technical skills or coding experience for that
                                                                         matter. So anything can be done by anybody without any
                                                                         prior set of skills. This paper has explained the forecast
                                                                         methodologies in tableau framework and practically done
                                                                         the forecast by taking the dataset from business domain.
                                                                         There are many various types of visualization options
                                                                         available in Tableau which enhance the user experience.
                                                                         Also, Tableau is very easy to learn compared to Python,
                                                                         Business Objects and Domo, anyone without having
       Fig.9. Estimated Sale Calculation For Technology Category
                                                                         knowledge of coding can easily learn Tableau. Tableau
                                                                         can operate millions of rows of data with ease. Various
                                                                         types of visualization can be initiated with a huge amount
                                                                         of data without impacting the performance of the
                                                                         dashboards. Also, there is an option available in Tableau
                                                                         where the user can make and can “live” to connections to
                                                                         different data sources like SQL etc and can perform
                                                                         multiple data manipulation operation [16] with the live
                                                                         data. Tableau Dashboard has a marvellous reporting
                                                                         feature that allows you to create personalize dashboard
                                                                         specifically for a convinced device such as a mobile
                                                                         phone or laptop. Tableau automatically figure out which
                                                                         device is the user is viewing the report on and do
                                                                         adjustments to ensure that the right report is delivered to
                                                                         the right device.
                                                                            Tableau has done a great job climb its way to the top of
                                                                         data visualization tools. So, Tableau has spent more than
                                                                         six years as a leader. However, with the increasing
                                                                         interest in data science, artificial intelligence, and
                                                                         machine learning, Tableau may be left behind if it doesn’t
                                                                         innovate quickly. Tableau does not support the aspect of
                                                                         automatic exhilarating of the reports with the help of
     Fig.10. Estimated Sale Calculation For Office Supplies Category     scheduling. There is no other choice of scheduling in
                                                                         Tableau. Therefore, there is always some manual effort
                                                                         required when users need to update the data in the back-
                                                                         end. Tableau is not entirely an open tool. Just like other
                          V. CONCLUSION                                  tools like Power BI, developers can create custom visuals
                                                                         that can be easily imported Tableau. So, any new visuals
   Due to the increased market competition and increased                 need to be recreated instead of imported. Tableau’s
data management an era has reached that needs more                       parameters are constant and always unique value can be
optimization technique to analysis the data. Big data                    preferred using a parameter. Whenever the data gets
technologies such as HADOOP proposes a framework for                     changed, these parameters need to be updated manually
processing the data parallel y and after processing the                  every time.
data different visualization tools are used for representing
the analyzed result in an effective manner which plays an
important for decision making process in different
                                                                                            VI. FUTURE SCOPE
business organizations[11]. Tableau will enhance
decision making, add operational awareness, and increase                   Tableau is strictly a visualization tool. Tableau
performance throughout the organization[12]. The                         Desktop only permits you to perform very basic
presented paper describes different tools used for                       preprocessing, Which includes joining and blending

Copyright © 2019 MECS                                         I.J. Information Engineering and Electronic Business, 2019, 1, 19-26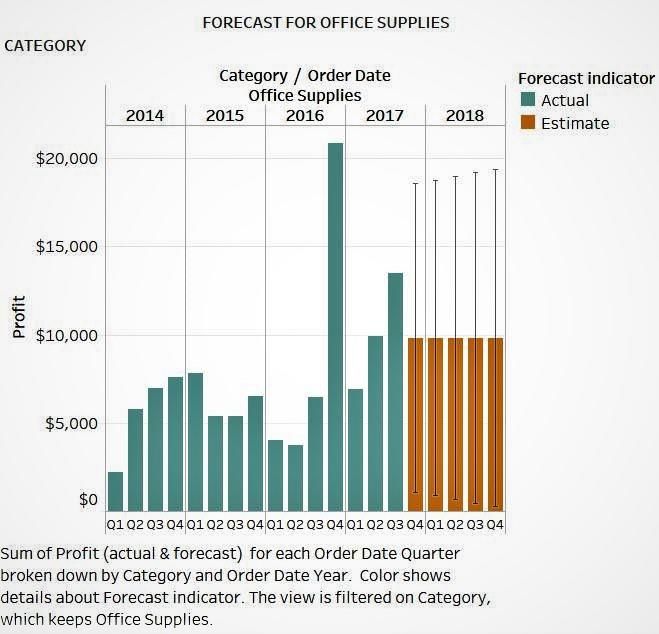
An Approach for Forecast Prediction in Data Analytics Field by Tableau Software                      25

data[17]. Also, you have the competence to change data            [12] Ziv J., Lempel A., “A Universal Algorithm for Sequential
types. In an ideal world, most data would be exported in               Data Compression,” IEEE Transactions on Information
perfect tables. However, data cleansing is a necessary                 Theory, Vol. 23, No. 3, pp. 337-343.
step. In most cases, an analyst needs to build a data model       [13] N.E. Ayat, M. Cheriet, C.Y. Suen ,“Automatic model
                                                                       selection for the optimization of SVM kernels,” Artificial
with reappearing to format the data. This needs a tool                 intelligence in medicine, vol. 38, no.10, pp. 1733-1745,
such as Altyrex, Power BI, Python or even Excel to                     2005.
operate data prior to loading[18]. In 2018, introduced            [14] Hamid Bagheri , Abdusalam Abdullah Shaltooki., " Big
their own data preparation tool called Tableau Prep,                   Data: Challenges, Opportunities and Cloud Based
Different researches are going on for optimizing the                   Solutions", International Journal of Electrical and
execution time and reduce the elapsed time for                         Computer Engineering (IJECE),2015.
performing data analytics operation in tableau platform.          [15] Sabyasachi Chakraborty, Kashyap Barua, Manjusha
                                                                       Pandey, Siddharth Rautaray," A Proposal for High
                                                                       Availability of HDFS Architecture based on Threshold
                        REFERENCES
                                                                       Limit and Saturation Limit of the Namenode",
[1]  Raghupathi W: Data Mining in Health Care. In Healthcare           International Journal of Information Engineering and
     Informatics: Improving Efficiency and Productivity.               Electronic Business(IJIEEB), Vol.9, No.6, pp. 27-34,
     Edited by Kudyba S. Taylor & Francis; 2010:211–223.               2017. DOI: 10.5815/ijieeb.2017.06.04.
[2] B. Jena, M. K. Gourisaria, S. S. Rautaray, and M. Pandey,     [16] Mayank Bhushan , Monica Singh , Sumit K Yadav ,"
     \A surveywork on optimization techniques utilizing map            Big Data query optimization by using Locality Sensitive
     reduce framework in hadoop cluster," International                Bloom Filter ",IJCT, 2015.
     Journal of Intelligent Systems and Appli- cations, vol. 9,   [17] Liu, Yunxiang, and Jiongjun Du. "Parameter Optimization
     no. 4, p. 61, 2017.                                               of the SVM for Big Data", 2015 8th International
[3] B. Jena, M. K. Gourisaria, S. S. Rautaray and M. Pandey,           Symposium on Computational Intelligence and Design
     "Name node performance enlarging by aggregator based              (ISCID), 2015.
     HADOOP framework," 2017 International Conference on          [18] Lanchao Liu and Zhu Han , " Multi-Block ADMM for
     I-SMAC (IoT in Social, Mobile, Analytics and Cloud) (I-           Big Data Optimization in Smart Grid " , IEEE, 2015.
     SMAC), Palladam, 2017, pp. 112-116.                          [19] Al-Madi, Nailah, Ibrahim Aljarah, and Simone A. Ludwig.
[4] B. Jena, M. K. Gourisaria, S. S. Rautaray and M. Pandey,           "Parallel glowworm swarm optimization clustering
     "Improvising name node performance by aggregator aided            algorithm based on MapReduce", 2014 IEEE Symposium
     HADOOP framework," 2016 International Conference on               on Swarm Intelligence, 2014.
     Control,      Instrumentation,     Communication     and     [20] A. Ramaprasath, K. Hariharan, A. Srinivasan, “Cache
     Computational Technologies (ICCICCT), Kumaracoil,                 Coherency Algorithm to Optimize Bandwidth in Mobile
     2016, pp. 382-388.                                                Networks”, Springer Verlag, Lecture Notes in Electrical
[5] Nagesh HR, Guru Prasad “High Performance                           Engineering, Networks and Communications, Chapter 24,
     Computation of Big Data: Performance Optimization                 Volume 284, 2014, pp 297-305.
     Approach towards a Parallel Frequent Item Set Mining         [21] Ziv J., Lempel A., “A Universal Algorithm for Sequential
     Algorithm for Transaction Data based on Hadoop                    Data Compression,” IEEE Transactions on Information
     MapReduce Framework” International Journal of                     Theory, Vol. 23, No. 3, pp. 337-343
     Intelligent Systems and Applications(IJISA), Vol.9, No.1,    [22] E. Yildirim, J. Kim, and T. Kosar, “Optimizing the sample
     pp.75-84, 2017. DOI: 10.5815/ijisa.2017.01.08.                    size for a cloud-hosted data scheduling service,” in Proc.
[6] Siddharth S Rautaray, and Manjusha Pandey, “Single and             2nd Int. Workshop Cloud Computing. Sci. Appl., 2012.
     Multiple Hand Gesture Recognition Systems: A                 [23] Anitha P, Malini M. Patil," A Review on Data Analytics
     Comparative Analysis”, I.J. Intelligent Systems and               for Supply Chain Management: A Case study",
     Applications, 6 (11), 57-65, 2014.                                International Journal of Information Engineering and
[7] Rath       Jairak,    Prasong     Praneetpolgrang,   Nivet         Electronic Business(IJIEEB), Vol.10, No.5, pp. 30-39,
     Chirawichitchai,"A Roadmap for Establishing Trust                 2018. DOI: 10.5815/ijieeb.2018.05.05
     Management Strategy in E-Commerce Services Using             [24] Abdus Satter, Nabil Ibtehaz," A Regression based Sensor
     Quality Based Assessment", IJIEEB, vol.6, no.5, pp.1-9,           Data Prediction Technique to Analyze Data
     2014. DOI: 10.5815/ijieeb.2014.05.01.                             Trustworthiness in Cyber-Physical System", International
[8] Jeffrey Dean and Sanjay Ghemawat , " Map Reduce:                   Journal of Information Engineering and Electronic
     Simplified Data Processing on Large Clusters", IEEE               Business(IJIEEB), Vol.10, No.3, pp. 15-22, 2018. DOI:
     Micro, 23(2):2228, April 2005.                                    10.5815/ijieeb.2018.03.03
[9] Esma Yildirim, Engin Arslan, Jangyoung Kim, Tevfik
     Kosar. "Application-Level Optimization of Big Data
     Transfers      through    Pipelining,   Parallelism   and
     Concurrency", IEEE Transactions on Cloud Computing,          Author’s Profile
     2016
[10] J. Archenaa, E.A. Mary Anita,” A Survey of Big Data                             Bibhudutta Jena, is a CSI Accredited
     Analytics in Healthcare and Government”, Procedia                               Student. Completed M. Tech (Computer
     Computer Science, Elsevier, Volume 50, 2015, Pages                              Science and Engineering) at the School of
     408–413,Big Data, Cloud .                                                       Computer Engineering, KIIT University,
[11] Gunjan Varshney1, D. S. Chauhan2, M. P. Dave,”                                  Bhubaneswar. His areas of interest Data
     Evaluation of Power Quality Issues in Grid Connected PV                         Analytics ,Data mining,Data visualization
     Systems”, International Journal of Electrical and                               etc .He has already published more than
     Computer Engineering (IJECE), Vol. 6, No. 4, August                             10 research papers in big data and
     2016, pp. 1412~1420.                                         analytics domain,He is currently pursuing as an software

Copyright © 2019 MECS                                 I.J. Information Engineering and Electronic Business, 2019, 1, 19-26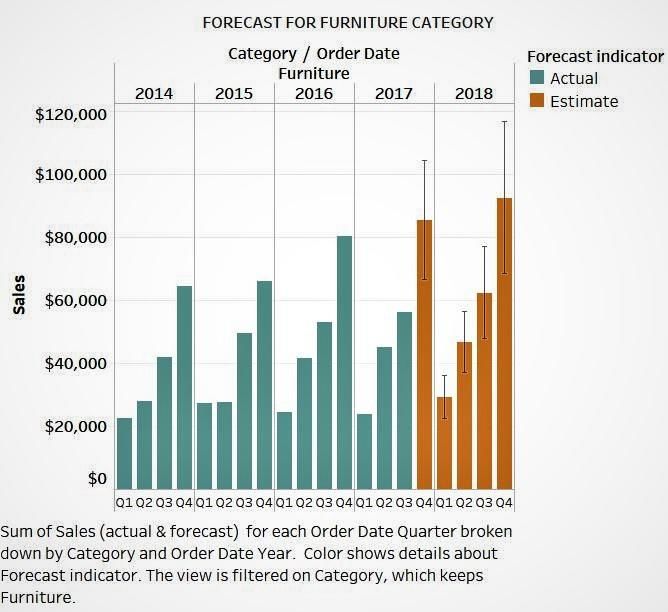
26                    An Approach for Forecast Prediction in Data Analytics Field by Tableau Software

engineer in MPHASIS Limited. He can be reached at
bibhudutta93@gmail.com.

How to cite this paper: Bibhudutta Jena, "An Approach for Forecast Prediction in Data Analytics Field by Tableau
Software", International Journal of Information Engineering and Electronic Business(IJIEEB), Vol.11, No.1, pp. 19-26,
2019. DOI: 10.5815/ijieeb.2019.01.03

Copyright © 2019 MECS                              I.J. Information Engineering and Electronic Business, 2019, 1, 19-26
You can also read