Frasers Centrepoint Trust - Investor Presentation for Citi-SGX-REITAS REITS / Sponsors Forum 2021 to be held virtually, from 25 August 2021 to 27 ...
←
→
Page content transcription
If your browser does not render page correctly, please read the page content below

Frasers Centrepoint Trust
                                       Investor Presentation for
Citi-SGX-REITAS REITS / Sponsors Forum 2021 to be held virtually, from 25 August 2021 to 27 August 2021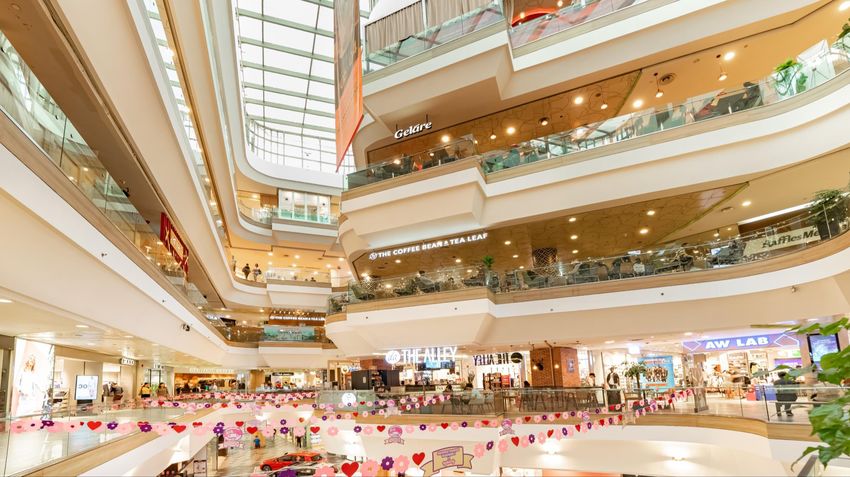
•   Certain statements in this Presentation constitute “forward-looking statements”, including forward-looking financial information. Such forward-looking statement and financial information involve known
    and unknown risks, uncertainties and other factors which may cause the actual results, performance or achievements of FCT or the Manager, or industry results, to be materially different from any
    future results, performance or achievements expressed or implied by such forward-looking statements and financial information. Such forward-looking statements and financial information are based
    on numerous assumptions regarding the Manager’s present and future business strategies and the environment in which FCT or the Manager will operate in the future. Because these statements and
    financial information reflect the Manager’s current views concerning future events, these statements and financial information necessarily involve risks, uncertainties and assumptions. Actual future
    performance could differ materially from these forward-looking statements and financial information.
•   The Manager expressly disclaims any obligation or undertaking to release publicly any updates or revisions to any forward-looking statement or financial information contained in this Presentation to
    reflect any change in the Manager’s expectations with regard thereto or any change in events, conditions or circumstances on which any such statement or information is based, subject to compliance
    with all applicable laws and regulations and/or the rules of the SGX-ST and/or any other regulatory or supervisory body or agency. The value of Units in FCT and the income derived from them may
    fall as well as rise. The Units in FCT are not obligations of, deposits in, or guaranteed by, the Manager or any of their affiliates. An investment in the Units in FCT is subject to investment risks,
    including the possible loss of the principal amount invested. Unitholders of FCT should note that they have no right to request the Manager to redeem their Units while the Units are listed. It is intended
    that Unitholders of FCT may only deal in their Units through trading on the SGX-ST. Listing of the Units on the SGX-ST does not guarantee a liquid market for the Units.
•   This Presentation contains certain information with respect to the trade sectors of FCT’s tenants. The Manager has determined the trade sectors in which FCT’s tenants are primarily involved based
    on the Manager’s general understanding of the business activities conducted by such tenants. The Manager’s knowledge of the business activities of FCT’s tenants is necessarily limited and such
    tenants may conduct business activities that are in addition to, or different from, those shown herein.
•   This Presentation is for information only and does not constitute an invitation or offer to acquire, purchase or subscribe for any securities of FCT. The past performance of FCT and the Manager is not
    necessarily indicative of the future performance of FCT and the Manager.
•   This Presentation includes market and industry data and forecast that have been obtained from internal survey, reports and studies, where appropriate, as well as market research, publicly available
    information and industry publications. Industry publications, surveys and forecasts generally state that the information they contain has been obtained from sources believed to be reliable, but there
    can be no assurance as to the accuracy or completeness of such included information. While the Manager has taken reasonable steps to ensure that the information is extracted accurately and in its
    proper context, the Manager has not independently verified any of the data from third party sources or ascertained the underlying economic assumptions relied upon therein.
•   This advertisement has not been reviewed by the Monetary Authority of Singapore.

                                                                                                                                                                                                              2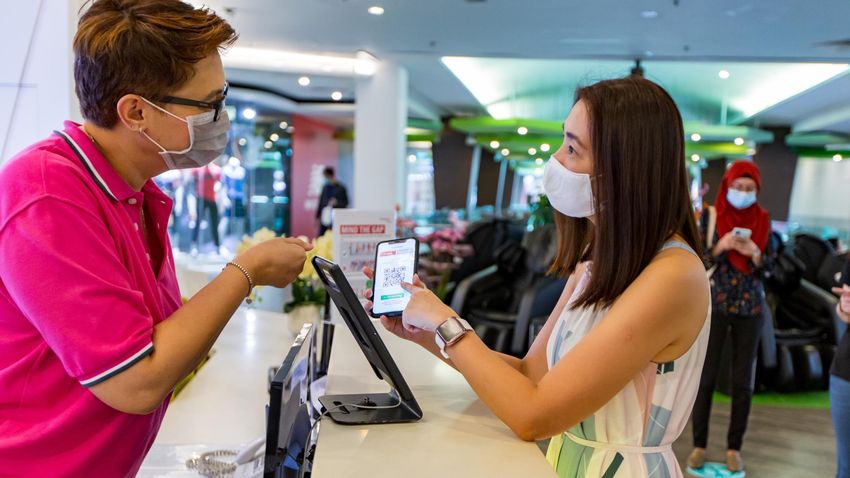
◆      Among the top-10 largest Singapore REITs (SREITs) by market capitalisation1
     ◆      Included in key indices: FTSE EPRA/NAREIT Global Real Estate Index (Global Developed Index);
            FTSE ST REIT Index; MSCI Singapore Small Cap Index
     ◆      Pure play on Singapore suburban retail sector
     ◆      Acquisition of the AsiaRetail Fund portfolio in 2020 propelled FCT to become one of Singapore’s
            largest suburban retail landlords
     ◆      Current portfolio comprises nine quality retail malls focused on providing Essential Services to
            mainly domestic catchment
     ◆      Suburban malls were among the first to benefit from recovery as Singapore exited the Circuit
            Breaker in early June 2020 – FCT saw its tenants’ sales recovering to pre-COVID levels soon after
            Phase 1 and Phase 2 reopening

1.   Based on FCT’s closing price of $2.42 on 31 July 2021, market capitalisation was approximately $4.1 billion

                                                                                                                   3
◆   Current Singapore retail portfolio
    comprises 9 quality suburban retail
    malls
◆   Portfolio net lettable area of
    approximately 2.2 million square feet
                                                             Causeway Point (NLA: 419,626 sq ft)   Northpoint City NW* (NLA: 229,870 sq ft) Waterway Point (NLA: 388,241 sq ft)
    with more than 1,400 leases
◆   Total assets under management of
    approximately $6.2 billion

                                                             Tampines 1 (NLA: 268,504 sq ft)       Century Square (NLA: 211,283 sq ft)     Changi City Point (NLA: 208,399 sq ft)

Net lettable area (NLA) shown for the malls includes area
for the Community/Sports Facilities Scheme (CSFS). NLA
as at 30 June 2021                                          Tiong Bahru Plaza (NLA: 214,708 sq ft) White Sands (NLA: 150,375 sq ft)        Hougang Mall (NLA: 165,615 sq ft)

                                                                                                                                                                                  4
Large catchment
                                                                                                                                               Our portfolio serves a combined 2.6 million1
                                                                                                                                               catchment population

                                                                                                                                                 Connection to public transport
                                                                                                                                                 All our malls are well-located on or next to MRT
                                                                                                                                                 stations and enjoy healthy occupancy and high
                                                                                                                                                 recurring shopper traffic

                                                                                                                                               Sustainable relevance
                                                                                                                                               Proximity to homes and transport amenities makes
                                                                                                                                               our malls ideal “last-mile” fulfilment hubs, especially
                                                                                                                                               with trend of “work-from-home”

1. Aggregate catchment population within 3km of each property in the portfolio. Population in overlapping areas are only counted once. Source: Cistri, 2021
                                                                                                                                                                                                     5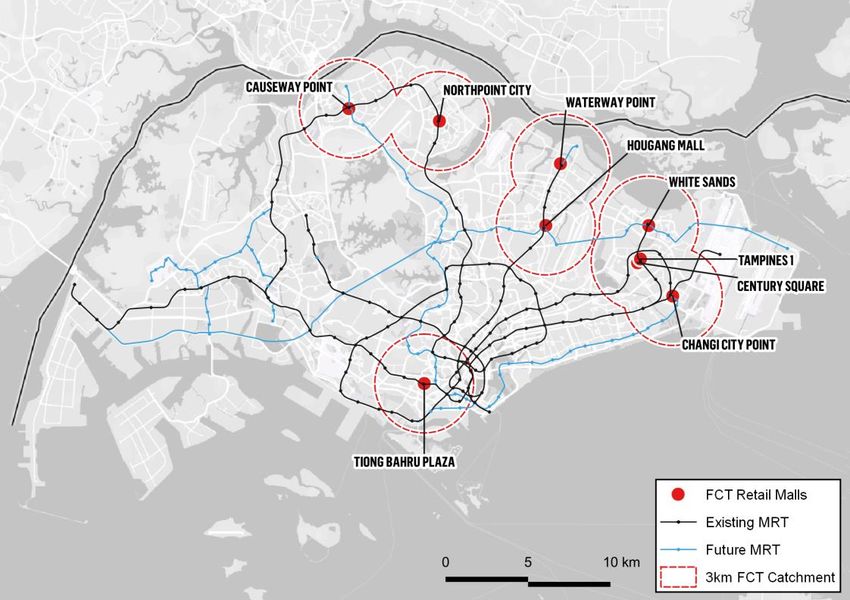
Portfolio overview

            Proportion of Nett Lettable Area allocated To                                                                       FCT Retail Portfolio3
            Essential Services1 (%)                                                                                             Essential Services1 by Gross Rental Income

        •    Suburban retail malls generally have higher proportion of NLA
             allocated to Essential Services than central malls

                                                              FCT Retail Portfolio3:
                                                              44.7%                                                      Non-essential Services
                                                                                                                                 45.6%
          Suburban
                                       40.0%                                   60.0%
         Retail Malls 2
                                                                                                                                                                                                             Essential Services
                                                                                                                                                                                                                    54.4%

                         2
       Central Malls         20.0 - 30.0%                           70.0 – 80.0%

                        % of Essential Services             % of Non Essential Services

1.   The groupings of essential and non-essential services are based on Ministry of Trade and Industry’s press release on 21 April 2020. Note that the individual product group may not align perfectly to the announced Essential Services
2.   Source: Cistri
3.   Based on the FCT’s current retail portfolio
4.   Not all trades in the Beauty & Health trades are included, only certain trades such as pharmacy are included
                                                                                                                                                                                                                                              6
• As of 22 August 2021, 78% of our population has completed their full regimen/ received two doses of COVID-19 vaccines,
  and 82% has received at least one dose1

                   2

                                                                                                           2

  1 Source: https://www.moh.gov.sg/news-highlights/details/update-on-local-covid-19-situation-and-vaccination-progress_23_August_2021
  2 Source: www.gov.sg, for more details, refer to https://www.gov.sg/article/updates-to-p2ha-from-10-august-2021
                                                                                                                                        7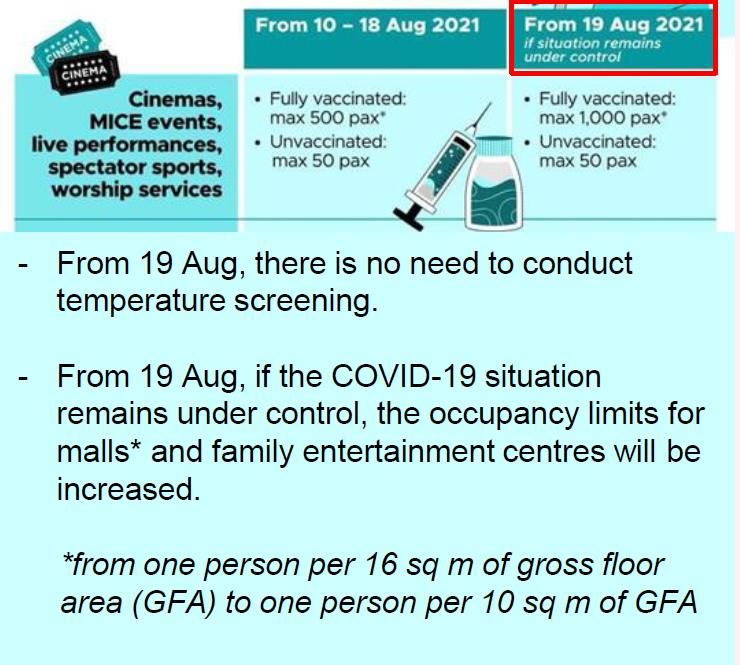
Frasers Property Retail’s tenant support

                                                    •    Targeted assistance for tenants adversely affected by the COVID-19
                                                         measures. Includes rental and operational support in a targeted
                                                         manner

                                                    •    Free delivery for both tenants and customers for orders placed
                                                         through Frasers Makan Master

                                                    •    30-minute grace period for all vehicles across all malls of Frasers
                                                         Property

                                                    •    Complementary listing for new retail tenants on Frasers eStore and
                                                         waiver of all delivery and service fee for all tenants onboard Frasers
                                                         eStore

                                                    •    Additional advertising and promotional support will also be provided
                                                         for affected tenants

  Source: https://www.frasersproperty.com/sg/home/frasers-singapore/essentials/shared/dataitems/press-releases/2021/may/frasers-property-
  retail-reinforces-support-and-safety-measures-f
                                                                                                                                            8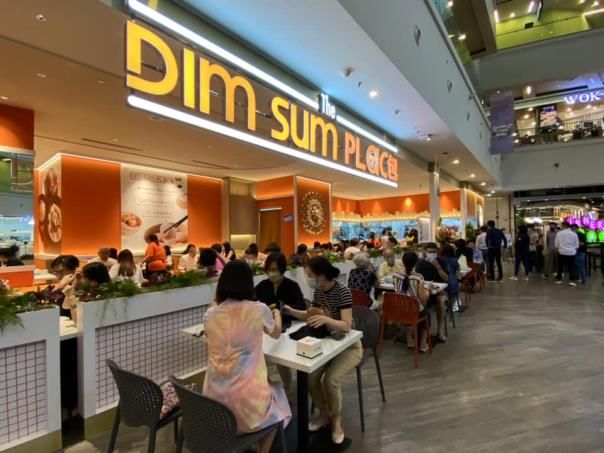
Highlights in 3Q21
(with recent updates)

                        Northpoint City, Singapore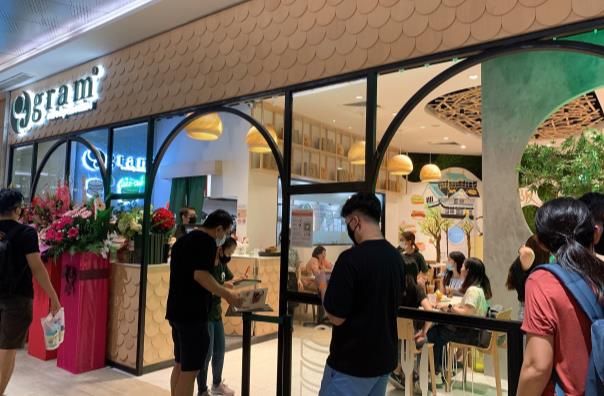
◆    FCT retail portfolio occupancy as at 30 June 2021 stable at 96.4%1
◆    Shopper traffic up to July 2021 remains stable at around 60% of pre-COVID average level
◆    Portfolio tenants’ sales for July 2021 recovered to about 91% of pre-COVID level, up from 81% in June 2021
◆    Leases expiring in FY2021 had been substantially de-risked, with only 8% remaining to renew in 4Q21
◆    Gearing level at 33.9% as at 30 June 2021, strong financial position with ample debt headroom to support
     future growth

1.   Including committed leases
                                                                                                                  10
y-o-y variance normalising after the surge in April and May due to low base effect
YoY change in Retail Sales value (ex auto) versus FCT tenants' sales
Retail sales value FCT Portfolio tenants' sales
140.0%
120.0%
100.0%
80.0%
y-o-y 60.0%
change 40.0%
20.0%
0.0%
-20.0%
-40.0%
-60.0%
-80.0%
Jan Feb Mar Apr May
Jun Jul Aug Sep Oct Nov Dec Jan Feb Mar Apr May Jun
2020 2021
Retail sales value -0.6% -9.6% -9.9% -31.6%-44.2%-23.7% -7.9% -8.6% -12.6%-11.2% -2.7% -4.3% -9.3% 8.5% 4.5% 38.7% 61.4% 18.7%
FCT Portfolio tenants' sales -0.9% -3.1% -6.0% -45.2%-58.7%-30.4% 0.1% -1.0% -4.8% -1.4% 2.9% -0.1% 0.7% 12.4% 6.1% 81.7%115.2%20.9%
1. Retail Sales value (ex auto) from Singapore Department of Statistics, 23 August 2021.
2. FCT’s portfolio tenants’ sales adjusted to exclude Bedok Point, Anchorpoint and YewTee Point, which have been divested.
11MTI Upgrades 2021 GDP Growth Forecast to “6.0 to 7.0 Per Cent”
Chart 1: Average prime retail rents by submarkets
S$ per square (CBRE)
The Ministry of Trade and Industry (MTI) foot /month
upgraded Singapore’s GDP growth forecast for Orchard Prime Suburban Prime
40.00 34.55
2021 to “6.0 to 7.0 per cent”, from “4.0 to 6.0
per cent” – MTI, 11 August 2021 35.00
30.00
The average prime rent in the suburban
25.00
markets has remained stable (Chart 1)1 29.80
20.00
Singapore’s future retail supply remains low. Q1 Q2 Q3 Q4 Q1 Q2 Q3 Q4 Q1 Q2
2019 2020 2021
The expected aggregate new supply to the
retail market is about 1.73 mil sq. ft. from Q3 Table 2: Estimated Gross New Supply*
2021 to 2024, equivalent to about 0.43 mil sq.
Year Estimated NLA (sq. ft)*
ft. of retail space per annum during this period.
In comparison, completions for the past five 4Q 2021 0.29 million sq ft
years (2016-2020) averaged at 1.11 mil sq. ft. 2022 0.33 million sq ft
of retail space per year.1
2023 0.41 million sq ft
2024 0.68 million sq ft
1. Source: CBRE Singapore Real Estate Market Report, Q2 2021
*excludes projects with a NLA of less than 20,000 sq. ft.
12Financial position
Tampines 1, Singapore30 Jun 2021 30 Jun 2020
Debt maturity profile as at 30 June 2021
Average debt maturity 2.8 years 2.3 years
Gearing level1 33.9% 35.0% $518.0m $522.0m
(27.8% of total (28.0% of total
YTD Interest Cover (times) 5.2 times 4.7 times borrowing) borrowing)
% of debt hedged to fixed rate 59% 60% 70.0
$391.0m
(21.0% of total
YTD Avg cost of debt (all-in) 2.2% 2.5% borrowing)
Credit rating (S&P) BBB/Stable
Credit rating (Moody’s) Baa2/Stable 399.0
$210.5m 200.0
(11.3% of total
Type of borrowings Aggregate amount borrowing) 452.0 $120.0m
■ MTN and EMTN $300.0 million (16.1%) 30.0 (6.4% of total $104.0m
■ Unsecured bank borrowings $534.0 million (28.6%) borrowing) (5.5% of total
borrowing)
■ Secured bank borrowings $1,031.5 million (55.3%) 180.5 191.0
Total borrowings $1,865.5 million (100.0%) 119.0 120.0 104.0
Undrawn RCFs $773 million
-
FY2022 FY2023 FY2024 FY2025 FY2026 FY2027
Any discrepancy between individual amount and the aggregate is due to rounding.
1. In accordance with the Property Funds Appendix, the gearing ratio included FCT’s 40% proportionate share of deposited property value and borrowing in SST
14Portfolio update
Waterway Point
Waterway Point, Singapore• Portfolio maintained at a healthy occupancy level despite COVID-19 disruptions
• Quality suburban retail spaces remain in demand by retailers
• Mall performance driven by proactive leasing strategy which focuses on both tenant retention and refresh
of retail offering
1. Include committed leases. 31 March 2021 portfolio occupancy adjusted to exclude YewTee Point which has been divested on 28 May 2021
16FCT Portfolio Shopper Traffic Trend FCT Portfolio Tenants' Sales Trend
(as percentage of FY2019 monthly average level (as percentage of FY2019 monthly average level
(pre-COVID)) (pre-COVID))
Pre-COVID average 2020 2021 Pre-COVID average 2020 2021
140% 140%
120% 120%
91%
100% 100%
81%
80% 60% 80%
53%
60% 60%
40% 40%
20% 20%
0% 0%
Jan Feb Mar Apr May Jun Jul Aug Sep Oct Nov Dec Jan Feb Mar Apr May Jun Jul Aug Sep Oct Nov Dec
17◆ WALE as at 30 June 2021 stands at 1.62 years by NLA (2Q21: 1.54 years) and 1.63 years by GRI (2Q21: 1.53 years)
Lease expiry profile as % of Total GRI
■ Expiries as at 30 September 2020
■ Expiries as at 30 June 2021
Lease expiry1,2,3 as at FY2026
FY2021 FY2022 FY2023 FY2024 FY2025 Total
30 June 2021 and Beyond
Number of leases expiring 130 542 371 383 24 6 1,456
Leased area expiring (sq ft) 177,168 798,461 516,966 488,784 55,808 73,828 2,111,015
Expiries as % of total leased
8.4% 37.8% 24.5% 23.2% 2.6% 3.5% 100.0%
area
Expiries as % of GRI 8.2% 35.2% 26.2% 26.1% 2.1% 2.2% 100.0%
1. Calculations exclude vacant floor area
2. Based on committed leases for expiries as at 30 June 2021. Excludes Central Plaza (Office)
3. Following the completion of Anchorpoint’s and Yew Tee Point’s divestment, calculation of lease expiry profile and WALE for both periods stated above have been adjusted accordingly 18Lease Expiries1,2 in FY2021 Number of leases Lease area expiring as % of leased as % of total GRI
(As at 30 June 2021) expiring (sq ft) area of property of property
Causeway Point 21 47,032 11.4% 10.7%
Northpoint City North Wing3 4 11,862 5.2% 2.6%
Changi City Point 7 6,977 3.6% 2.1%
Waterway Point 6 9,777 2.8% 2.9%
Tampines 1 12 9,380 3.5% 5.4%
Tiong Bahru Plaza 16 13,540 6.5% 7.4%
Century Square 40 35,748 19.3% 24.2%
Hougang Mall 12 32,126 21.9% 15.8%
Whitesands 12 10,726 8.7% 10.3%
FCT Retail Portfolio 130 177,168 8.4% 8.2%
Central Plaza 0 0 0.0% 0.0%
FCT Portfolio 130 177,168 7.9% 8.0%
1. Calculations exclude vacant floor area
2. Based on committed leases for expiries as at 30 June 2021
3. Includes Yishun 10 Retail Podium
19New Additions
At Tea – Popular Taiwanese bubble tea chain’s first outlet in SG at Tiong Bahru Plaza Gram Café – Famous Osaka pancakes café opened at Waterway Point
Playdress – One of SG’s leading omnichannel fashion brands at Tampines 1 Dim Sum Place – Authentic halal-certified Cantonese cuisine at Changi City Point
Note: The above reflects only a portion of the tenants that have commenced trading or are expected to commence trading in FY2021 20New Additions
Total committed spaces represent over 75% of NLA vacated by H&M
*
Level 1 Level 2
Note: Above illustrations are not to scale
* Toys”R”Us to relocate from its current B1 unit to Level 2 21Summary
Going forward in the new normal

   Positive macro-economic conditions with improved GDP growth outlook, stable suburban rent and low future
   retail supply.
   FCT’s performance remained resilient and financial position remained strong with gearing at 33.9%
   Resilient portfolio performance above general market through the various phases of control measures, well-
   positioned to ride the re-opening of the economy
   Both shopper traffic and tenants’ sales recovering in July 2021 with the progressive easing of the safe
   distancing measures by the government. Further easing of the measures bodes well for retail and will further
   support FCT’s portfolio performance
   Staying agile in the “New Normal” -Consolidate, Adapt and Grow
   The Manager will explore AEI opportunities within the portfolio for organic growth and look out for inorganic
   growth opportunities for FCT

                                                                                                                   23
Appendix
25◆ 3Q21: Third Quarter 2021 ended 30 June 2021 ◆ NPI: Net Property Income
◆ 3Q20: Third quarter 2020 ended 30 June 2020 ◆ NTA: Net Tangible Value
◆ 4Q21: Fourth quarter 2021 ending 30 September 2021 ◆ Phase 2 (HA): Phase 2 (Heightened Alert)
◆ AEI: Asset Enhancement Initiative ◆ Phase 3 (HA): Phase 3 (Heightened Alert)
◆ COVID-19: Coronavirus pandemic ◆ q-o-q: quarter-on-quarter, refers to the comparison with the previous
quarter
◆ DPU: Distribution per Unit
◆ RCF: Revolving credit facility
◆ EMTN: Medium Term Notes under FCT’s $3 billion Multicurrency Debt
Issuance Programme ◆ REIT: Real Estate Investment Trust
◆ Essential Services: The groupings of essential and non-essential services ◆ RSI: Retail Sales Index, published by the Department of Statistics
based on Ministry of Trade and Industry’s press release on 21 April 2020 ◆ RSV: Retail Sales Value, published by the Department of Statistics
◆ F&B: Food and Beverage ◆ S&P: Standard and Poor’s (credit rating agency)
◆ FCT: Frasers Centrepoint Trust ◆ Square Feet: sq ft
◆ FCAM: Frasers Centrepoint Asset Management Ltd., the manager of FCT ◆ SST: Sapphire Star Trust, which holds Waterway Point; it is a joint venture
◆ FPL: Frasers Property Limited, the sponsor of FCT of FCT
◆ GRI: Gross Rental Income ◆ WALE: Weighted Average Lease Expiry
◆ Moody’s: Moody’s Investors Service (credit rating agency) ◆ y-o-y: year-on-year, refers to the comparison with the same period in the
previous year
◆ MTN: Medium Term Notes under FCT’s $1 billion multi-currency MTN
program ◆ YTD: year-to-date
◆ NAV: Net Asset Value
◆ NLA: Net Lettable AreaTenants As % of total NLA7 As % of total GRI7
1 NTUC Fairprice1 4.3% 3.3%
2
2 Dairy Farm Group 3.0% 2.8%
3 Kopitiam3 3.1% 2.7%
4
4 Breadtalk Group 1.8% 2.3%
5
5 Metro 2.6% 1.7%
6 Mcdonald’s 0.9% 1.6%
7 Courts 1.5% 1.4%
8 OCBC 0.7% 1.3%
9 Yum!6 0.9% 1.3%
10 UOB 0.6% 1.2%
Total for Top 10 19.5% 19.5%
1. Includes NTUC FairPrice, FairPrice Finest and Unity Pharmacy
2. Includes Cold Storage supermarkets, Guardian Pharmacy & 7-Eleven
3. Operator of Kopitiam food courts, includes Kopitiam, Bagus, Mei Shi Mei Ke and Food Tempo
4. Includes Food Republic, Breadtalk, Toast Box, The Foodmarket and Din Tai Fung
5. Includes leases for Metro Department Store & Clinique Service Centre
6. Operates KFC and Pizza Hut outlets
7. Total may not add up due to rounding differences
27Trade Classifications As % of total NLA1 As % of total GRI1
Food & Beverage 28.8% 37.3%
Beauty & Healthcare 10.4% 14.4%
Fashion & Accessories 11.9% 12.5%
Sundry & Services 5.8% 8.7%
Supermarket & Grocers 8.1% 5.5%
Homeware & Furnishing 4.6% 3.2%
Information & Technology 2.7% 3.1%
Leisure & Entertainment 6.3% 2.9%
Books, Music, Arts & Craft, Hobbies 3.5% 2.5%
Electrical & Electronics 3.1% 2.4%
Jewellery & Watches 0.7% 2.1%
Education 3.6% 2.1%
Sports Apparel & Equipment 2.4% 1.7%
Department Store 2.7% 1.7%
Vacant 5.3% 0.0%
FCT Retail Portfolio 100.0% 100.0%
1. Total may not add up due to rounding differences 28You can also read