WORKING PAPER 231 - Helicopter Money in Europe: New Evidence on the Marginal Propensity to Consume across European Households Katharina Drescher ...
←
→
Page content transcription
If your browser does not render page correctly, please read the page content below
OESTERREICHISCHE NATIONALBANK
                                                                  EUROSYSTEM

                                  WORKING PAPER 231

Helicopter Money in Europe: New Evidence
on the Marginal Propensity to Consume
across European Households

Katharina Drescher, Pirmin Fessler, Peter Lindner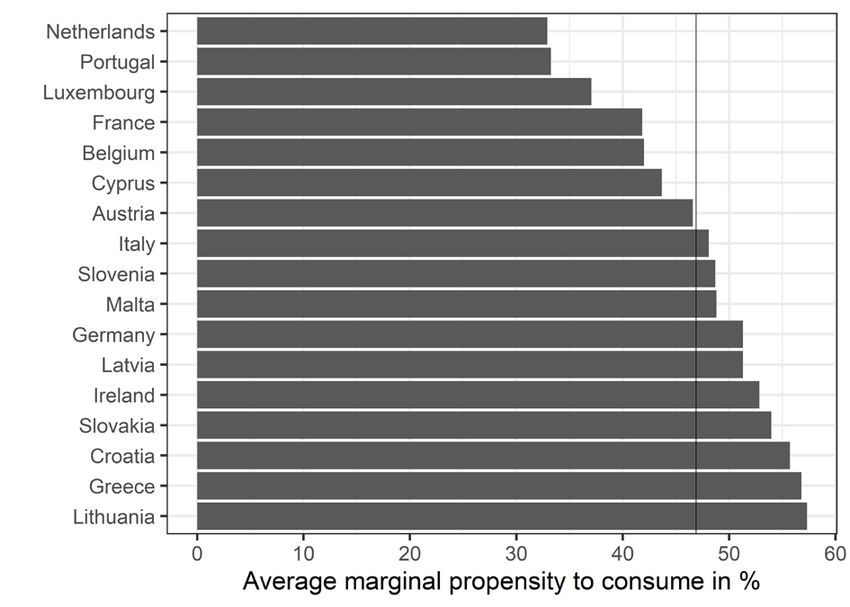
The Working Paper series of the Oesterreichische Nationalbank is designed to disseminate and to provide a platform for
discussion of either work of the staff of the OeNB economists or outside contributors on topics which are of special
interest to the OeNB. To ensure the high quality of their content, the contributions are subjected to an international
refereeing process. The opinions are strictly those of the authors and do in no way commit the OeNB.

The Working Papers are also available on our website (http://www.oenb.at) and they are indexed in RePEc
(http://repec.org/).

Publisher and editor         Oesterreichische Nationalbank
                             Otto-Wagner-Platz 3, 1090 Vienna, Austria
                             PO Box 61, 1011 Vienna, Austria
                             www.oenb.at
                             oenb.info@ oenb.at
                             Phone (+43-1) 40420-6666
                             Fax (+43-1) 40420-046698

Editorial Board              Doris Ritzberger-Grünwald, Ernest Gnan, Martin Summer
of the Working Papers

Coordinating editor          Martin Summer

Design                       Communications and Publications Division

DVR 0031577

ISSN 2310-5321 (Print)
ISSN 2310-533X (Online)

© Oesterreichische Nationalbank, 2020. All rights reserved.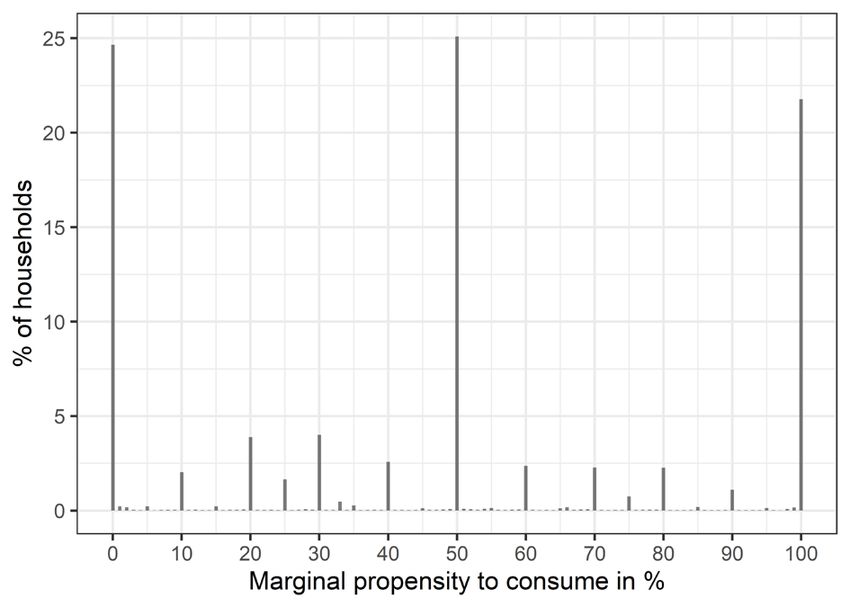
Helicopter Money in Europe: New Evidence on the Marginal Propensity to
                              Consume across European Households

                           Katharina Drescher 1, Pirmin Fessler 2, Peter Lindner 3

                                                    Abstract

The recent spread of COVID-19 has led to the worst economic crisis since the 1930s. To boost
demand after the crisis, direct monetary transfers to households are being discussed. Using
novel microdata from the Eurosystem Household Finance and Consumption Survey (HFCS),
we study how much of such a transfer households would actually spend. We do so by exploiting
the unique opportunity that the new wave of the survey included an experimental question to
calculate the marginal propensity to consume from hypothetical windfall gains. Our results
show that households on average spend between about 33% (the Netherlands) and 57%
(Lithuania) of such a transfer. In all countries, answers are clustered at spending nothing,
spending 50% and spending everything. Marginal propensities to consume decrease with
income but are not as clearly related to wealth.

Keywords: survey data, helicopter money, household finance, monetary policy
JEL codes: D14, D10, D31, E52

1
    Statistics Austria, Guglgasse 13, 1110 Vienna, katharina.drescher@statistik.gv.at
2
    Corresponding Author: Foreign Research Division, Oesterreichische Nationalbank, Otto-Wagner Platz 3, 1090
Vienna, pirmin.fessler@oenb.at.
3
     Economic Analysis Division, Oesterreichische Nationalbank, Otto-Wagner Platz 3, 1090 Vienna,
peter.lindner@oenb.at.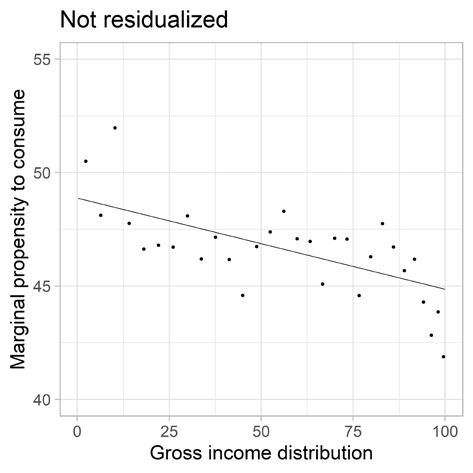
Non-Technical Summary

We use novel microdata from the the Eurosystem Household Finance and Consumption Survey
(HFCS) to document Marginal Propensities to Consume (MPC) out of a (hypothetical) windfall
gain. We exploit the unique opportunity to employ the first large cross-country dataset which
covers a set of 17 European countries (including all euro area countries but Finland, Spain and
Estonia) to do so. The analysis is based on a harmonized survey question within the main
European survey to analyze household finances. The data from the survey have been recently
published by the ECB.
         Besides documenting average MPCs across countries, we also use methods, which allow
us to analyze the distribution of MPCs beyond the mean while keeping the micro perspective
alive.
We find that the MPC is lowest − at about 33% − in the Netherlands and Portugal and highest
− at about 57% − in Greece and Lithuania. Austria lays in the middle of this range with close
to 45%. Patterns behind average MPCs differ strongly across countries. MPCs are negatively
correlated with gross income but the relationship to wealth is less clear. These results are
broadly in line with what is reported in the extensive literature on the topic.
         Based on the empirical evidence at hand we conclude that helicopter money – if applied
equally across euro area countries – would likely have very heterogenous effects across
different countries. Also, within countries the effects would be related to the spending patterns
along the income distribution. Based on the results from the study, we expect a stronger impact
on goods and services consumed by lower income households. Given their higher MPCs, this
effect for lower income households exceeds their proportion of general spending/income. A
households’ position in the net wealth distribution seems to be only loosely related to the
spending behavior from a windfall gain.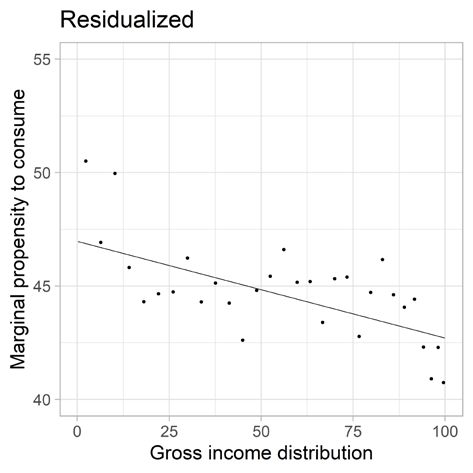
1. Introduction
In recent months helicopter money has been widely discussed as a potential tool to boost the
economy once the COVID-19 health crisis is under control. Several blog posts and new working
papers discuss the issue (see for example Buiter and Kapoor 2020, Cecchetti and Schoenholtz
2020, Cukierman 2020, and Gali 2020). Nevertheless, cross country empirical evidence is still
scarce on how helicopter money is actually spent.
        The literature on the marginal propensity to consume (MPC) is, theoretical as well as
empirical, among the largest and oldest fields in economics. Japelli and Pistaferri (2010)
provide an excellent overview. In a more recent contribution, Japelli and Pistaferri (2014) base
their analysis on a hypothetical question in an Italian household survey to examine the marginal
propensity to consume (MPC) out of windfall gains. Data for this study come from the Survey
Household Income and Wealth (SHIW) conducted in 2010 by the Banca di Italia. As will be
clear below the wording of the question is very similar to the one analyzed in the study at hand.
Japelli and Pistaferri (2014) documented an average MPC of about 48% for Italy. The authors
emphasis a varying MPC over net financial wealth holdings plus net income. Households with
low levels of what is called “cash-on-hand” respond much more extensively to helicopter
money than households higher up this distribution.
       More recently, the contributions of van Rooij and de Haan (2019) utilize data from the
Netherlands. A representative sample of persons answer specific questions of a transfer from
either the ECB or the national government of 500€ or 2,000€ in March 2016. The analysis
reports an MPC of about 30% for the Netherlands. There seems to be no fundamental difference
between the institution paying out helicopter money and the two amounts under consideration.
Furthermore, Djuric and Neugart (2019) use a set of different but similar survey questions that
where filed in the spring of 2016 for a representative sample in Germany. The specific questions
also separate the institution handing out the money (national government vs. ECB vs. lottery
win) but also allow to look at differences between a one-shot sum of 1,200€ or twelve monthly
installments of a 100€ each. Overall, the authors report an MPC of about 40% for Germany.
Additionally, to essentially the same response of households with respect to the institution of
handing out the money, the results are similar to the lottery win formulation that underlies the
investigation we conduct (more on the question wording of the HFCS below). Thus, we are
confident that our information also extends to a more realistic payment from the ECB or a
national institution when it comes to helicopter money.

                                               1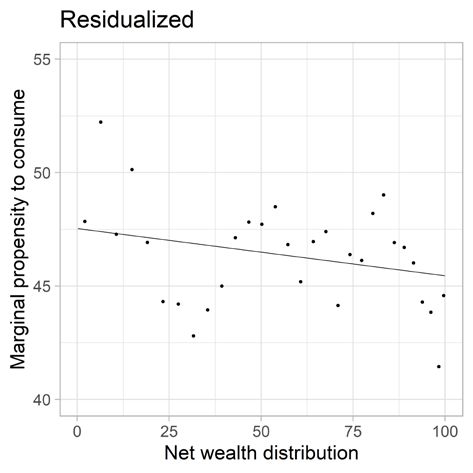
Moreover, Christelis et al. (2019a) look specifically at the symmetry of a positive versus a
negative income shock reporting an overall MPC of about 25% for Dutch households. The
authors argue that negative shocks have larger reaction of households than a positive income
shock. Data for this investigation come from special module of a representative internet panel
for households in the Netherlands. The field period, i.e. the time respondents answered this
model, was in spring and autumn 2016. With regard to wealth, Christelis et al. (2019b) are
examining shocks to the home value and their effects on consumption. They find that more than
90% of households have no consumption response but the relationship to cash on hand of those
who have one (sum of income plus financial wealth) is negative. Finally, another strand of the
literature investigates the effect of income shocks on neighbors’ behavior as for example in
Kuhn et al. (2011) who find a positive effect on car consumption of neighbors of households
winning a car. Again, the information is based on the Dutch population. Here data come from
lottery wins together with a paper-based survey from 2003 to 2006.
       However, the MPC resulting from windfall gains has to the best of our knowledge not
been examined on the basis of internationally comparable microdata for a large set of countries
including the whole balance sheet of households. Note, that using a question on hypothetical
windfall gains instead of actual gains allows to include all households (represented by the
sample) in the analysis, while analyses of actual gains are often restricted to small subsets of
the population. We contribute to the literature by examining the MPC out of a windfall gain for
a set of 17 European countries (including all euro area countries but Finland, Spain and Estonia)
based on a harmonized survey question within the main European survey to analyze household
finances. We estimate the average MPC across countries and the full distribution of income and
wealth. We find heterogeneity across country means as well as strong differences in
distributional patterns with regard to extreme saving or spending behavior. While the average
MPC clearly decreases with income, it shows no correlation with wealth. We conclude that a
standardized monetary intervention via helicopter money in the euro area would lead to very
heterogenous effects across different countries, but also within countries across households.
       We structure the paper as follows. First, we introduce the data in section 2. A short
summarizing of the method in section 3 precedes the discussion of the results in section 4,
which is the center of our analysis. Section 5 concludes.

                                               2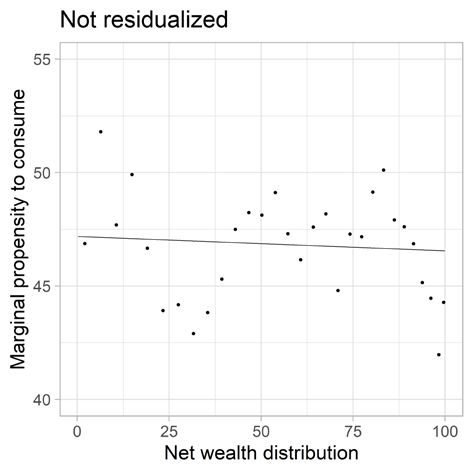
2. Data
           The data come from the third wave of the Eurosystem HFCS and was published in April
2020. 4 While the survey was conducted in 22 countries, only 17 countries included the question
on a windfall gain. This question is ideal for analyzing the topical issue of helicopter money.
We use individual household-level data for Austria (AT), Belgium (BE), Cyprus (CY),
Germany (DE), France (FR), Greece (GR), Croatia (HR), Ireland (IE), Italy (IT), Lithuania
(LT), Luxembourg (LU), Latvia (LV), Malta (MT), the Netherlands (NL), Portugal (PT),
Slovakia (SK) and Slovenia (SI), altogether comprising 58,515 observations without any
missing information. 5 The unique feature of this survey we use is the experimental question on
helicopter money, which was implemented as a hypothetical windfall gain from a lottery win
of an amount equal to the net income a household receives in one month. The data also contain
standard socioeconomic demographic characteristics as well as detailed information on the
balance sheets of households.
           Similar to Jappelli and Pistaferri (2014), our main variable of interest is the hypothetical
question on the windfall gain a household receives. The question posed to households is

           Imagine you unexpectedly receive money from a lottery, equal to the amount of income
your household receives in a month. What percent would you spend over the next 12 months on
goods and services, as opposed to any amount you would save for later or use to repay loans?

           Following the existing literature, we estimate the marginal propensity to consume out
of such a windfall gain. In particular, we are interested in its distribution across household
incomes as well as across countries, because both are crucial to designing a potential helicopter
money policy and evaluating its potential impact. On top of that, our survey allows for an
assessment of the MPC across the distribution of net wealth as well. Table 1 shows descriptions
of all variables we use in the analysis. Summary statistics of the surveys and main variables
used in our empirical analysis are presented in table 2.

4
    Detailed information about the survey can be found at https://www.ecb.europa.eu/pub/economic-
research/research-networks/html/researcher_hfcn.en.html.
5
  All HFCS data is multiply imputed five times. However, not all countries included the experimental question
into their list of variables to be imputed. That is why for calculations of the MPC we can only use 58,515
observations out of the total 60,114 for all countries (see table 1). We use Rubin’s Rule for all calculations.

                                                        3
Table 1 Description of Variables
Name Explanation Definition
hiz0400a spending
How much of an lottery gain of one month households income
is spend over the next 12 months on goods and services
dn3001 net wealth Total household assets excluding public and occupational
pension wealth minus total outstanding household’s liabilities
(excluding public pensions)
di2000 gross income Total gross annual household income aggregate
dh0001 household sizeNumber of household members, all household members
included
dhageh1b age brackets Age of the RP (UN/Canberra definition used in the ECB-HFCS
statistical output) in brackets: 16-19, 20-24, 25-29, 30-34, 35-39,
40-44, 45-49, 50-54, 55-59, 60-64, 65-69, 70-74, 75-79, 80-84, 85
and older
dhaged65plus old age Household members aged 65 or more
Source: HFCS 2017
4Table 2 Descriptive statistics
Net wealth Gross income
Country Non-missing obs. All observations % of missing MPC Average MPC (%) Mean Median Mean Median
Austria 3,072 3,072 0.0 46.6 250.3 82.6 50.4 41.2
(0.8) (22.3) (3.9) (1.4) (0.5)
Belgium 2,275 2,329 2.3 42.0 366.2 212.2 56.4 43.5
(1.1) (21.4) (9.4) (1.2) (1.0)
Cyprus 1,303 1,303 0.0 43.7 499.7 195.4 32.9 25.3
(1.6) (58.6) (15.4) (0.9) (1.1)
Germany 4,940 4,942 0.0 51.3 232.8 70.7 53.1 40.1
(0.8) (8.7) (3.4) (0.9) (0.7)
France 13,685 13,685 0.0 41.8 242.0 117.6 40.5 32.3
(0.5) (5.3) (5.4) (0.4) (0.5)
Greece 2,964 3,007 1.4 56.8 93.9 60.0 22.5 19.0
(1.0) (3.8) (2.5) (0.4) (0.4)
Croatia 1,335 1,357 1.6 55.7 106.6 61.4 12.2 8.4
(1.2) (8.5) (3.3) (0.5) (0.4)
Ireland 4,517 4,793 5.8 52.8 367.8 184.9 65.2 48.0
(0.9) (11.3) (6.1) (1.5) (0.7)
Italy 7,420 7,420 0.0 48.1 214.3 132.1 33.8 24.6
(0.7) (5.0) (3.0) (0.5) (0.3)
Lithuania 1,444 1,664 13.2 57.3 84.3 45.8 10.8 7.1
(1.7) (5.8) (2.0) (0.6) (0.3)
Luxembourg 1,616 1,616 0.0 37.1 897.9 498.0 93.1 71.0
(1.0) (45.4) (23.2) (1.9) (1.9)
Latvia 1,196 1,249 4.2 51.3 43.0 20.5 14.3 10.2
(1.8) (2.7) (1.5) (0.3) (0.3)
Malta 1,004 1,004 0.0 48.8 400.7 236.0 31.2 25.4
(0.9) (29.3) (6.4) (1.0) (0.9)
Netherlands 1,735 2,556 32.1 32.9 186.0 67.3 54.8 44.8
(0.7) (9.9) (4.1) (1.0) (0.8)
Portugal 5,816 5,924 1.8 33.2 162.3 74.8 24.6 17.6
(0.7) (7.2) (2.2) (0.6) (0.3)
Slovenia 2,014 2,014 0.0 48.7 144.3 91.5 22.3 16.4
(1.2) (7.4) (3.1) (0.5) (0.5)
Slovakia 2,179 2,179 0.0 54.0 103.5 70.3 20.3 16.0
(1.1) (5.0) (2.7) (0.8) (0.4)
All 58,515 60,114 2.7 46.9 224.5 94.7 43.0 31.6
Note: Wealth and yearly household income shown in EUR thousands based on all observations. Standard errors
are shown in parentheses. Standard errors are based on 500 replicate weights taking into account the complex
survey design and multiple imputations. Multiple imputations are available for all countries in the case of income
and wealth. Missing MPCs are excluded for those countries which do not impute them.
Source: HFCS 2017
53. Methods
We use straightforward tools to describe the empirical results of the question at hand.
Note, however, that we use both complex survey population weights and multiple imputations
for all statistics shown. While the multiple imputations would not be very important for the
experimental question alone, they are crucial for obtaining the correct correlations with income
and wealth. We show the full distribution of answers to the experimental question using a
detailed histogram. We calculate the average marginal propensity to consume across all
countries. And we use two tools to describe large datasets while keeping the micro perspective
alive:
First, we use locally weighted non-parametric linear regressions (loess) to estimate the
share of households providing an answer at the end of the spectrum by saying that they spend
nothing (MPC=0) or all (MPC=1) across the full distribution of gross income 6 (using the
cumulative distribution function).
Second, we use binned scatter plots where average MPCs of bins including an equal
number of households (weighted observations) are calculated across gross income and net
wealth. In a second step we also use binned scatter plots of the same variables, but residualized.
Thus, by using linear regression and the Frisch-Waugh-Lovell theorem variation explainable
by a set of control variables is filtered out before plotting.
6
We use the cdf of gross income for several reasons: First, net income is not available in the HFCS. Second,
because of potential measurement error we only use the ranking of households and not their actual income
values. The ranking should also be highly correlated with the ranking according to net income.
64. Results
Figure 1 shows the full range of answers to the question on how much of the windfall
gain would be spent. One can clearly see that the answers are clustered at three points: saving
all (MPC=0), saving/spending half (MPC=0.5) and spending all (MPC=1). This finding holds
also at the country level for all countries, however in varying degrees. It also ties in with the
findings of the literature discussed.
Figure 1 Distribution of Marginal Propensity to Consume
Note: Pooled data.
Source: HFCS 2017
7Figure 2 shows the average MPC across all countries. The results of Japelli and Pistaferri
(2014) for Italy and Rooij and de Haan (2019) for the Netherlands are almost replicated. Only
compared to Djuric and Neugart (2919), who found an average MPC of about 40% for
Germany, do we find a much higher MPC (of about 51%).
Figure 2 Average marginal propensity to consume across countries
Note: Line shows the average marginal propensity to consume for the pooled data.
Source: HFCS 2017
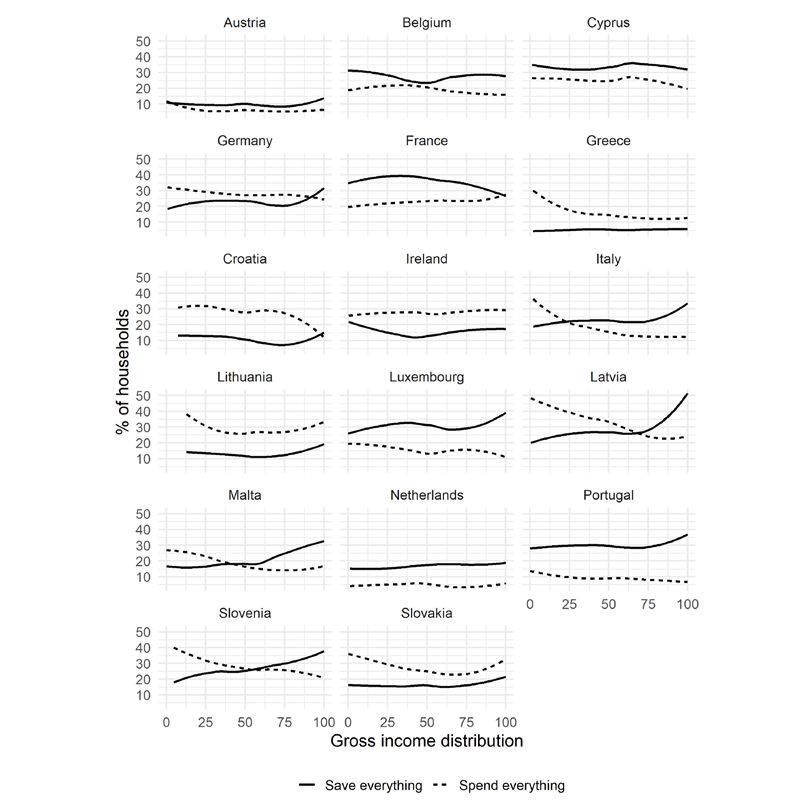
8Figure 3 shows the results of locally weighted linear regressions (loess) to smooth the
share of answers at the end of the spectrum − spending all and saving all − across the gross
income distributions of all countries. It illustrates that behind the average MPC there exists a
lot of cross-country heterogeneity in terms of MPCs across the gross income distributions. In
some countries the share of those who save everything is higher across the full distribution of
gross income. In others the share of those who spend everything dominates. In some countries
the correlation with income is much stronger than in others. All these patterns illustrate that
overall the effects of euro area-wide helicopter money might be rather heterogenous not only
on average across countries but also in terms of different patterns across and within countries.
Figure 3 Share of households saving or spending everything (MPC=0 and MPC=1)
Note: Gross Income distributions are constructed via cdfs at the country level.
Source: HFCS 2017
9Figure 4 shows four binned scatter plots. In all of them each dot represents about 4.2
million households and is calculated based on about 1,930 observations (on average). All
figures show average MPCs across the income and wealth distributions of the pooled data. The
residualized plots control for country dummies 7, households size, age of the reference person
based on 15 categories and a dummy variable indicating that at least one person living in the
household is 65 years or older, and wealth (in the case of income) or income (in the case of
wealth). The data offer the unique opportunity to analyze average MPC together with wealth.
One can clearly see that there is hardly any correlation between households´ net wealth and
their MPC. By contrast, there is clearly a negative correlation between MPC and income. One
reason for this difference might be that income is immediately available for spending.
Conversely, a large part of household wealth such as housing, cars or other real assets but also
part of the financial assets is not directly available for spending but would need to be liquidated
or used as a collateral first.
To illustrate that the results based on our flexible binned scatter plots are confirmed by
standard regression analysis we also show standard regression results in table 3. We regress the
MPC on the CDF of income as well as the CDF of wealth. Results confirm what can be seen in
Figure 4. Over the full income distribution, the MPC changes by 4 percentage points while over
the wealth distribution it does by only 0.6 and 2 (in the case with controls) percentage points.
Comparing figure 4 and table 3 also illustrates why binned scatter plots are preferable for this
analysis. While the main result, that the relationship is clearly negative for income and much
less clear for wealth can be confirmed with linear regression it masks the stronger differences
between the upper and lower parts of the distributions.
7
Country-level fixed effects should control for differences in the levels of income or wealth due to institutional
differences or differences in national price levels.
10Figure 4 Average marginal propensity to consume across income and wealth
Wealth
Income
Note: The figures show binned scatter plots of the pooled data. Each dot represents about 4.2 million households
and is calculated based on about 1,930 observations (on average). The net wealth and gross income distributions
are cdfs constructed on the pooled data. Residualized plots control for country dummies, household size, age of
the reference person based on 15 categories and a dummy variable indicating that at least one person living in the
household is 65 years or older, as well as income in the case of wealth and wealth in the case of income.
Source: HFCS 2017
11We also investigated the relationships at the country level using CDFs of wealth and
income within countries. The results (not shown) confirm the clear negative relationship
between the MPC and income for all countries but France. They show that the less clear
relationship to wealth is not only due to mixed results for different countries but also to less
strong correlations within countries. While Belgium, France, Ireland, Lithuania, and Slovakia
show a positive slope, the negative slopes in most other countries are less steep. For a detailed
analysis how and why these countries differ with regard to the correlations between the MPC
and wealth as well as the distribution of the MPC within countries more detailed country-level
analyses including differences between household portfolios are necessary. Using cash on hand
as Christelis et al. (2019b) instead of net wealth might be an interesting extension at the country
level – but is beyond the scope of this paper.
Table 3 Linear Regression results
Dependent Variable:
Marginal Propensity to Consume
CDF of gross income -4.019 -4.263
(0.526) (0.611)
CDF of wealth -0.631 -2.082
(0.527) (0.598)
Country Fixed Effects YES YES
Age and household size controls YES YES
Wealth control Yes
Income control YES
Observations 58,515 58,515 58,515 58,515
Note: The table shows linear regression results on the pooled data based on the first imputation implicate of the
HFCS. Missing MPCs are excluded for those countries which do not impute them. Controls include country
fixed effects, household size, age of the reference person based on 15 categories and a dummy variable
indicating that at least one person living in the household is 65 years or older, as well as income in the case of
wealth and wealth in the case of income.
Source: HFCS 2017
125. Concluding remarks
Using microdata comparable across 17 European countries, we find that the average
marginal propensities to consume (MPCs) vary considerably across countries. The MPC is
lowest − at about 33% − in the Netherlands and Portugal and highest − at about 57% − in Greece
and Lithuania. Patterns behind average MPCs differ strongly across countries. MPCs are
negatively correlated with gross income but the relationship to wealth is less clear.
Based on the empirical evidence at hand we conclude that helicopter money – if applied
equally across euro area countries – would likely have very heterogenous effects across
different countries. But also within countries, the effects would be related to the spending
patterns along the income distribution, with a relatively stronger impact on goods and services
consumed by lower income households exceeding their proportion of general spending/income.
Given the higher MPC in lower income groups, one policy conclusion could be that a
lump sum transfer is preferable to an inequality-preserving amount proportional to net income.
Our paper was a first attempt to document the differences between average MPCs in
euro area countries based on comparable microdata as well as a documentation of their
heterogeneity across and within countries and their correlation to income and wealth. However,
further research is needed to document the different patterns of MPC distributions across
countries beyond the mean and to better understand the relationship to socioeconomic
characteristics as well as income and wealth.
13References
Buiter, W. & Kapoor, S. (2020). To fight the Covid pandemic, policymakers must move fast
and break taboos, https://voxeu.org/article/fight-covid-pandemic-policymakers-must-
move-fast-and-break-taboos [accessed June 2020]
Cecchetti, S. G. & Schoenholtz, K. L. (2020). Helicopters to the Rescue?,
https://www.moneyandbanking.com/commentary/2020/5/10/helicopters-to-the-rescue
[accessed June 2020]
Christelis, D., Georgarakos, D., Jappelli, T., Pistaferri, L. & van Rooij, M. (2019a). Asymmetric
Consumption Effects of Transitory Income Shocks, The Economic Journal, 129 (622),
2322–2341.
Christelis, D., D. Georgarakos, T. Jappelli, L. Pistaferri and M. van Rooij (2019b). Wealth
shocks and MPC heterogeneity. DNB Working Paper No. 645.
Cukierman, A. (2020). Helicopter Money & the Fiscal-Monetary Nexus, CEPR discussion
paper, https://cepr.org/active/publications/discussion_papers/dp.php?dpno=14734
De Haan, J., & van Rooij, M. (2019). Would helicopter money be spent? New Evidence for the
Netherlands, Applied Economics, 51:58, 6171-6189.
Djuric, U. & Neugart, M. (2019). Helicopter Money: Survey evidence on expectation formation
and consumption behavior, Oxford Economic Papers, gpz062,
https://doi.org/10.1093/oep/gpz062
Gali, J. (2020). Helicopter money: The time is now, https://voxeu.org/article/helicopter-money-
time-now [accessed June 2020]
Japelli, T. & Pistaferri, L. (2010). The Consumption Response to Income Changes, Annual
Review of Economics, 2(1), 479-506.
Japelli, T. & Pistaferri, L. (2014). Fiscal Policy and MPC heterogeneity, American Economic
Journal: Macroeconomics, 6(4):107-136.
Kuhn, P., Kooreman, P., Soetevent, A. & Kapteyn, A. (2011). The Effects of Lottery Prizes on
Winners and Their Neighbors: Evidence from the Dutch Postcode Lottery, American
Economic Review, 101(5), 2226-2247.
14Index of Working Papers:
June 15, Anil Ari 202 Sovereign Risk and Bank Risk-Taking
2015
June 15, Matteo Crosignani 203 Why Are Banks Not Recapitalized During
2015 Crises?
February 19, Burkhard Raunig 204 Background Indicators
2016
February 22, Jesús Crespo 205 US Monetary Policy in a Globalized World
2016 Cuaresma,
Gernot Doppelhofer,
Martin Feldkircher,
Florian Huber
March 4, Helmut Elsinger, 206 Competition in Treasury Auctions
2016 Philipp Schmidt-
Dengler,
Christine Zulehner
May 14, Apostolos 207 Determinants of Credit Constrained Firms:
2016 Thomadakis Evidence from Central and Eastern Europe
Region
July 1, Martin Feldkircher, 208 Unconventional US Monetary Policy: New
2016 Florian Huber Tools Same Channels?
November 24, François de Soyres 209 Value Added and Productivity Linkages
2016 Across Countries
November 25, Maria Coelho 210 Fiscal Stimulus in a Monetary Union:
2016 Evidence from Eurozone Regions
January 9, Markus Knell, 211 Inequality, Perception Biases and Trust
2017 Helmut Stix
January 31, Steve Ambler, 212 The Effectiveness of Unconventional
2017 Fabio Rumler Monetary Policy Announcements in the Euro
Area: An Event and Econometric Study
May 29, Filippo De Marco 213 Bank Lending and the European Sovereign
2017 Debt Crisis
June 1, Jean-Marie Meier 214 Regulatory Integration of International
2017 Capital MarketsOctober 13, Markus Knell 215 Actuarial Deductions for Early Retirement
2017
October 16, Markus Knell, 216 Perceptions of Inequality
2017 Helmut Stix
November 17, Engelbert J. Dockner, 217 Sovereign Bond Risk Premiums
2017 Manuel Mayer,
Josef Zechner
December 1, Stefan Niemann, 218 Optimal fiscal policy and sovereign debt
2017 Paul Pichler crises
January 17, Burkhard Raunig 219 Economic Policy Uncertainty and the
2018 Volatility of Sovereign CDS Spreads
February 21, Andrej Cupak, 220 Exploring differences in financial literacy
2018 Pirmin Fessler, across countries: the role of individual
Maria Silgoner, characteristics and institutions
Elisabeth Ulbrich
May 15, Peter Lindner, 221 International monetary policy spillovers
2018 Axel Loeffler, through the bank funding channel
Esther Segalla,
Guzel Valitova,
Ursula Vogel
May 23, Christian A. Belabed, 222 Income inequality and trust in national
2018 Mariya Hake governments in Central, Eastern and
Southeastern Europe
October 16, Pirmin Fessler, 223 The functions of wealth: renters, owners and
2018 Martin Schürz capitalists across Europe and the United
States
October 24, Philipp Poyntner, 224 Bail-in and Legacy Assets: Harmonized
2018 Thomas Reininger rules for targeted partial compensation to
strengthen the bail-in regime
Dezember 14, Thomas Breuer, 225 Systematic Systemic Stress Tests
2018 Martin Summer
May 20, 2019 Helmut Stix 226 Ownership and purchase intention of crypto-
assets – survey results
October 17, Markus Knell, 227 How Peer Groups Influence Economic
2019 Helmut Stix PerceptionsFebruary 26, Helmut Elsinger 228 Serial Correlation in Contingency Tables
2020
March 2, Mariarosaria 229 Assessing Credit Gaps in CESEE Based on
2020 Comunale, Levels Justified by Fundamentals –A
Markus Eller, Comparison Across Different Estimation
Mathias Lahnsteiner Approaches
April 30, Martin Brown, 230 Financial Innovation, Payment Choice and
2020 Nicole Hentschel, Cash Demand – Causal Evidence from the
Hannes Mettler, Staggered Introduction of Contactless Debit
Helmut Stix Cards
July 30, Katharina Drescher, 231 Helicopter Money in Europe: New Evidence
2020 Pirmin Fessler, on the Marginal Propensity to Consume
Peter Lindner across European HouseholdsYou can also read