February 26, 2019 - JPMorgan Chase
←
→
Page content transcription
If your browser does not render page correctly, please read the page content below
February 26, 2019
Agenda
                       Page

1   Overview             1
2   Consumer Banking    10
3   Home Lending        17
4   Card                27
5   Closing remarks     42
6   Notes               43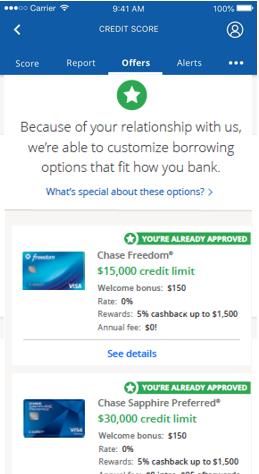
We remain focused on a consistent set of strategic priorities
Deliver One Chase experiences that provide choice, security, ease, personalization, and integrated payments
Create interoperability between physical and digital channels to provide seamless omni-channel experiences for our customers
Execute expense management strategies while continuing to invest for the future
Continue in our unwavering commitment to operate an effective and efficient risk and control environment
Protect the Firm's systems and confidential data from internal and external threats, and safeguard the privacy of customers and
employees
Attract, develop, and retain the best talent for today and the future, harnessing the power of diversity
1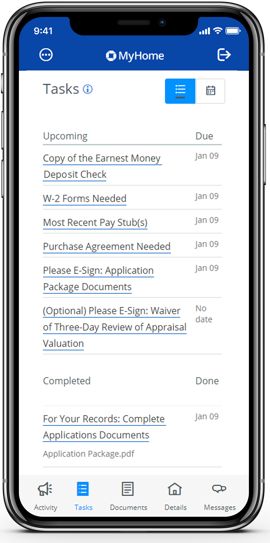
We have made significant progress against our commitments
We have committed to… …and have delivered on those promises
Relationships with ~50% of U.S. households – of which 25% have a multi-LOB
relationship
Deliver One Chase experiences to grow share from
a position of strength ~2x retail deposit growth rate vs. the industry1
#1 in total U.S. card sales volume and #1 in credit card outstandings2
Differentiated our customer experience with a seamless omni-channel approach
Create interoperability between physical and digital
Expanded into new markets utilizing integrated physical and digital channels
channels
Digitally opened ~1.5mm deposit accounts since Feb. 20183
Reduced overhead ratio by ~4ppts since 2014
Manage expenses while continuing to invest in the
future Increased investments in technology and marketing by ~30% since 2016 –
deployed with discipline
Operate an effective and efficient risk and control Improved risk monitoring capabilities to enable surgical pullbacks
environment De-risked the mortgage business
Note: For footnoted information, refer to slide 43
2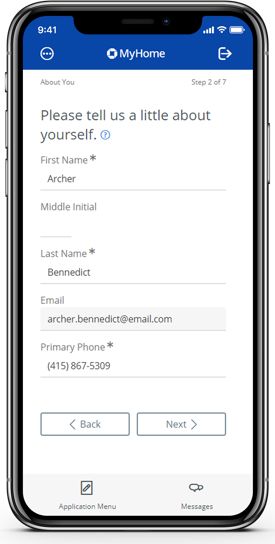
Performance targets

    Consumer & Community Banking targets
                                                                                                                                                                                         2019
                                                                                                                                                  2017                     2018        outlook
              Business Banking                                   Net charge-off rate                                                           0.57%                      0.49%

                  Home Lending                                   Net charge-off / (recovery) rate1                                             0.03%                     (0.02%)

                                                                                                                                                                                                  Medium-term: Modestly higher on mix
                                                                 Net charge-off rate                                                           2.95%                      3.10%
                  Card Services
                                                                 Net revenue rate                                                            10.57%                      11.27%       11.50%+/-       Prior year target 11.25%+/-

                           Auto                                  Net charge-off rate                                                          0.51%2                      0.38%

                                                                                                                                                                                   Medium-term
                                                                                                                                                                                      guidance
                                                                 ROE                                                                                 17%                    28%          25%+
                      Total CCB
                                                                 Overhead ratio                                                                      56%                    53%         50%+/-

1   Excludes the impact of purchased credit-impaired (“PCI”) loans and reperforming and non-performing loan sales
2   Included ~$50mm of incremental charge-offs reported in accordance with regulatory guidance related to customer bankruptcies; adjusted net charge-off rate of 0.43%
                                                                                                                                                 3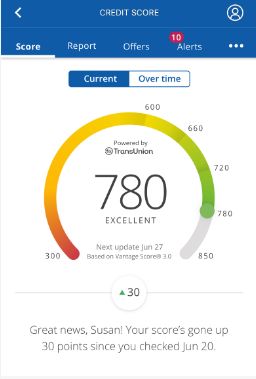
Continuous investment is driving strong momentum across key business drivers
Key business drivers ($B, except ratios and where otherwise noted)
                                                                                                                    2018    YoY ∆
                                                                       Households (mm)                              61.7       1%
                                                                       Small businesses (mm)                         4.2       5%
                 Consumer &                                            Active digital customers1 (mm)                49.3      5%
              Community Banking                                        Active mobile customers2 (mm)                 33.3     11%
                                                                       Average deposits                             $670       5%
                                                                       Average loans                                $478       2%
                                                                        Average deposits                            $527       4%
               Consumer Banking                                         Deposit margin3                            2.38%    41 bps
                                                                        Client investment assets (end of period)    $282       3%
                                                                        Average deposits                            $130       7%
                Business Banking
                                                                        Average loans                                $24       5%
                                                                        Total mortgage originations                  $79    (19%)
                    Home Lending                                        Average loans                               $242       2%
                                                                        Total loans serviced (end of period)        $790     (3%)
                                                                        Sales volume4                               $692      11%
                       Credit Card
                                                                        Average loans                               $146       4%
                Merchant Services                                       Merchant processing volume                 $1,366     15%
                                                                        Loan and lease originations                  $32     (5%)
                             Auto
                                                                        Average loan and leased assets               $83       4%
1 Users of all web and/or mobile platforms who have logged in within the past 90 days                          4
2 Users of all mobile platforms who have logged in within the past 90 days
3 Includes Consumer and Business Banking deposits
4 Excludes Commercial Card
Volume-driven growth and rate benefit drove strong top-line results for the year
CCB revenue ($B)
$1.9 $0.4 $52.1
$3.3
$46.5
2017 Volume-driven Interest rate impact¹ Other² 2018
revenue growth
Note: Numbers may not sum due to rounding
1 Includes Home Lending production revenue margin compression due to increased competition in a smaller market
5
2 Reflects Sapphire Reserve acquisition costs, net of Card deal renegotiationsWe improved our operating leverage while continuing to invest and grow
2017 2018 2019
Revenue $46.5B $52.1B
Flat for 2020 and 2021
Expense $26.1B $27.8B ~$29B ex-auto lease growth
Overhead ratio 56% 53%
Headcount1 ~140K ~135K
1 Includes employees and contractors. 2017 excludes Commercial Card headcount. During 3Q18, ~1,200 employees transferred from CCB to CIB as part of the reorganization of the Commercial Card business
6Our investments made it easier for customers to self-serve and enabled operational efficiencies
and workforce transformation, which have lowered costs
Reduction in cost to serve1 per CCB household Efficiency examples
Customer behavior >80% of transactions completed
(~15%)
shift through self-service channels3
Operational Inbound calls per household down 3%4,5
efficiencies Cost per call down 7%4,5
Workforce Technology / digital headcount up 2K+4
2014 2018 transformation Operations headcount down ~7K4
CCB
headcount2 ~146K ~135K
CCB’s overhead ratio has improved ~4ppts from 2014 – 2018, Going forward, expect continued headcount reductions in
while the cost to serve efficiency ratio1 has improved ~10ppts operations and efficiencies in technology / digital
Note: For footnoted information, refer to slide 44
7We have a portfolio of investments that will fuel long-term results
Technology investments in 2018 are expected to generate:
Increasing efficiency >$1B in annual run-rate savings1
ROI2 of >2x
Created differentiated experiences (e.g., QuickPay with Zelle®, Digital Account Opening, Credit JourneySM) for
Digital experience and 49mm active digital customers3, up 5% YoY
innovation
Pace of product launches has accelerated over the last 12 months
Marketing investments in 2018 generated:
Marketing ~8mm new Card accounts, which are expected to drive ~$80B in spend4
2mm+ new Consumer Banking households and ~$15B in average deposits4
Opened first 10 branches in 3 expansion markets (Boston, Washington, D.C., and Philadelphia), which alone
Branch expansion represent a ~$400B deposit opportunity
Regulatory approval for another 8 expansion markets, representing an additional ~$300B deposit opportunity
Regulatory and
Continue to uplift standards – cybersecurity, KYC, and data
controls
1 Reflects projected 2022 results for technology programs with active development in 2018
2 Reflects five-year cumulative pretax income excluding development costs divided by development costs for expense-reducing technology programs with active development in 2018
3 Users of all web and/or mobile platforms who have logged in within the past 90 days 8
4 Reflects steady-state year 3 performance for Card and year 1 performance for Consumer BankingThe power of our digital platform
Our digital platform is embedded in our customers’ daily lives… …creating an ecosystem that drives engagement3
Net Promoter Score4
10 points
49mm Active digital customers1 Customers are
more satisfied…
Monthly digital logins per customer2 All other households Digitally-engaged
households
Card spend per household5
8%
~2x
7% …more
engaged…
All other households Digitally-engaged
households
% with multi-LOB relationships6
~2x
…and have
deeper Chase
relationships
All other households Digitally-engaged
2016 2017 2018 households
Note: For footnoted information, refer to slide 45 9Agenda
Page
1 Overview 1
2 Consumer Banking 10
3 Home Lending 17
4 Card 27
5 Closing remarks 42
6 Notes 43We have made significant progress against our priorities
Acquire and Grew Consumer Banking deposit & investment balances by $215B since 20141
deepen
relationships Acquired 2.5mm net new households since 20142
Increase 75% of new customers are mobile-active after 6 months3
engagement 22mm mobile-active Consumer Banking customers, up 8% since last year4
Increase Lowered the variable cost per Consumer Banking household by 14% since 20145
efficiency
Reduced teller transactions by 34% since 20146
Note: For footnoted information, refer to slide 46
10We continue to grow our business at an industry-leading pace, winning with both new and
existing customers
We are growing at an industry-leading pace… …by winning with both new and existing customers
Four year deposit growth1 Share of new primary bank
2014 – 2018 CAGR relationships in 2017 and 20182
9.4% Average new checking relationship
#1 in deposit growth 23% balance increased 40% since 20143
since 2014
13%
7%
5.3% Industry avg. growth = 4.6%
JPM BAC WFC
3.8%
3.2%
increase in overall customer
4.6ppts satisfaction since 20144
Chase National Super Other
banks regional
2.5ppts decrease in attrition rate since 20145
2017 – 20181 6% 2% 3% 4%
Note: For footnoted information, refer to slide 47
11Our investments in digital platforms and functionality have made it easier for customers to
self-serve
#1 largest active mobile banking
customer base among U.S. banks1 #1 fastest-growing mobile banking
customer base among U.S. banks1
Everyday digital activities enabled by Chase
Manage your Split a bill with Deposit
finances with the friends using checks with
Chase app QuickPay with Zelle® QuickDepositSM
21 7.6mm 29%
Mobile logins per QuickPay with Zelle® Proportion of check deposit
month in 20182 active users in 20183 transactions through
QuickDepositSM in 20184
Up 9% since 2017 Up from 5.8mm in 2017 Up from 25% in 2017
Note: For footnoted information, refer to slide 48
12Our physical network has been critical to achieving industry-leading deposit growth
As we strengthen our self-service capabilities, customers are
transacting at the teller line less often… …but still highly value a physical presence
Average teller transactions
per customer1
Convenient branch locations are the top consideration
(41%) #1 driver for prospective switchers2
21mm households have used a branch in the last year3
of our deposit growth from 2014 – 2018 was driven
70% by households who frequently use branches4
2014 2018
We have maintained flexibility in our physical network
Over 75% of our branches could be exited within 5 years and over 85% could be extended for more than 10 years
Note: For footnoted information, refer to slide 49
13We are innovating across our channels and throughout the customer lifecycle
Open Manage Deepen
Digital Account Opening reduced First retail U.S. bank to send external Increasing engagement and banker
time to open an account to 3 – 5 transfers within 15 seconds via the productivity through new tools such
minutes1 new Real-Time Payments network3 as Digital Meeting Scheduler
Launching Digital Account Opening ATMs can process 74% of teller Deepening with CCB customers
in the branch will enable bankers to transactions4 through better together products
optimize their time for advice
~1.5mm deposit Multi-LOB engaged
10ppts growth in
accounts opened households contribute
digital engagement
through Digital Account 2.5x higher pretax
since 20145
Opening since Feb. ‘182 income6
Note: For footnoted information, refer to slide 50
14We are effectively expanding our physical network to attractive new markets
Drivers of effective market expansion Delivering Chase to more of the U.S.
Attractive markets: Large, fast-growing expansion
markets, including three of the top 10 markets, which alone U.S. customers in-footprint2
represent ~$400B of industry deposits1
+24ppts
Cross-LOB customers: Sizable existing customer base
from other LOBs with high Chase brand affinity; Card
customers have a 2.2x higher offer response rate
93%
Omni-channel: Powerful combination of branch-driven
new-to-bank acquisitions and digitally-driven deepening 69%
Smarter footprint: Enabled by card transaction data and
new ATM capabilities
2018 2022
Applying this playbook to our existing network, we have grown our deposit share from 13% to 16%
in top 10 markets while reducing our share of branches3
Note: For footnoted information, refer to slide 51
15We are well-positioned for long-term financial success and industry outperformance
Acquire and Expand our physical footprint to cover 93% of the U.S. population by the end of 2022 (up from 69% before
deepen market expansion), allowing us to reach 80mm more U.S. consumers1
relationships Continue expanding our distribution beyond the branch through Digital Account Opening
Scale banker digital tools and resources nationally to better connect our 26mm active digital customers2
with the right people to address their unique financial needs
Increase
engagement Utilize in-branch digital account opening efficiencies to further migrate banker time from process
management to customer relationship building
Deploy leaner, innovative physical formats at scale across existing and expansion markets
Increase
efficiency Continue to migrate transactions to lower cost channels through digital enhancements and ATMs that
continue to get closer to teller parity
1 2018 U.S. population sourced from U.S. Census Bureau. Sum of population of states in which Chase currently has or will have a branch presence post market expansion
2 Consumer Bank users who were 90-day active on an online or mobile platform in December 2018
16Agenda
Page
1 Overview 1
2 Consumer Banking 10
3 Home Lending 17
4 Card 27
5 Closing remarks 42
6 Notes 43We continue to build a high-quality, customer-focused Home Lending business
✓ We are taking a disciplined approach to growth
Maintain excellent Strong portfolio credit quality (average FICO 756, average CLTV 57%)1
origination credit quality
Loan balances optimized for liquidity and capital
✓ Our portfolio de-risking positions us well through the credit cycle, and we plan to maintain credit
Improve quality of servicing quality at this level
portfolio and de-risk the Foreclosure inventory down to ~25K in 2018 from 93K in 2014
business
Continued improvement in servicing portfolio delinquency rates from 6.23% in Dec.’14 to 3.56% in Dec.’182
Continue to focus on ✓ Customer satisfaction continues to improve
delivering a great customer Improvement in J.D. Power rank (+3 in Originations, +4 in Servicing) between 2017 and 20183
experience… Record high Home Lending NPS score
✓ We are investing in enhancements to deliver a differentiated home buying experience for Chase
…while innovating to win customers
with Chase primary bank Chase MyHome digital mortgage fulfillment experience for customers and simplified applications with Chase data prefill
customers
Digital and instant customer verification pilot
1 Excludes Private Bank loans and mortgage loans insured by U.S. government agencies
2 Based on number of loans serviced. Includes foreclosures and second liens and excludes real estate owned (“REO”) inventory
3 Source: "U.S. Primary Mortgage Origination and Servicer Satisfaction Studies,” J.D. Power, 2017 and 2018
17The home lending industry is in a state of transition
Profitability remains challenged across the industry as origination volume continues to decrease, spreads compress, and production
costs rise
Primary2 / Secondary3 mortgage rate spread and
Mortgage origination market1 ($B)
industry Retail production cost per loan ($)4
Purchase Refinance Primary / Secondary spread (%) Industry Retail production cost per loan ($)
1.10% $9,000
$2,065
$8,500
$1,810 1.05%
$1,735
$1,630 $8,000
$1,028
$1,300 $666 1.00%
$811 $489 $7,500
$517 $7,000
0.95%
$6,500
$1,037 $1,144 $1,141
$924 0.90%
$783 $6,000
0.85% $5,500
2014 2015 2016 2017 2018 2014 2015 2016 2017 2018
Note: Numbers may not sum due to rounding
Note: For footnoted information, refer to slide 52
18We are being intentional in our positioning across production, servicing, and our portfolio
Key business drivers ($B, except ratios where otherwise noted)
2017 2018 YoY Δ
Total mortgage origination volume $98 $79 (19%)
Home Lending Consumer origination volume $40 $38 (5%)
Production Correspondent origination volume $57 $41 (28%)
Total market mortgage origination volume1 $1,810 $1,630 (10%)
Home Lending Total loans serviced (end of period) $816 $790 (3%)
Servicing Foreclosure units (K, end of period) 35 25 (29%)
30+ delinquency rate2 4.97% 3.56% (28%)
Home Lending loans (average) $237 $242 2%
Home Lending
Home Lending core loans (average) $170 $188 11%
Loans
Home Lending net charge-off / (recovery) rate3 0.03% (0.02%) (5) bps
Note: Numbers may not sum due to rounding
1 Source: Inside Mortgage Finance ("IMF")
2 Based on number of loans serviced. Includes foreclosures and second liens and excludes REO inventory
3 Excludes the impact of PCI loans and reperforming and non-performing loan sales
19We have successfully rebalanced our loan portfolio
Home Lending average loan balances ($B)
2014 – 2018 CAGR
Core Non-core
$232 $242 Total: +7%
$53 Non-core1:
We have recalibrated our
$183 (17%)
$81 portfolio from ~40% to ~80%
core between 2014 and 2018
$114
We will continue to manage our
$188 Core2: +29% core and non-core loan balances
$151
to optimize liquidity and capital
efficiency
$69
2014 2016 2018
% of originations
33% 49% 44%
retained3
Note: Numbers may not sum due to rounding
1 Non-core loans include runoff portfolios, which are predominantly discontinued products no longer originated and PCI loans
2 Core loans primarily include loans held in Real Estate Portfolios, as well as loans residing in Home Lending Production and Home Lending Servicing, which are predominantly prime mortgage loans repurchased from
Government National Mortgage Association (“Ginnie Mae”) pools, which are insured by U.S. government agencies 20
3 Excludes Home Equity and Private Bank loansPortfolio credit quality continues to improve and is extremely strong…
% of Home Lending portfolio with FICO < 700
Home Lending1 30+ delinquency rate Home Lending net charge-off / (recovery) rate2 and CLTV > 80%3
3.0%
(52) bps (~90%)
0.50%
2.0% Reflects the
impact of
Hurricanes Irma
and Harvey
1.0% 0.23%
0.11%
0.03%
FY18
0.0%
4Q14 4Q15 4Q16 4Q17 4Q18 FY14 FY15 FY16 FY17 (0.02%) 2014 2018
1 Excludes PCI loans and mortgage loans insured by U.S. government agencies that are 30 or more days past due. These amounts have been excluded based upon the government guarantee
2 Excludes the impact of PCI loans and reperforming and non-performing loan sales
3 Excludes Private Bank, PCI, and mortgage loans insured by U.S. government agencies
21…and we continue to de-risk our servicing business, which will protect us in a downturn
30+ delinquency rate2 for Chase
2014 – 2018 Chase servicing book activity servicing book vs. industry3 (%) Servicing cost per unit ($)4
“Coming In” Dec. 2014 through Dec. 2018 Industry 3 Chase
Units 30+ delinquency rate1 (24) bps
(~30%)
New originations ~1.3mm 0.71%
(72) bps
6.50% 6.26%
Acquired servicing ~250K 1.77%
Total “in flows” ~1.6mm 0.88%
4.75%
4.03%
“Going Out” Dec. 2014 through Dec. 2018
Units 30+ delinquency rate1
Run-off ~3.2mm 7.19%
Sales ~600K 29.03%
Total “out flows” ~3.9mm 10.65%
December 2014 September 2018 FY14 FY18
Note: Numbers may not sum due to rounding
Note: For footnoted information, refer to slide 53
22Despite a challenging market, we are committed to delivering for our customers
% of Chase mortgage customers who subsequently Of existing Chase deposit customers
Home Lending Net Promoter Score1 opened other products2, by mortgage satisfaction level3 who opened a mortgage:
All other
4
~2x Top 2 box
2.3x
~80%
Top 2 box4
with
3.2x
~35% ~2x
2.1x Lower deposit Higher investment
attrition rate growth rate
2014 2018 Checking Savings Investment
accounts accounts accounts
1 Net Promoter Score = % promoters minus % detractors. Survey started in August 2012. Survey methodology changed in 3Q14
2 Product penetration is defined as the % of new-to-Chase mortgage customers who opened a particular account within 12 months of origination
3 Customer satisfaction based on internal JPMorgan Chase methodology using a 10-point scale
4 Top 2 box represents “very satisfied”
23We are deepening relationships with our core Home Lending customers, and building on our
existing momentum…
We are focused on deepening relationships with our core Home Lending Growth to-date with our primary bank customers
customers through targeted objectives to meet their unique needs has been strong
Chase purchase mortgage originations volume by
New origination Chase primary bank households1 ($B)
Households
capture rate3
~30%
Chase households with an existing
Chase mortgage ~20%
~4mm
Chase primary bank households1
with a non-Chase mortgage ~10%
~6mm
Chase primary bank households1 who 2016 2017 2018
are potential first-time home buyers ~10%
~3mm2 ~3x the growth rate of purchase market4 from 2016
to 2018
These core Home Lending customers represent a significant financial opportunity for Chase
Note: For footnoted information, refer to slide 54
24…by simplifying the digital mortgage process and providing differentiated experiences for Chase
customers
… and have a foundation of differentiated solutions
We offer a digitally-enabled fulfillment process through Chase MyHome1 … to deliver to Chase customers
Transparent
Customers can keep track of ✓ Prefilled applications
action items and deadlines to streamline the home loan process
✓ ~40% of funded applications
used Chase MyHome in 4Q18
Connected
Customers can use phone to ✓ Automatic verification
take pictures of documents and of income and employment
upload to Chase MyHome ✓ >20% faster cycle time2
✓ Personalized pre-approved
Convenient Home Lending offers
Customers can e-sign
✓ Customer satisfaction at record
documents
highs
✓ On-time closing guarantee
for home purchase loans
Example of prefilled application
using Chase customer data
These solutions will allow us to improve customer experiences and reduce costs
1 Launch completed in 3Q18
2
25
2018 average for Consumer purchase and refinance as compared to paperWe continue to build a high-quality, customer-focused Home Lending business
Maintain excellent origination
credit quality ✓ We are taking a disciplined approach to growth
Improve quality of servicing
portfolio and de-risk the Our portfolio de-risking positions us well through the credit cycle, and we plan to maintain credit
✓
business quality at this level
Continue to focus on delivering
✓ Customer satisfaction continues to improve
a great customer experience…
…while innovating to win with We are investing in enhancements to deliver a differentiated home buying experience for Chase
Chase primary bank customers ✓
customers
26Agenda
Page
1 Overview 1
2 Consumer Banking 10
3 Home Lending 17
4 Card 27
5 Closing remarks 42
6 Notes 43We are executing on a clear strategy
Build scale with great products Invest in Deliver
and marketing product valuable
launches and customer-
partner centric
Engage our customers to drive renewals High offerings
quality
profitability and lower attrition growth
Deepen relationships across the
Increase multi-product
franchise
relationships
Deepen
27Scale
Our sustained investment in products and customer acquisition has created tremendous scale
We launched several compelling, new products… We are operating from a position of strength
in credit card spend (22% share)2 and
Freedom Unlimited ® Sapphire Reserve ® Ink Business
#1 outstandings (17% share)3
(2016) (2016) Unlimited ®
(2018)
…and renewed and refreshed our #1 cobrand portfolio1
~40mm active credit card accounts4
Amazon Prime ®
(2017)
Avios ®
Hyatt ®
(2018)
~8mm new accounts in 20185
(2018)
Marriott ®
~9B credit card transactions in 2018
IHG ® Rewards Southwest ® United ®
Club (2018) (2018) (2018)
(2018)
Note: For footnoted information, refer to slide 55
28Scale
This scale enables strong top-line account, sales, outstandings, and revenue growth
Active accounts Sales volume1 EOP outstandings Revenue
6% CAGR 2% CAGR
10% CAGR 5% CAGR
2014 2018 2014 2018 2014 2018 2014 2018
Select examples of growth drivers
New products and Investment in Proactive line
Pricing for value
cobrand renewals Ultimate Rewards® management
Efficient marketing Digital and engagement
Advanced analytics Annual fee products
and retention enhancements
1 Excludes Commercial Card
29Scale
Importantly, our scale has also created cost efficiencies
Increased operating leverage Improved operating efficiency
Overhead ratio Contact cost per statement1
(1ppt)
(1ppt) (10%)
2014 2018 2019E 2014 2018
Improved marketing efficiency Reduced fraud losses
Credit card sales generated per dollar spent on Fraud losses as a % of sales3
acquisition marketing2
(29%)
8%
2014 2018 2014 2018
Note: For footnoted information, refer to slide 56
30Engage
Our experience has shown the value of engaging our large customer base
Ultimate Rewards® redeemers have higher sales and revenue, with lower attrition1,2
Annual sales Annual revenue 12-month attrition
2.0x 4.0x
4.2x
1.4x
2.2x
1.6x
None One Multiple None One Multiple None One Multiple
Multi-redeemers have Multi-redeemers generate Non-redeemers are
>4x 2x 4x
the spend of non-redeemers the revenue of non-redeemers more likely to close within one year
1 Defined as customers who have redeemed points through the Ultimate Rewards® portal. Non-redeemers have redeemed 0 times, single-redeemers 1 time, and multi-redeemers 2+ times in the 2-year period from Jan. '15 to Dec. '17
2 Reflects FY18 for sales and revenue; as of Dec. ’18 for attrition
31Engage
We have three fundamental levers to drive engagement
Engagement
Innovative products Loyalty
Experiences
Bringing best-in-class products Moving beyond points to strengthen
Building everyday customer experiences
to our customers customer loyalty
Scale
32Engage
SM
My Chase Plan will make borrowing easier for our customers
For planned purchases with a payment plan at a reasonable cost
Opportunity:
outstandings held off-us
~$250B by existing customers1
1 Total outstanding balances on non-Chase cards by existing Chase consumer card customers; as of December 2018
33Engage
SM
My Chase Loan will enable our customers to better use their existing line to borrow
For larger purchases, including non-cardable spend, with
equal payments at a competitive rate
Opportunity:
outstandings held off-us
~$250B by existing customers1
1 Total outstanding balances on non-Chase cards by existing Chase consumer card customers; as of December 2018
34Engage
SM
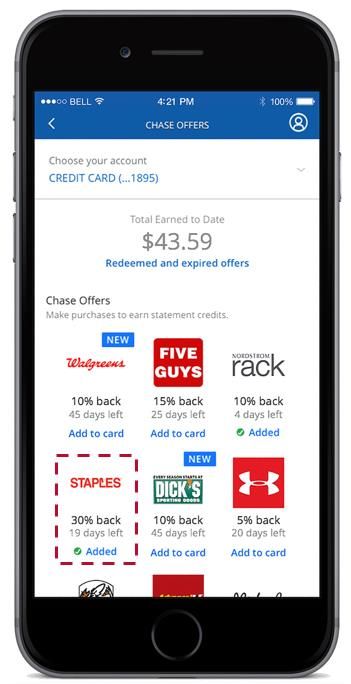
Chase Offers has seen tremendous engagement in the first few months
SM
Chase Offers
Providing both customers and merchants with real value
1 Chase connects customers 2 Customers love getting money
to merchants who deliver in their pocket and continue to
real value through Offers frequently engage
Chase
SM
Offers
4 Merchants provide more value, 3 Merchants benefit from
causing more customers to increased engagement
engage
Rapidly scaled with ~7mm cards activating 25mm+ Chase OffersSM in the 3 months since launch
Note: Simulated screen
35Engage
SM
Credit Journey drives repeat customer engagement and familiarity with Chase for prospects
Credit Journey SM will deliver value for our customers and returns for the franchise
Access to your credit score View historical scores and see Receive tailored pre-approved offers
and identity protection factors impacting your score for the full suite of Chase products
Over 15mm customers and non-customers enrolled
Note: Simulated screens. Illustrative offers
36Engage
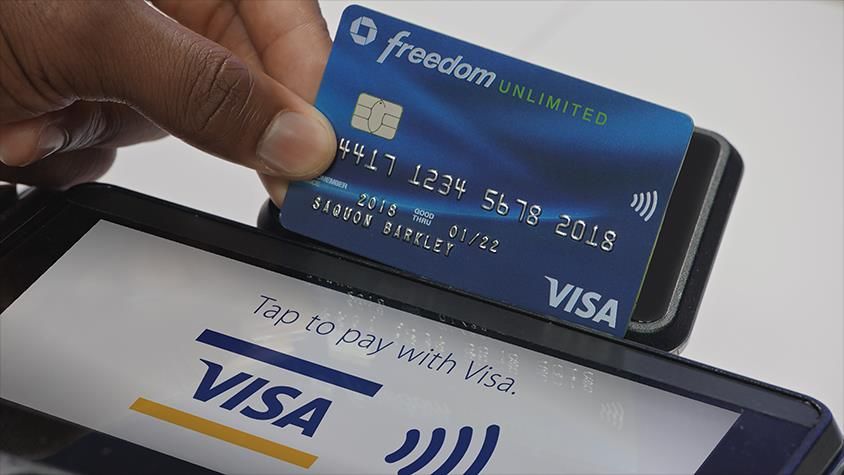
Tap to pay makes using your Chase card faster and simpler
Chase customers can “tap to pay” using contactless cards Tap to pay has already experienced meaningful adoption
Customer adoption of tap to pay vs. digital wallet1
2.4x
Digital wallet Tap to pay
Tap to pay already exceeding digital wallet penetration for customers who have contactless cards
Note: The Contactless Symbol and Contactless Indicator are trademarks owned by and used with the permission of EMVCo, LLC
1 Reflects percentage of Chase consumer card customers who used POS contactless functionality / digital wallets from Jan. 14, 2019 – Feb. 12, 2019, out of all customers who were shipped a contactless card before Jan. 13, 2019
37Deepen
Engagement improves our ability to deepen relationships across Chase
Likelihood to adopt a second product1:
Spend engagement2 Mobile activity3 Credit JourneySM enrollment4
~2x ~2x
~1.5x
Low engaged High engaged Mobile inactive Mobile active Not enrolled in Credit Enrolled in Credit
Journey Journey
More profitable More satisfied
Card households that adopt a
non-card Chase product are…
2.6x 4pts …than Card-only
households
more in pretax income5 higher NPS6
Note: For footnoted information, refer to slide 57
38Deepen
Deepened relationships give us unique risk management advantages
Critical components of disciplined underwriting… …drive better risk decisions
Approval rate1
Continually improving early warning systems
Detection
Improved monitoring ~2.5x
leveraging expanded
data sources
Non-card Chase
No deposit relationship Deposit relationship
Decision relationships
Methodical management Data from existing deposit
routine and rigor relationships creates
a competitive advantage for Card NCO rate2
risk management
~(30%)
Execution
Improved reaction
time and collection
capabilities
No deposit relationship Deposit relationship
1 Full-year 2018. Card approval rate for customersWe are prepared for any economic scenario with strong risk management capabilities
New risk monitoring capabilities enable surgical pullbacks… …which improved portfolio NCOs with limited impact to growth
Data for the Net charge-offs (%) 1
Portfolio Portfolio without pullback
example
customer Jane
3.15%
2007 Today 3.10%
Internal risk scores ✓ ✓ 3.05%
Off-us data Point-in-time Trends 3.00%
2.95%
On-us data trends
(e.g., DDA information) ✓ 2.90%
Conservative balance 2.85%
transfer product design ✓ 2.80%
Geographic 2.75%
segmentation ✓ ✓ 2.70%
Customer ‘balance 2.65%
sheet’ ✓ 2.60%
(e.g., debt servicing abilities)
2016 2017 2018
1 Based on JPMorgan Chase internal analysis
40Our clear strategy, risk management, and franchise differentiators will ensure high quality growth
We have a clear strategy to scale, engage, and deepen… … and all the ingredients for sustainable success
Unmatched scale and distribution
Proprietary rewards platform
Invest in Deliver
Full set of banking products
product valuable
launches and customer-
Strong brand across premium and mass
partner High centric
renewals quality offerings
Best-in-class cobrand partners
growth
Largest network acceptance
Increase multi-product
relationships
Deepen
41Agenda
Page
1 Overview 1
2 Consumer Banking 10
3 Home Lending 17
4 Card 27
5 Closing remarks 42
6 Notes 43We remain focused on executing against our strategy
Drive engagement by introducing innovative lending products, strengthening customer loyalty and
Deliver One Chase experiences to creating everyday customer experiences
grow from a position of strength
Expand branch network to 15 – 20 new markets, allowing us to reach 80mm more U.S. consumers
Scale digital tools and resources to better meet our customers’ financial needs
Create interoperability between
physical and digital channels Integrate digital platform with branch network to win with our primary bank customers
Continue to migrate transactions to lower cost channels and drive operational efficiencies
Manage expenses while
continuing to invest in the future Deploy a smarter, leaner branch footprint across existing and expansion markets
Take a disciplined approach to growth to remain well positioned through the cycle
Operate an effective and efficient
risk and control environment Continuously monitor our credit portfolios
We will continue to invest in order to deliver the power of One Chase to our customers
42Agenda
Page
1 Overview 1
2 Consumer Banking 10
3 Home Lending 17
4 Card 27
5 Closing remarks 42
6 Notes 43Notes on slide 2 – We have made significant progress against our commitments
1. Source: FDIC 2018 Summary of Deposits survey per S&P Global Market Intelligence. Excludes non-retail branch locations and all branches with $500mm+ in deposits within the last two years
(excluded branches are assumed to include a significant level of commercial deposits or are headquarter branches for direct banks). Includes all commercial banks, credit unions, savings
banks, and savings institutions as defined by the FDIC
2. Based on 2018 sales volume and loans outstanding disclosures by peers (C, BAC, COF, AXP, DFS) and JPMorgan Chase estimates. Sales volume excludes private label and Commercial
Card. AXP reflects the U.S. Consumer segment and JPMorgan Chase estimates for AXP’s U.S. small business sales. Loans outstanding exclude private label, AXP Charge Card, and Citi
Retail Cards
3. As of February 2019
43Notes on slide 7 – Our investments made it easier for customers to self-serve and enabled
operational efficiencies and workforce transformation, which have lowered costs
1. Cost to serve defined as total CCB expense less investments, auto lease depreciation, legal losses, and FDIC surcharge. Cost to serve efficiency ratio reflects cost to serve expense divided by
revenue net of auto lease income
2. Includes employees and contractors. 2014 excludes Commercial Card headcount. During 3Q18, ~1,200 employees transferred from CCB to CIB as part of the reorganization of the
Commercial Card business
3. Reflects transactions within Consumer Banking in 2018
4. Reflects changes from 2014 to 2018
5. Includes calls from Consumer Banking, Credit Card, and Auto customers
44Notes on slide 9 – The power of our digital platform 1. Users of all web and/or mobile platforms who have logged in within the past 90 days 2. Reflects 90-day digital logins among 90-day active users divided by three to estimate average monthly logins. Data reflects December 2016, December 2017, and December 2018 for all CCB 3. Reflects Consumer Banking. Consumer Banking household channel segments are defined based on the tenure of the household as of the respective time period. For households with tenure of greater than 12 months, we use the following thresholds calculated over a year: Digitally-centric – 4 branch visits and 12+ digital transactions or 100+ digital log-ins or 24+ external ACH transactions per year; Branch-centric – >4 branch visits and
Notes on slide 10 – We have made significant progress against our priorities
1. Represents average deposits and end of period investment balances

2. Includes Consumer Banking households

3. Represents Consumer Banking customers that are 90-day mobile-active six months after account opening. Includes Consumer Banking customers whose first product was a checking account
   opened between July 2017 and June 2018

4. Consumer Banking 90-day mobile-active users in December 2018 compared to December 2017

5. Decrease in the annual variable cost per Consumer Banking household from 2014 to 2018. Includes variable teller transaction cost (includes cost of teller FTE), cost of other transactions,
   variable account servicing cost, and variable risk and compliance cost

6. All teller transactions in Chase branches

                                                                                                46
Notes on slide 11 – We continue to grow our business at an industry-leading pace, winning with
both new and existing customers
1. #1 in absolute deposit dollar balance growth from 2014 to 2018. Source: FDIC 2018 Summary of Deposits survey per S&P Global Market Intelligence. Excludes non-retail branch locations and
all branches with $500mm+ in deposits within the last two years for 2017 to 2018 comparison and the last 10 years for the 2014 to 2018 comparison (excluded branches are assumed to
include a significant level of commercial deposits or are headquarter branches for direct banks). Includes all commercial banks, credit unions, savings banks, and savings institutions as defined
by the FDIC; National banks (BAC, WFC, C, USB, PNC, TD, and COF) include institutions with over $200B in total deposits as reported by the FDIC (excluding non-retail locations), Super
Regional banks include remaining institutions in the top 50 based on total deposits as reported by the FDIC (excluding non-retail locations)
2. Kantar TNS (“TNS”) Retail Banking Monitor. Based on Chase footprint (28,728 surveys in 2018 and 2017). Calculations derived from the following questions (answered by 1,383 customers in
2018 and 2017): “Which is your primary bank?" and “In what year did [selected bank] become your primary bank?“ Data is weighted by TNS to ensure the survey is representative of the U.S.
population
3. Represents Consumer Banking households six months after account opening. Includes Consumer Banking households whose first product was a checking account opened between July 2017
and June 2018. Balances refer to checking deposit balances for new households
4. Consumer Banking overall satisfaction (“OSAT”) metric. Branch OSAT is based on over 600,000 customer surveys conducted after a visit to a Chase branch each year. Customers rate their
visit on a 1-10 scale. OSAT score is calculated by the proportion of 9 and 10 scores
5. Attrition rates are based on Consumer Banking households with deposit products and include households that closed all their deposit products with Chase. Attrition rate calculated by taking an
average of the annualized monthly rates for the 12 months of each year
47Notes on slide 12 – Our investments in digital platforms and functionality have made it easier for
customers to self-serve
1. Based on 4Q18 peer disclosure for JPM's Consumer & Community Banking, BAC's Consumer Banking, WFC's Community Banking and Citi’s North America GCB segments. #1 growth in
terms of incremental number of mobile users from 2017 to 2018
2. Mobile logins per month reflect 90-day logins among 90-day active users divided by three to estimate average monthly logins. Data reflects December 2017 and December 2018. Consumer
Banking customers only
3. Reflects 90-day active users in December 2018 and December 2017. Consumer Banking customers only
4. Total check deposit transactions through QuickDeposit as a proportion of total check deposit transactions in 2018 and 2017. Includes deposit transactions that combine cash and check. Based
on number of transactions, not number of checks. Consumer Banking customers only
48Notes on slide 13 – Our physical network has been critical to achieving industry-leading deposit growth 1. Average teller transactions among all Consumer Banking customers. Represents 4Q14 and 4Q18 2. Novantas Customer Knowledge, 2018 U.S. Shopper Study. Prospective switchers (N=4,866). Convenient branch locations ranked top among “Reasons for Future Consideration” 3. Consumer Banking households who visited a branch at least once in 2018 4. Deposit growth from 4Q14 to 4Q18. Includes multi-channel and branch-centric channel segments. Consumer Banking household channel segments are defined based on the tenure of the household as of the respective time period. For households with tenure of greater than 12 months, we use the following thresholds calculated over a year: Digitally-centric – 4 branch visits and 12+ digital transactions or 100+ digital log-ins or 24+ external ACH transactions per year; Branch-centric – >4 branch visits and
Notes on slide 14 – We are innovating across our channels and throughout the customer lifecycle
1. Median existing customer opened account via Digital Account Opening (“DAO”) in ~3 minutes. Median new-to-bank customer opened account via DAO in ~5 minutes. Does not include time to
   open an account via in-branch DAO

2. As of February 2019

3. When customers initiate an external transfer to a Real-Time Payments (RTP) network enabled bank, they have the option to use RTP, which settles within 15 seconds

4. Proportion of 4Q18 teller transactions that were eligible to be completed at an ATM

5. Includes multi-channel and digitally-centric channel segments; Consumer Banking customer channel segments are defined based on the tenure of the customer as of the respective time
   period. For customers with tenure of greater than 12 months, we use the following thresholds calculated over a year: Digitally-centric – 4 branch visits and 12+ digital transactions or 100+ digital log-ins or 24+ external ACH transactions per year; Branch-
   centric – >4 branch visits and
Notes on slide 15 – We are effectively expanding our physical network to attractive new markets
1. FDIC 2018 Summary of Deposits survey per S&P Global Market Intelligence. Excludes non-retail branch locations and all branches with $500mm+ in deposits within the last two years
   (excluded branches are assumed to include a significant level of commercial deposits or are headquarter branches for direct banks). Includes all commercial banks, credit unions, savings
   banks, and savings institutions as defined by the FDIC

2. 2018 U.S. population sourced from U.S. Census Bureau. Sum of population of states in which Chase currently has or will have a branch presence post market expansion

3. Reflects 2014-2018 growth in the top 10 deposit markets as of 2018. Source: FDIC 2018 Summary of Deposits survey per S&P Global Market Intelligence. Excludes non-retail branch locations
   and all branches with $500mm+ in deposits within the last 10 years (excluded branches are assumed to include a significant level of commercial deposits or are headquarter branches for direct
   banks). Includes all commercial banks, credit unions, savings banks, and savings institutions as defined by the FDIC

                                                                                               51
Notes on slide 18 – The home lending industry is in a state of transition
1. Source: Inside Mortgage Finance (“IMF”)
2. Source: Freddie Mac Primary Mortgage Market Survey (“PMMS”). Represents 30-year fixed rate
3. Source: JPMorgan Chase Securitized Products Group (“SPG”) Research. Represents Fannie Mae 30-yr current coupon rate
4. Source: Reflects weighted average Retail expense for Large Banks peer group as defined by the Mortgage Bankers Association (MBA) and STRATMOR Peer Group Roundtables (PGR)
program. 2018 reflects first half annualized
52Notes on slide 22 – …and we continue to de-risk our servicing business, which will protect us in a
downturn
1. 30+ delinquency rate for total "in flows" as of December 2018. Total "out flows" at time of transfer
2. Source: IMF. Includes all loans past due and in foreclosure
3. Industry defined as Large Servicer Delinquency Index reported by IMF
4. Driven by mix
53Notes on slide 24 – We are deepening relationships with our core Home Lending customers, and
building on our existing momentum…
1. Primary relationship based on internal JPMorgan Chase definition
2. Based on JPMorgan Chase internal analysis
3. Represents Chase’s percentage share of targeted customers who originated a purchase or refinance mortgage between January 2018 and November 2018. Calculation based on JPMorgan
Chase internal data and CoreLogic data
4. Source: IMF
54Notes on slide 28 – Our sustained investment in products and customer acquisition has created
tremendous scale
1. “Credit Card Market: Cobrand Market Share by Issuer,” Phoenix, October 2018. For 1H18, based on number of accounts, total spend, and revolving balance dollars
2. Represents 2018 share of general purpose credit card ("GPCC") spend, which excludes private label and Commercial Card. Based on company filings and JPMorgan Chase estimates
3. Represents 2018 share of loans outstandings, which excludes private label, AXP Charge Card, and Citi Retail Cards. Based on company filings and JPMorgan Chase estimates
4. Average number of active credit card accounts per month in 2018. Active defined as those that have at least one credit card sales transaction in respective month
5. Excludes Commercial Card
55Notes on slide 30 – Importantly, our scale has also created cost efficiencies
1. Reflects customer service expense per statement
2. Reflects year 3 sales on domestic acquisitions. Acquisition marketing excludes media
3. Fraud losses exclude disputes
56Notes on slide 38 – Engagement improves our ability to deepen relationships across Chase
1. Analysis shows difference in percentage of in-footprint, Chase consumer card-only customers, who opened a deposit relationship after 18 months, as of June 2017
2. Low-spend engagement is defined as annual spend 75% across 12 months prior to June 2017
3. Defined as at least one mobile sign-on in June 2017
4. Defined as enrolled in Credit Journey in or before June 2017
5. Analysis shows difference in full year average pretax income, Jan. – Dec. 2018, for households that are engaged with 2 or more products across lines of business vs. Card-only, engaged
households
6. Analysis shows difference in NPS, based on Jan. – Dec. 2018 responses, for households that are engaged with 2 or more products across lines of business vs. Card-only, engaged households
57You can also read