IN SITU XPS STUDIES OF MOS 2-BASED CO 2 HYDROGENATION CATALYSTS - IOPSCIENCE
←
→
Page content transcription
If your browser does not render page correctly, please read the page content below
Journal of Physics D: Applied Physics

PAPER • OPEN ACCESS

In situ XPS studies of MoS2-based CO2 hydrogenation catalysts
To cite this article: Gernot Pacholik et al 2021 J. Phys. D: Appl. Phys. 54 324002

View the article online for updates and enhancements.

                                This content was downloaded from IP address 46.4.80.155 on 05/08/2021 at 18:35
Journal of Physics D: Applied Physics
J. Phys. D: Appl. Phys. 54 (2021) 324002 (9pp) https://doi.org/10.1088/1361-6463/ac006f
In situ XPS studies of MoS2-based CO2
hydrogenation catalysts
Gernot Pacholik, Ludwig Enzlberger, Anna Benzer, Raffael Rameshan,
Markus Latschka, Christoph Rameshan and Karin Föttinger∗
Institute of Materials Chemistry, Technische Universität Wien, Getreidemarkt 9/BC, 1060 Wien, Austria
E-mail: karin.foettinger@tuwien.ac.at
Received 17 February 2021, revised 15 April 2021
Accepted for publication 12 May 2021
Published 2 June 2021
Abstract
Various formulations of Co, Ni and K modified MoS2 -based catalysts were synthesized
hydrothermally and compared in their catalytic performance in CO2 hydrogenation at 21 bar
and 220 ◦ C–330 ◦ C. The products were CO, CH4 and methanol. The addition of K reduced the
selectivity to CH4 and moved the maximum of the methanol formation rate to a higher
temperature. The materials were characterized by N2 physisorption, temperature programmed
oxidation, temperature programmed reduction, and x-ray diffraction spectra (XRD). Under
reducing conditions the catalysts were stable until 700 ◦ C and under oxidizing conditions until
300 ◦ C. XRD had shown mainly a MoS2 phase, as well as metal sulfide in the cobalt and nickel
promoted catalysts. Different species of Mo and O were observed under reaction conditions by
in situ x-ray photoelectron spectroscopy (XPS). When switching from H2 to CO2 + H2 an
increase in the amount of oxygen, both lattice oxygen and surface adsorbates, was observed as a
consequence of CO2 addition and H2 O formation in the reaction. The amount of lattice oxygen
correlates with the minor amount of Mo(VI) detected. Increasing reaction temperature and thus
conversion led to an increase of the O 1s signals at 533 eV assigned to surface OH, formate and
adsorbed H2 O. XPS measurements in CO2 + H2 feed showed an effect of K addition on the
adsorbate-related O 1s peak, which appeared at lower binding energy (532 eV) and was assigned
to carbonates. This may indicate a different reaction mechanism in the presence of the promoter.
Supplementary material for this article is available online
Keywords: molybdenum sulfide, CO2 hydrogenation, promoter, methanol, CO, NAP-XPS
(Some figures may appear in color only in the online journal)
1. Introduction based catalysts were tested in their activity to produce valu-
able compounds like CO and methanol out of CO2 and H2 .
CO2 is a well-known greenhouse gas and the amount in The aim was to test catalysts that are tolerant to possible sulfur
the atmosphere is still rising. Carbon capture and utilization, contaminants in the reaction gas. This is of interest for using
which includes heterogeneous catalytic hydrogenation, is an flue gas directly without additional purification steps. MoS2
approach to reduce CO2 emissions [1]. In this work, MoS2 based catalysts promise to fulfill this criterium [2]. Both CO
and methanol are valuable base chemicals for the chemical
∗
industry [3].
Author to whom any correspondence should be addressed.
Reactions occurring on these catalysts are the
reverse water–gas shift RWGS (CO2 + H2 ⇌ CO +
Original content from this work may be used under the terms
of the Creative Commons Attribution 4.0 licence. Any fur-
H2 O), methane formation (CO2 + 4H2 ⇌ CH4 + 2H2 O)
ther distribution of this work must maintain attribution to the author(s) and the and methanol synthesis (CO2 + 3H2 ⇌ CH3 OH + H2 O)
title of the work, journal citation and DOI. [4–7].
1361-6463/21/324002+9$33.00 1 © 2021 The Author(s). Published by IOP Publishing Ltd Printed in the UK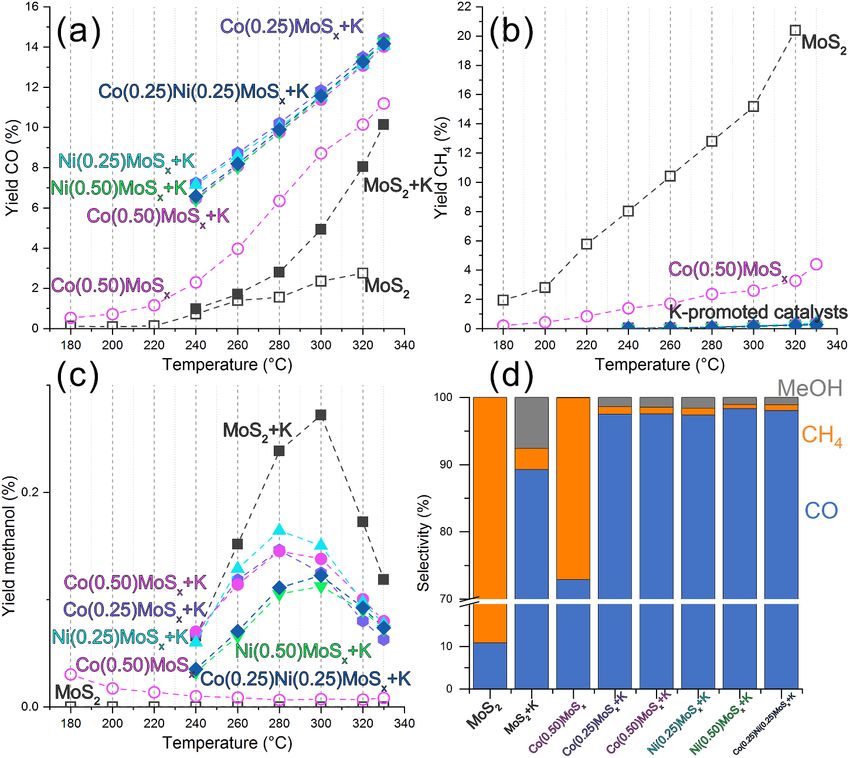
J. Phys. D: Appl. Phys. 54 (2021) 324002                                                                                   G Pacholik et al

    MoS2 catalysts are known for their activity in hydrodesul-          2.2. Materials characterization
furization, CO hydrogenation and in more recent publications
                                                                        2.2.1. N2 physisorption.     Adsorption-desorption isotherms
also for CO2 hydrogenation [8–12]. The conversion of CO to
                                                                        were recorded with a Micromeritics ASAP 2020 at 77 K.
higher alcohols has been described over MoS2 in literature.
                                                                        Brunauer–Emmet–Teller method was used to calculate the
A recent publication of Zeng et al described the formation
                                                                        specific surface area and the Barrett–Joyner–Halenda model
of C3+ alcohols over K-promoted MoS2 . While the unpro-
                                                                        was used to determine the average pore diameter and volume
moted catalyst showed a low selectivity to liquid oxygenates,
                                                                        from the desorption branch. For pretreatment the samples were
K-promoted catalysts enabled a higher selectivity to higher
                                                                        heated for 3 h to 300 ◦ C in vacuum.
alcohols [13].
    Liu and Liu performed mechanistic studies of methanol
formation from CO2 and H2 over a modified Mo6 S8 cluster by
density-functional theory (DFT) calculation. They found that            2.2.2. TPO/TPR.      TPO was performed in a gas mixture of
the Mo6 S8 cluster is able to change its catalytic properties by        20% oxygen in argon with a flow of 25 ml min−1 . Temperature
metal modification via two effects. First, electron transfer from       programmed reduction was done in 60% hydrogen in argon.
M to Mo6 S8 takes place and reduces the Mo cation. Second,              100 mg of the pure sample was used and heated with a ramp
the metal directly participates in the reaction. Depending on           of 5 ◦ C min−1 . The produced gas was analyzed by mass spec-
the type of metal, different reaction mechanisms take place             trometry (Pfeiffer Vacuum QMA 200 with tungsten filament
[14].                                                                   and SEM detector).
    Several reaction pathways have been suggested for meth-
anol formation. Methanol can be produced by the reverse
water–gas shift and subsequent CO hydrogenation, or dir-                2.2.3. XRD.    The XRD spectra were recorded with a PANa-
ectly via the formate pathway. Co and Ni promoted Mo6 S8                lytical Empyrean in Bragg–Brentano geometry. A Cu-LLF
clusters follow a modified formate pathway. In this process,            x-ray tube (CuKα λ1 = 1.5406 A, λ2 = 1.5444 A) was used
the ∗ HCOOH species is directly hydrogenated to ∗ H2 CO,                as an x-ray source and operated at 45 kV and 40 mA. The scan
∗
  H3 CO and CH3 OH. In the two-step reaction, CO is formed              range 2Θ was 10◦ –90◦ and a GaliPIX detector was used.
via carboxyl intermediates (∗ HOCO) in the first step, which
is then converted to CH3 OH via ∗ HCO, ∗ H2 CO and ∗ H3 CO
intermediates. Liu and Liu predicted the two-step pathway for           2.3. Catalytic measurements
K-promoted MoS2 [14, 15].                                               The measurements were carried out in a fixed bed plug flow
    Nieskens et al used CoMoS catalysts to produce higher               steel reactor using a ‘micro effi’ (PID Eng&Tech) system. 1 g
alcohols from CO2 and H2 . A pressure of about 100 bar                  of pure catalyst was used. Before the catalytic measurement,
and temperatures of 310 ◦ C and 340 ◦ C were used. The                  the catalyst was treated at 21 bar with pure hydrogen at 400 ◦ C
products were mainly CO, alcohols and CH4 [4]. Liu et al                for 4 h. For performing the catalytic reaction, the gas mixture
studied Mo–Co–K sulfide catalysts for CO2 hydrogena-                    was 20% CO2 , 60% H2 and 20% He at 21 bar with a total flow
tion. Under optimal conditions higher alcohol formation                 of 5 mlN min−1 .
was observed. Different products were obtained depending                   The products were detected by an Inficon Micro GC 3000
on the promoter. K-promoted catalysts produced alcohols,                with a Plot Q column.
whereas catalysts without K formed mainly hydrocarbons and
CO [5].
    In this work, several promoted MoS2 based catalysts were
                                                                        2.4. In situ XPS
tested for their activity in CO2 hydrogenation and studied by
in situ XPS. The materials were also characterized by XRD,              For in situ XPS measurements a lab-based near ambient-
N2 physisorption, temperature programmed oxidation (TPO)                pressure XPS (NAP-XPS) system from SPECS (Berlin,
and temperature programmed reduction (TPR).                             Germany) with a custom built sample stage (optimized for
                                                                        catalytic measurements) was used [16]. A XR 50 microfo-
                                                                        cus x-ray source provided monochromatic Al Kα (1486.6 eV)
2. Experimental
                                                                        radiation. Photoelectrons were detected by a Phoibos 150 NAP
                                                                        hemispherical analyzer. The recorded data was analyzed using
2.1. Catalyst synthesis
                                                                        the CasaXPS software (Casa Software Ltd, Teignmouth, UK).
The catalysts were synthesized by a hydrothermal synthesis              A linear or Shirley background was added and peaks were
route. Ammonium molybdate, thiourea and the metal nitrate               fitted with Gauss–Lorentz (GL) sum functions. Mo(IV) 3d5/2
were dissolved in water and heated for 16 h at 200 ◦ C. After           was used for calibration at a binding energy of 229.14 eV [17].
that, the product was cooled to room temperature, separated by              About 75 mg of the sample was pressed into a pellet (dia-
centrifugation and washed three times with water. After drying          meter ∼7 mm). The pellet was mounted on a steel backplate
for 2 h at 125 ◦ C, potassium carbonate was added by impregna-          on a quartz sample holder. Mo 3d, O 1s, S 2p and C 1s spec-
tion of a saturated potassium carbonate solution. The powder            tra were recorded. The pretreatment was done at 400 ◦ C in
was dried overnight. The catalysts were calcined at 500 ◦ C for         0.75 mbar H2 . Reaction conditions were 1 mbar reaction mix-
2 h under helium.                                                       ture (CO2 :H2 = 1:3) at 200 ◦ C and 300 ◦ C.

                                                                    2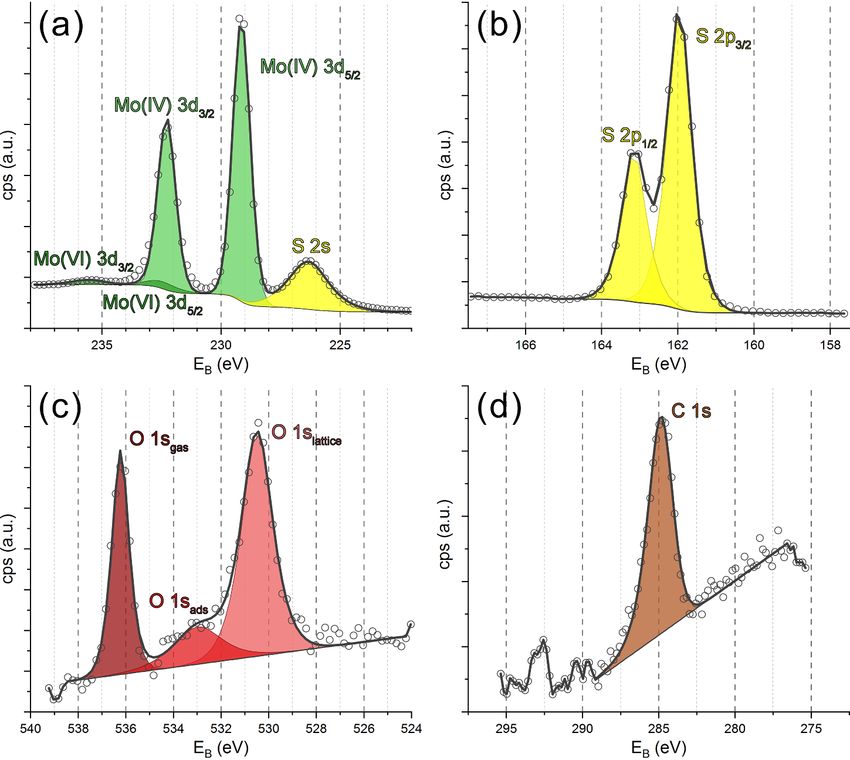
J. Phys. D: Appl. Phys. 54 (2021) 324002 G Pacholik et al
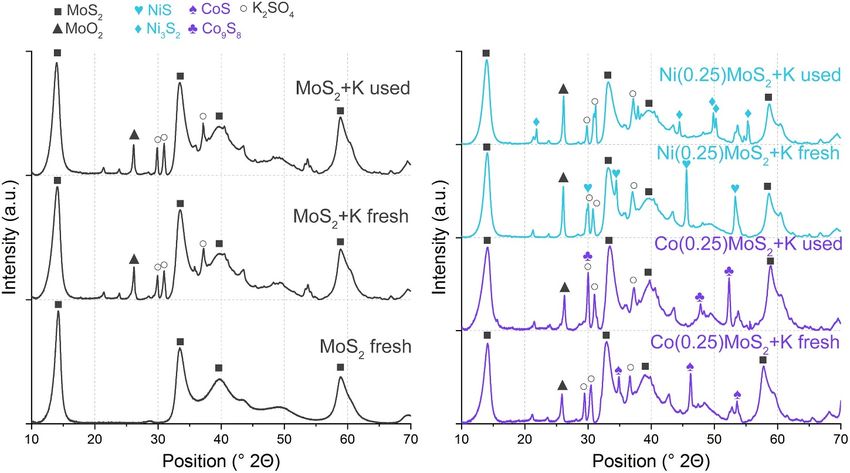
Table 1. Catalysts overview. material, although K2 CO3 was added as a precursor. The used
K/Mo Co/Mo Ni/Mo MoS2 + K catalyst hardly differed from the fresh one. CoS
(molar ratio) (molar ratio) (molar ratio) (PDF 04-003-2150) was found in the fresh Co-promoted cata-
lyst. In contrast, Co9 S8 (PDF 00-056-0002) was found in the
MoS2 0 0 0 used CoMoSx + K catalyst. This reveals a slight loss of sul-
MoS2 + K 0.5 0 0 fur during the reaction. The situation was similar for the Ni-
Co(0.50)MoSx 0 0.5 0 promoted catalysts. While NiS (PDF 04-006-6018) was found
Co(0.25)MoSx + K 0.5 0.25 0
in the fresh catalysts, Ni3 S2 (PDF 04-008-8458) was detected
Co(0.50)MoSx + K 0.5 0.5 0
Ni(0.25)MoSx + K 0.5 0 0.25
in the used catalyst [17–20].
Ni(0.50)MoSx + K 0.5 0 0.5
Co(0.25)Ni(0.25) 0.5 0.25 0.25 3.2. Catalytic activity and selectivity
MoSx + K
Pure MoS2 (K/Mo = 0) mainly produced CH4 and CO. CH4
was the main product (at 280 ◦ C CO:CH4 = 1:8.2), and the
3. Results and discussion production increased strongly with temperature.
Figure 3(a) compares the CO yield for several MoS2 based
We compared the catalytic activity and selectivity for CO2 catalysts at different temperatures. Pure MoS2 showed the
hydrogenation on pure MoS2 to Co, Ni and K promoted MoS2 lowest CO formation activity. More CO was obtained by
catalysts. Different variations of the promoted catalysts were adding K. The Co-promoted catalyst with Co/Mo = 0.50
synthesized, listed in table 1. K was added in a molar ratio of turned out to be even more active towards CO formation
K/Mo = 0.50. For Co and Ni, the molar ratio was 0.25 and (+127% at 280 ◦ C) than the K-promoted MoS2 catalyst. The
0.50 for K-promoted catalysts and 0.50 for MoS2 without K. highest CO yield up to ∼15% was obtained when both K
and Co or Ni were added. There was hardly any difference
in catalysis between Co and Ni promoted MoS2 + K. Also,
3.1. Materials characterization
the promoter content (M/Mo = 0.25 or 0.50) showed no effect
3.1.1. N2 physisorption. Figure 1(a) illustrates the on performance. In addition, the CO yield has shown differ-
Brunauer–Emmett–Teller (BET) surface area of pure and pro- ing temperature dependence. For Co/Ni promoted MoS2 + K
moted MoS2 catalysts. Pure MoS2 exhibited a much higher catalysts, the yield increased almost linearly with temper-
specific surface area compared to K-promoted catalysts. While ature, whereas for MoS2 + K, it exhibited an exponential
unpromoted MoS2 showed a BET surface area of about dependence.
25 m2 g−1 , surface areas of K-promoted MoS2 were in the The production of methane is almost completely preven-
range of approximately 5–10 m2 g−1 . A lower pore volume ted by adding K (figure 3(b)). At 320 ◦ C, a methane yield of
was measured for K-promoted catalysts, indicating a lower about 20% was determined over MoS2 , whereas MoS2 + K
surface area due to blocked pores. This agrees with results showed hardly any formation of CH4 . Only trace amounts of
from the literature [13]. There was no correlation between sur- methane were detected over all K-promoted catalysts. In con-
face area and Co and Ni content. Rietveld refinement showed trast, addition of Co did not completely prevent methane pro-
that the content of Co and Ni sulfide phases was very low. The duction, but reduced it to about 1/6 for MoS2 compared to
presence of additional sulfide phases hardly affects the total Co(0.50)MoSx .
surface area. Formation of small amounts of methanol occurred only
over promoted catalysts. Figure 3(c) summarizes the meth-
anol yields. MoS2 showed no detectable methanol formation.
3.1.2. TPR/TPO. Here, we investigate the stability of
CoMoSx produced some methanol at 180 ◦ C. MoS2 + K
these materials in oxidizing and reducing the atmosphere.
showed the highest yield. The addition of Co and Ni to
Figure 1(b) illustrates the recorded mass m/z of 64 during
MoS2 + K was not beneficial for methanol formation, in con-
heating in O2 /Ar, which is assigned to SO2 . Oxidation of the
trary, CoMoSx + K and NiMoSx + K produced less methanol
sample started at about 280 ◦ C, the peak maximum occurred
than MoS2 + K. The highest yield was found in a temperature
at 355 ◦ C.
range of 280 ◦ C–300 ◦ C.
To investigate how very stable the sample is under reducing
Table 2 lists the product formation rates and table 3 reac-
atmosphere, it was heated in 60% H2 /Ar at 5 ◦ C min−1 while
tion orders at 280 ◦ C. CO formation showed little depend-
recording the mass 34 (H2 S). No reduction was detected up to
ence on CO2 concentration, while for H2 the reaction order of
700 ◦ C.
CO formation was about 1. CO2 concentration also had only
small effects on CH4 and methanol production. The formation
3.1.3. XRD. Fresh and used catalysts were analyzed by of CH4 is, however, strongly dependent on hydrogen concen-
XRD. The diffractograms are shown in figure 2. The MoS2 tration with a reaction order above 1. Also, methanol forma-
catalyst was phase pure (PDF 04-006-0605). Some catalysts tion showed a strong dependence on H2 . While the H2 reaction
contain small amounts of MoO2 (PDF 04-008-4309), which order was 1.5 on MoS2 + K, it was even higher with 2.6 and
may have been formed by residual oxygen during calcina- 2.7 for Co(0.50)MoSx + K and Ni(0.25)MoSx + K, respect-
tion. K2 SO4 (PDF 04-006-8317) was found in the K-promoted ively. The differences in H2 and CO2 orders for catalysts with
3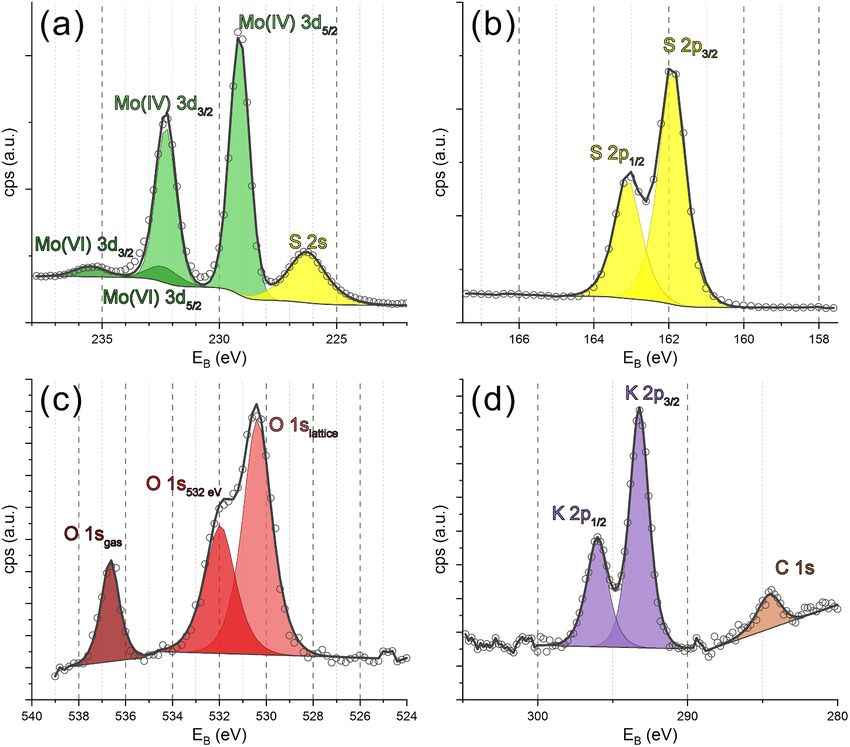
J. Phys. D: Appl. Phys. 54 (2021) 324002                                                                                    G Pacholik et al

Figure 1. (a) BET surface areas of MoS2 catalysts (b) TPO of MoS2 in 20% O2 /Ar and TPR of MoS2 in 60% H2 /Ar with a heating ramp of
5 ◦ C min−1 .

                                           Figure 2. XRD spectra of fresh and used MoS2 based catalysts.

and without Co and Ni promotion might be due to a different                 applied. MoS2 + K exhibited higher CO formation rate. This
reaction mechanism.                                                         may be consistent with the proposed two-step reaction for the
   Based on DFT calculations, Liu and Liu proposed differ-                  K-Mo6 S8 cluster.
ent reaction mechanisms for Mo6 S8 clusters with and without                   Our results are also in agreement with Liu et al [5]. The
modification by various metals [14], including K and Ni.                    addition of K decreased hydrocarbon formation and increased
Methanol can be produced by the reverse water–gas shift                     alcohol formation.
and subsequent CO hydrogenation, or directly via the form-
ate pathway. In our work, MoS2 showed significantly dif-
                                                                            3.3. NAP-XPS of MoS2
ferent catalytic properties than MoS2 + K and the materi-
als promoted with Ni or Co. Pure MoS2 produced mainly                       To obtain more information on the surface composition of
CH4 , and no methanol was observed under the conditions                     the unpromoted MoS2 material under different conditions,

                                                                        4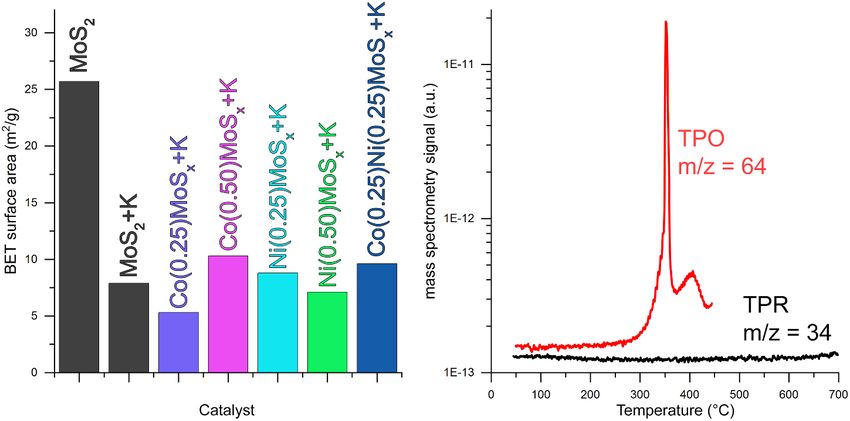
J. Phys. D: Appl. Phys. 54 (2021) 324002                                                                                          G Pacholik et al

Figure 3. Catalytic activity of several MoS2 based catalysts at 21 bar, 300 mlN/(gcatalyst ∗ h), 20% CO2 , 60% H2 and 20% He. (a) Yield of
CO, (b) yield of CH4 , (c) yield of methanol, (d) selectivities at 280 ◦ C.

Table 2. Formation rate of products orders at 280 ◦ C,                        a reaction mixture of 1 mbar CO2 :H2 = 1:3 was dosed into the
300 mlN/(gcatalyst ∗ h), 21 bar, 20% CO2 , 60% H2 , 20% He.                   NAP-XPS chamber, and the sample was analyzed at 200 ◦ C
                                 formation rate (µmol g−1 h−1 )               and 300 ◦ C during catalytic reaction.
                                                                                  An exemplary fit of the Mo 3d spectral range is visualized in
                              CO              CH4             MeOH
                                                                              figure 4(a). The Mo peaks were fitted with an GL(30) function,
MoS2                          205            1691                  0          the S 2s with GL(70). Doublet separation from Mo 3d5/2 and
MoS2 + K                      370              13                 32          Mo 3d3/2 of 3.14 eV was taken from the literature [21]. The
Co050MoS                      839             312                  1          main oxidation state of Mo was IV, minor amounts of Mo(VI)
Co025MoS + K                 1348              15                 19          were found [22]. The amount of Mo(VI) at the surface varied
Co050MoS + K                 1289              13                 19          with the conditions applied, as discussed below. In addition,
Ni025MoS + K                 1324              14                 22          also the S 2s signal is visible in this range. The S 2p spectral
Ni050MoS + K                 1289               8                 14          range is shown in figure 4(b). For both signals, only one S
CoNiMoS + K                  1309              11                 15
                                                                              species was observed.
                                                                                  Several oxygen species were found in the O 1s spectra. The
                                                                              O 1s spectrum of the MoS2 sample under CO2 + H2 at 200 ◦ C
NAP-XPS measurements were performed during reduction                          is shown in figure 4(c). The peak at about 530.5 eV is attrib-
and in reaction atmosphere. At first, spectra were collected                  uted to lattice oxygen [23], likely from MoO3 . O 1s with a
at 200 ◦ C in ultra-high vacuum, followed by pretreatment in                  binding energy of about 533 eV origins from adsorbed species
0.75 mbar H2 at 400 ◦ C and further collection of spectra.                    like surface hydroxyls and water [4, 24]. CO should appear at
The sample was cooled to 200 ◦ C in H2 atmosphere. Then,                      lower binding energy (531.5 eV). The existence of molecularly

                                                                         5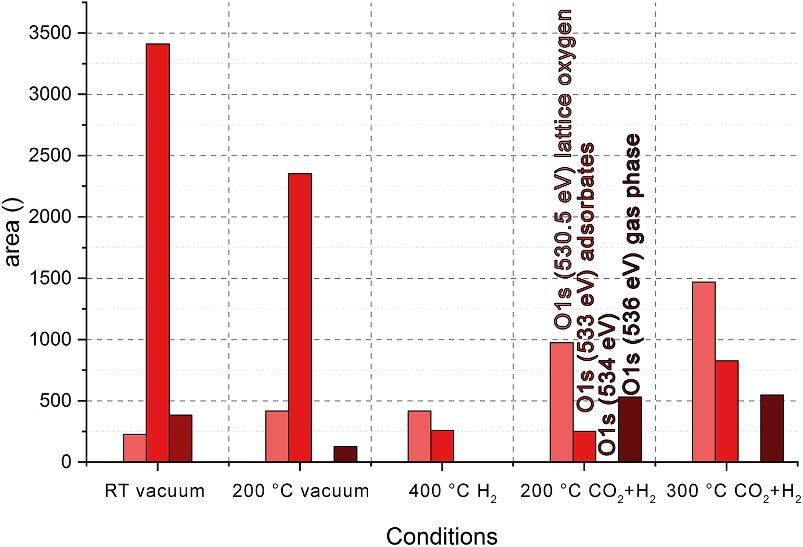
J. Phys. D: Appl. Phys. 54 (2021) 324002                                                                                       G Pacholik et al

                         Table 3. Reaction orders at 280 ◦ C, 300 mlN/(gcatalyst ∗ h), 21 bar, 20% CO2 , 60% H2 , 20% He.

                                       CO formation                           CH4 formation                          MeOH formation
                              CO2 order           H2 order           CO2 order            H2 order             CO2 order          H2 order

MoS2 + K                      0.48 ± 0.00       1.07 ± 0.12        −0.18 ± 0.00          1.48 ± 0.19        −0.21 ± 0.02        1.52 ± 0.03
Co(0.50)MoSx + K              0.17 ± 0.24       0.86 ± 0.20        −0.54 ± 0.60          1.63 ± 0.73         0.45 ± 0.10        2.63 ± 0.06
Ni(0.25)MoSx + K              0.52 ± 0.01       0.73 ± 0.00        −0.08 ± 0.13          1.24 ± 0.09         0.24 ± 0.02        2.67 ± 0.14

            Figure 4. (a) Mo 3d, (b) S 2p, (c) O 1s and (d) C 1s in situ XPS spectra of MoS2 at 200 ◦ C in H2 + CO2 atmosphere.

adsorbed CO2 on the surface is not feasible at reaction tem-                only visible prior to pretreatment. The amount of oxygen rap-
peratures. Adsorbed formate species may also contribute to                  idly decreased at 400 ◦ C under hydrogen and then increased
the adsorbate species at 533 eV, as it is a possible interme-               again upon adding CO2 . This indicates that the oxygen ori-
diate in the reaction; however, corresponding C 1s peaks are                ginates from CO2 from the gas phase and/or H2 O formed as
absent (figure 4(d)) [25]. Thus, we assign these species to                 a reaction product. When comparing reaction at 200 ◦ C and
mostly OH and H2 O at the surface. Under CO2 + H2 addi-                     300 ◦ C, the adsorbate-related signal increases with temperat-
tional peaks from gas phase species are visible and absent in               ure and thus conversion. At 300 ◦ C during reaction, this peak
H2 . The peak at 536 eV present under the reaction atmosphere               showed a much higher area and full width half maximum.
originates from the gas phase CO2 [26]. The distribution of all                 The C 1s range shows mainly the presence of adventitious
oxygen species in MoS2 is visualized in figure 5. The peak                  carbon, which was fitted by an asymmetric GL(30) function
of adsorbed species at about 533 eV was particularly large                  (figure 4(d)). No significant amounts of C–O adsorbates were
before the pretreatment. In addition, a signal at 534 eV was                visible. The energy range around the Fermi level is shown in

                                                                        6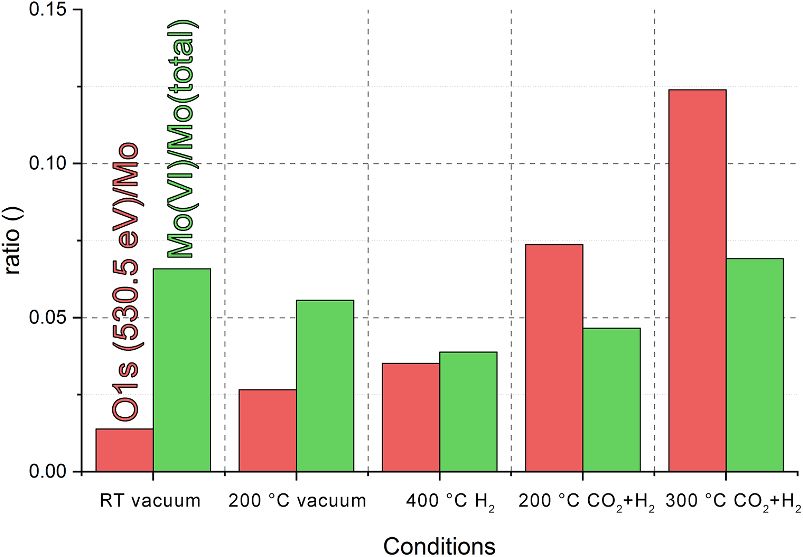
J. Phys. D: Appl. Phys. 54 (2021) 324002                                                                                      G Pacholik et al

Figure 5. Amount of oxygen species on MoS2 at different                  Figure 7. Relative amount of lattice oxygen and fraction of Mo(VI).
conditions. The peak at about 530.5 eV is attributed to lattice
oxygen. The peak at 533 eV origins from adsorbed species. The
signal at 534 eV was only found prior to pretreatment. The peak at
536 eV originates from the gas phase CO2 .
                                                                            The ratio of Mo(VI) to Mo(IV) changed at different tem-
                                                                         peratures and conditions, as represented in figure 7. The lowest
                                                                         fraction of Mo(VI) was measured after the pretreatment in H2 ,
                                                                         whereas under reaction atmosphere the fraction of oxidized
                                                                         species increased, in parallel to the amount of lattice oxygen.
                                                                         The increase of Mo(VI) and lattice oxygen concentrations in
                                                                         the reaction atmosphere as compared to pure hydrogen indic-
                                                                         ates the formation of small amounts of MoO3 at the surface
                                                                         during reaction.
                                                                            Furthermore, the MoS2 + K catalyst was analyzed by in situ
                                                                         XPS in order to obtain information on the effect of K on
                                                                         the Mo and potential intermediates. After pretreatment under
                                                                         0.75 mbar H2 at 400 ◦ C, spectra were measured under reaction
                                                                         atmosphere (H2 :CO2 = 3:1) at 1 mbar and 200 ◦ C. The Mo 3d,
                                                                         S 2p, O 1s, K 2p and C 1s regions are illustrated in figure 8.
                                                                            No difference in the Mo 3d and S 2p regions was seen com-
                                                                         pared to pure MoS2 under reaction conditions. In the O 1s
                                                                         region, the broad adsorbate-related peak observed at 533 eV on
Figure 6. Relative surface concentrations of S, O (without gas
phase) and C (without gas phase) of MoS2 during the experiment.          the MoS2 was not detected on MoS2 + K. We have assigned
                                                                         this peak to the surface OH or formates. Instead, a signal at
                                                                         532 eV occurred, which was already visible prior to reaction
the supplementary information (figure SI 1 (available online at          in the absence of CO2 . The peak may originate from carbon-
stacks.iop.org/JPD/54/324002/mmedia)).                                   ate species [28], or from sulfate [29]. Potassium is added as a
   Surface concentrations of S, O and C changed during the               carbonate in the synthesis and may take up CO2 upon expos-
experiment, as displayed in figure 6. The area of Mo 3d                  ure to the ambient atmosphere. The 532 eV peak is the only
was corrected with a cross section of 0.1303 Mbarn [27] and              adsorbate-related species present under reaction conditions in
taken for concentration calculations. The S/Mo ratio was cal-            the O 1s range and changed its intensity with varying condi-
culated from S 2p and Mo 3d peak areas corrected by the                  tions indicating its potential involvement in the reaction. No
element-specific cross sections [27], and were slightly above            peak characteristic for sulfate was observed in the S 2p region
two throughout the experiment. The surface concentration                 during the reaction.
of oxygen depended on the conditions. The lowest amount                     The interaction between K and CO2 can be extraordinarily
of total oxygen at the surface was found at 400 ◦ C under                strong, which may lead to the activation of CO2 (formation of
hydrogen atmosphere, under the most reducing conditions we               CO2 − ) and finally its dissociation into carbonate and CO, as
applied. When switching to the reaction mixture an increase              proposed by Kiss et al [28]. In this case, CO2 hydrogenation
in the amount of oxygen was observed as a consequence of                 may occur via successive CO hydrogenation. This supports
the addition of CO2 and the formation of H2 O during the                 our assumption of different reaction mechanisms occurring in
reaction.                                                                the presence of different promoters.

                                                                     7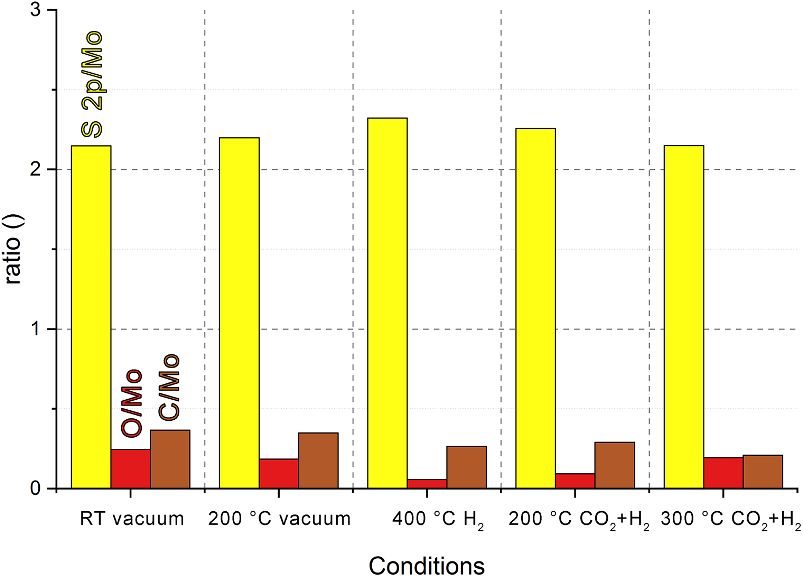
J. Phys. D: Appl. Phys. 54 (2021) 324002                                                                                  G Pacholik et al

    Figure 8. (a) Mo 3d, (b) S 2p, (c) O 1s and (d) K 2p and C 1s in situ XPS spectra of MoS2 + K at 200 ◦ C in H2 + CO2 atmosphere.

4. Conclusion                                                          in situ XPS measurements did not show an effect of the
                                                                       K addition on the Mo binding energy. However, the O 1s
Promotion of MoS2 catalysts with different metals changes              peak related to adsorbates was found at lower binding energy
their catalytic properties. While the main product over pure           and was assigned to carbonates, which may indicate a dif-
MoS2 is CH4 under the conditions applied, K addition leads to          ferent reaction mechanism as compared to the unpromoted
a higher CO and methanol formation.                                    MoS2 .
   XRD proved the existence of a MoS2 phase in all cata-
lysts. K was present as K2 SO4 , Co and Ni as sulfide. In
                                                                       Data availability statement
the fresh catalysts, CoS and NiS was found. In compar-
ison, Co9 S8 and Ni3 S2 were present in the used catalysts.            All data that support the findings of this study are included
N2 physisorption showed a reduction of the BET surface                 within the article (and any supplementary files).
area when K was added. No significant difference was found
between CoMoSx + K, NiMoSx + K and MoS2 + K cata-
lysts. Under oxidizing atmosphere, the catalyst is stable              Acknowledgments
below 280 ◦ C. TPR experiments showed no reduction until
700 ◦ C.                                                               We thank Werner Artner for his support with the XRD
   In situ XPS showed the formation of small amounts of                measurements. The authors acknowledge TU Wien Biblio-
Mo(VI) species under reaction atmosphere and adsorbed oxy-             thek for financial support through its Open Access Funding
gen compounds, most likely surface hydroxyls and formate, in           Programme. GP and KF acknowledge support by the TU Wien
particular, with increasing temperature and thus conversion.           doctoral school CO2 Refinery.

                                                                   8
J. Phys. D: Appl. Phys. 54 (2021) 324002 G Pacholik et al
ORCID iDs [14] Liu C and Liu P 2015 Mechanistic study of methanol synthesis
from CO2 and H2 on a modified model Mo6 S8 cluster ACS
Christoph Rameshan https://orcid.org/0000-0002-6340- Catal. 5 1004–12
[15] Kattel S, Yan B, Chen J G and Liu P 2016 CO2 hydrogenation
4147
on Pt, Pt/SiO2 and Pt/TiO2 : importance of synergy between
Karin Föttinger https://orcid.org/0000-0002-2193-0755 Pt and oxide support J. Catal. 343 115–26
[16] Rameshan R, Nenning A, Raschhofer J, Lindenthal L, Ruh T,
Summerer H, Opitz A, Martin Huber T and Rameshan C
References 2020 Novel sample-stage for combined near ambient
pressure x-ray photoelectron spectroscopy, catalytic
[1] Olah G A, Prakash G K S and Goeppert A 2011 characterization and electrochemical impedance
Anthropogenic chemical carbon cycle for a sustainable spectroscopy Crystals 10 10
future J. Am. Chem. Soc. 133 12881–98 [17] Kong J, Park K T, Miller A C and Klier K 2000 Molybdenum
[2] Xiaoding X, Doesburg E B M and Scholten J J F 1987 disulfide single crystal (0002) plane XPS spectra Surf. Sci.
Synthesis of higher alcohols from syngas—recently Spectra 7 69–74
patented catalysts and tentative ideas on the mechanism [18] Dickinson R G and Pauling L 1923 The crystal structure of
Catal. Today 2 125–70 molybdenite J. Am. Chem. Soc. 45 1466–71
[3] Nitopi S et al 2019 Progress and perspectives of [19] Kitakaze A and Sugaki A 2004 The phase relations between
electrochemical CO2 reduction on copper in aqueous Fe4.5 Ni4.5 S8 and Co9 S8 in the system Fe–Ni–Co–S at
electrolyte Chem. Rev. 119 7610–72 temperatures from 400◦ TO 1100 ◦ C Can. Mineral.
[4] Nieskens D L S, Ferrari D, Liu Y and Kolonko R 2011 The 42 17–42
conversion of carbon dioxide and hydrogen into methanol [20] Ojima K, Nishihata Y and Sawada A 1995 Structure of
and higher alcohols Catal. Commun. 14 111–3 potassium sulfate at temperatures from 296 K down to 15 K
[5] Liu S, Zhou H, Song Q and Ma Z 2017 Synthesis of higher Acta Crystallogr. B 51 287–93
alcohols from CO2 hydrogenation over Mo–Co–K [21] Durbin T D, Lince J R, Didziulis S V, Shuh D K and
sulfide-based catalysts J. Taiwan Inst. Chem. Eng. Yarmoff J A 1994 Soft x-ray photoelectron spectroscopy
76 18–26 study of the interaction of Cr with MoS2 (0001) Surf. Sci.
[6] Porosoff M D, Yan B and Chen J G 2016 Catalytic reduction 302 314–28
of CO2 by H2 for synthesis of CO, methanol and [22] Zingg D S, Makovsky L E, Tischer R E, Brown F R and
hydrocarbons: challenges and opportunities Energy Hercules D M 1980 A surface spectroscopic study of
Environ. Sci. 9 62–73 molybdenum-alumina catalysts using x-ray photoelectron,
[7] Lund C R F 1996 Effect of adding Co to MoS2 /Al2 O3 upon ion-scattering, and Raman spectroscopies J. Phys. Chem.
the kinetics of the water−gas shift Ind. Eng. Chem. Res. 84 2898–906
35 3067–73 [23] Chowdari B V R, Tan K L, Chia W T and Gopalakrishnan R
[8] Li P, Chen Y, Zhang C, Huang B, Liu X, Liu T, Jiang Z and 1990 X-ray photoelectron spectroscopic studies of
Li C 2017 Highly selective hydrodesulfurization of gasoline molybdenum phosphate glassy system J. Non Cryst. Solids
on unsupported Co-Mo sulfide catalysts: effect of MoS2 119 95–102
morphology Appl. Catal. A 533 99–108 [24] Shuxian Z 1986 X-ray photoemission study of oxygen and
[9] Concha B E 1984 CO hydrogenation on supported nitric oxide adsorption on MoS2 J. Catal. 100 167–75
molybdenum catalysts: effects of support on specific [25] Sápi A et al 2018 In situ DRIFTS and NAP-XPS exploration
activities of reduced and sulfided catalysts J. Catal. of the complexity of CO2 hydrogenation over
89 536–41 size-controlled Pt nanoparticles supported on mesoporous
[10] Santos V P, van der Linden B, Chojecki A, Budroni G, NiO J. Phys. Chem. C 122 5553–65
Corthals S, Shibata H, Meima G R, Kapteijn F, Makkee M [26] Avval T G, Chatterjee S, Bahr S, Dietrich P, Meyer M,
and Gascon J 2013 Mechanistic insight into the synthesis of Thißen A and Linford M R 2019 Carbon dioxide gas,
higher alcohols from syngas: the role of K promotion on CO2 (g), by near-ambient pressure XPS Surf. Sci. Spectra
MoS2 catalysts ACS Catal. 3 1634–7 26 14022
[11] Shi X-R, Jiao H, Hermann K and Wang J 2009 CO [27] Yeh J J and Lindau I 1985 Atomic subshell photoionization
hydrogenation reaction on sulfided molybdenum catalysts J. cross sections and asymmetry parameters: 1 ⩽ Z ⩽ 103 At.
Mol. Catal. A 312 7–17 Data Nucl. Data Tables 32 1–155
[12] Lee J S, Kim S, Lee K H, Nam I-S, Chung J S, Kim Y G and [28] Kiss J, Révész K and Solymosi F 1988 Photoelectron
Woo H C 1994 Role of alkali promoters in K/MoS2 spectroscop1c studies of the adsorption of CO2 on
catalysts for CO-H2 reactions Appl. Catal. A 110 11–25 potassium-promoted Rh(111) surface Surf. Sci.
[13] Zeng F, Xi X, Cao H, Pei Y, Heeres H J and Palkovits R 2019 207 36–54
Synthesis of mixed alcohols with enhanced C3+ alcohol [29] Wahlqvist M and Shchukarev A 2007 XPS spectra and
production by CO hydrogenation over potassium promoted electronic structure of group IA sulfates J. Electron.
molybdenum sulfide Appl. Catal. B 246 232–41 Spectrosc. Relat. Phenom. 156-8 310–4
9You can also read