Nantucket Chronic Disease Report 2020 - Nantucket Health Department
←
→
Page content transcription
If your browser does not render page correctly, please read the page content below
Nantucket
Chronic Disease
   Report
             2020

   Nantucket Health Department
Nantucket Chronic Disease Report | Page 2
Acknowledgments
                          Lead Author, Grace McNeil

                  Nantucket Health Department
                              Roberto Santamaria
                                  Health Director

    John Hedden                  Artell Crowley                    Kathy LaFavre
    Health Inspector         Assistant Health Director             Health Inspector

                                   Anne Barrett
                             Administrative Specialist

                                  Intern Staff
          Grace McNeil                                     Skye Flegg
         Syracuse University                         Nantucket High School

                           Facilitating Partners

                               Fairwinds Counseling                 Nantucket Fire
American Cancer Society
                                      Center                         Department

 Alliance for Substance                                            Nantucket Police
                                    Mayo Clinic
   Abuse Prevention                                                  Department

                                 Massachusetts
  Centers for Disease
                               Department of Public        Nantucket Public Schools
 Control and Prevention
                                     Health

                       Nantucket Chronic Disease Report | Page 3
Table of Contents
Chronic Disease…………………………………………………………………………...6
Protective Factors………………………………………………………………….6
Risk Factors……………………………………………………………………….6
Asthma…………………………………………………………………………………….8
Cancer……………………………………………………………………………………..9
Breast Cancer…………………………………………………………………….10
Prostate Cancer…………………………………………………………………..10
Melanoma of the Skin……………………………………………………………11
Cardiovascular Disease…………………………………………………………………..12
Cardiovascular Disease by Year…………………………………………………12
Heart Disease Death Rate by Race………………………………………………13
Hypertension Death Rate by Race……………………………………………….13
Stroke by Year…………………………………………………………………...14
Stroke Death Rate by Race………………………………………………………15
Diabetes………………………………………………………………………………….16
Type One…………………………………………………………………………16
Type Two………………………………………………………………………...16
Gestational……………………………………………………………………….16
Percentage of Population with Diabetes…………………………………………17
Mental Health…………………………………………………………………………….18
Fairwinds Therapy……………………………………………………………….18
Mental Health Hospitalizations………………………………………………….18
Our Students……………………………………………………………..………19
Intentional Self-Harm Deaths……………………………………………………19
Substance Use……………………………………………………………………………20
Alcohol………………………………………………………………..…………20
Marijuana……………………………………………………………...…………20
Nantucket Chronic Disease Report | Page 4Marijuana Use Among Youth……………………………………………21
E-Cigarettes………………………………………………………………………21
Other Drugs………………………………………………………………………22
Inhalants……………………………………………………….…………22
Heroin……………………………………………………………………22
Steroids………………………………………………………..…………22
Ecstasy………………………………………………………...…………22
Meth………………………………………………………………...……22
Narcan……………………………………………………………………………23
Nantucket Chronic Disease Report | Page 5Chronic Disease
The CDC defines chronic diseases as “conditions that last 1 year or more and require ongoing
medical attention or limit activities of daily living or both.” Chronic diseases are the leading causes
of death and disability in the United States. They are also the majority contributor of the nation’s
3.5 trillion-dollar annual health care costs. In the United States, 6 in 10 adults have a chronic
disease and 4 in 10 have two or more chronic diseases according to the CDC. The most common
chronic disease is heart disease which is also the leading cause of death in the US. Many chronic
diseases are caused by lifestyle factors such as tobacco use, poor nutrition, lack of physical activity,
and excessive alcohol use.
There are many factors that contribute to the rise in chronic disease in our country. It can be broken
down into two categories: protective factors (those that would prevent chronic disease) and risk
factors (those that increase one’s risk of developing chronic diseases). The rise in chronic disease
is caused by the decrease in protective factors while risk factors increase. Below are some
examples of each.
Protective Factors Risk Factors
Financial stability High rates of poverty
Easy access to fresh & affordable food Easy access to cheap and unhealthy foods
Safe and accessible recreation space Lack of safe outdoor space for exercise
Safe and affordable housing High rates of tobacco and alcohol intake
Strong sense of community Limited childcare options
Easy access to healthcare Far away from fresh & affordable food
In communities where there are more risk factors than protective factors, there is more chronic
disease. Many of the risk factors listed above are commonly found in cities across the United
States. They are also found in extremely rural areas that are usually far from grocery stores, good
schools, and healthcare providers. Most Americans live in areas where a mix of protective and risk
factors are present. Nantucket can be considered one of these places. Below are some of the
protective and risk factors that are commonly found on Nantucket.
Nantucket Protective Factors Nantucket Risk Factors
Easy access to healthy & affordable food Lack of medical specialists
Lots of safe space for recreation High rates of poor mental health
Excessive use of drugs and alcohol among
Availability of economic opportunity (jobs)
youth and adults
Access to public and private schools Lack of affordable housing
Very limited fast food options High cost of childcare
Strong sense of community Potential need to work multiple jobs
Nantucket Chronic Disease Report | Page 6In communities with a mix of protective and risk factors, lifestyle choices tend to be extremely
influential on the development of chronic diseases. A community member has the resources to be
healthy, however, they also have the resources to be unhealthy. The choice is then largely up to
them. It is also acknowledged that family history and other predetermined factors may play a part
in the development of chronic diseases. The combination of genetics, environmental factors, and
lifestyle choices all play a vital role in the development of chronic disease.
This chronic disease report provides an in-depth review of chronic diseases on our island. The
following chronic diseases are reviewed in this report:
Asthma
Cancer
Cardiovascular Disease
Diabetes
Mental Health
Stroke
Substance Abuse
Nantucket Chronic Disease Report | Page 7Asthma
The Massachusetts Department of Public Health defines asthma as “a chronic inflammatory
disease of the airways characterized by episodic wheezing, breathlessness, chest tightness, and
coughing.” Children in Massachusetts have the highest rate of Emergency Department visits
related to asthma and the second highest rate of asthma hospitalizations when compared to all other
age groups.
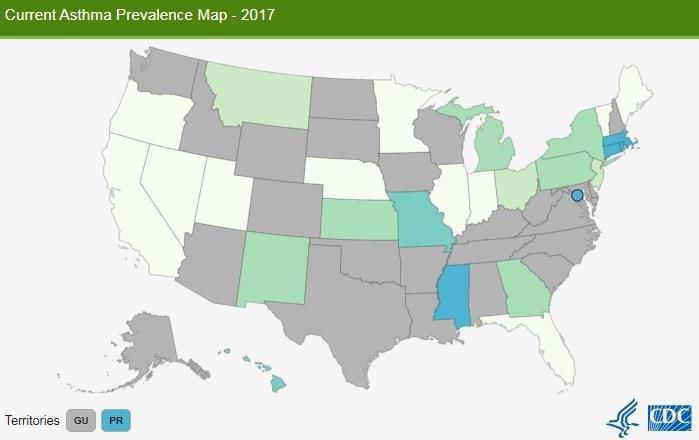
According to the Massachusetts Department of Public Health, an estimated annual average of
15.0% of children in Massachusetts had asthma from 2011-2013. In 2017, the CDC reported that
Massachusetts children had the highest prevalence of asthma when compared to all other states
with a prevalence of 15.8%. In 2017, 11.5% of Massachusetts adults had asthma. This was
comparable to the prevalence in the rest of New England. Children ages 5-11 had a much higher
prevalence of asthma when compared to children aged 4 and younger (12.8% compared to 4.7%
respectively). There is also an income disparity when it comes to asthma. Children living in homes
with a household income of less than $25,000 experience an asthma prevalence of 17.1% while
children living in homes with a household income of $75,000 or greater experience a prevalence
of 8.1%. During the 2013-2014 school year, Nantucket had an asthma prevalence of 7.7-15.3 per
100 students. This was consistent with most communities in the state. From 2008-2012, the rate
of asthma-related emergency department visits for children ages 19 and younger was statistically
significantly higher on Nantucket than the statewide rate.
Nantucket Chronic Disease Report | Page 8Cancer
From 2012-2016, there were 294 new cases of cancer on Nantucket. For every 100,000 people,
481 new cancer cases were reported. On Nantucket, 79 people died of cancer between 2012-2016.
The cancer death rate from 2012-2016 on Nantucket was 130 per 100,000 people.
Females had a higher rate of being diagnosed with cancer when compared to men (555.5 per
100,000 versus 416.4 per 100,000).
The chart below compares the cancer incidence among males and females in Massachusetts and
on Nantucket between the years 2011 and 2015.
Cancer Incidence by Gender 2011-2015
350
Standardized Incidence Ratio
300 Male, Nantucket
Female, Nantucket
250
Male, Massachusetts
200 Female, Massachusetts
150
100
50
0
Cancer Type
Source: MDPH
At the state level, there were 180,609 new cases of cancer reported between 2012-2016. The rate
of new cases was 449 per 100,000 people during this time-period. It can be concluded that
Nantucket had a higher rate of new cancer cases when compared to the state level during the 5-
year time-period (481 per 100,000 compared to 449 per 100,000). At the state level, males had a
higher burden of new cancer cases when compared to females. The rate of new cancers for males
was 470.8 per 100,000 and 439.5 per 100,000 for females from 2012-2016. This data point
suggests that there may be an uncharacteristically high cancer risk for females on Nantucket.
Nantucket Chronic Disease Report | Page 9Breast Cancer
According to the CDC, breast cancer was the most commonly diagnosed cancer type in females
on Nantucket between 2012 and 2016 with 56 new cases. The following cancer types were the
most common among females on Nantucket between 2011 and 2015.
Melanoma of the Skin, 314.3 per 100,000
Thyroid, 175.5 per 100,000
Leukemia, 174.5 per 100,000
Colon/Rectum, 163.5 per 100,000
Breast, 131.2 per 100,000
It can be concluded that while breast cancer was not the most common cancer type among females
on Nantucket, it was the most commonly diagnosed within 2012-2016. This means that Nantucket
may see the prevalence of breast cancer increase in future years and may even see it surpass
prevalence rates of other cancer types. The American Cancer Society makes estimates every year
for the number of new cases and deaths they expect, and their 2020 estimates are consistent with
the previous prediction. They estimate that in Massachusetts, breast cancer will have the largest
number of new cases of any cancer type in 2020 by over 1,000 cases. They are predicting 6,690
new cases of breast cancer (female only) in 2020 followed by 5,150 cases of lung and bronchial
cancer (male and female combined). This estimate is consistent with the trends seen on Nantucket
from the CDC and the Massachusetts Department of Public Health.
Prostate Cancer
For males, prostate cancer was the most commonly diagnosed cancer type on Nantucket between
2012 and 2016 with a rate of 91.1 per 100,000 and 30 new cases. The American Cancer Society
reported that for the state of Massachusetts, prostate cancer had the second highest incidence rate
behind breast cancer between 2012 and 2016. This is consistent with Nantucket data which showed
breast and prostate cancers as emerging cancer types during the same time-period.
The following cancer types were the most common among males on Nantucket between 2011 and
2015.
Multiple Myeloma, 281.2 per 100,000
Melanoma of the Skin, 194.8 per 100,000
Oral Cavity & Pharynx, 155.0 per 100,000
Leukemia, 147.2 per 100,000
Prostate, 85.0 per 100,000
Nantucket Chronic Disease Report | Page 10While prostate cancer was not the most prevalent cancer type in males between 2011-2015, it was
the most commonly diagnosed cancer type from 2012-2016 on Nantucket. It can be concluded that
the prevalence of prostate cancer may increase on Nantucket in future years based on its’ high
incidence rate. While breast and prostate cancers are not 100% preventable, there are reliable
screening tools commonly available to catch these diseases early enough to increase chances of
successful treatment. In 2018, Massachusetts ranked #2 in the country for breast cancer screenings
(mammography). It is recommended that women over the age of 45 get yearly mammograms. Men
over the age of 50 with average risk of prostate cancer should be screened every year.
Melanoma of the Skin
Melanoma of the skin was the most prevalent cancer type from 2011-2015 for females and it was
the second most prevalent cancer type in males on Nantucket. Melanoma has consistently been a
concern for Nantucket. From 2009-2013, the incidence rates of melanoma in men and women were
significantly higher than the incidence rates at the state level. There are many factors that could
contribute to the high rates of melanoma on Nantucket. According to the Nantucket Data Platform,
about 14% of the population is over the age of 65 and 89% of the population is white. There is also
a high demand for outdoor jobs, especially during the summer months. The combination of older
age, light skin, and spending significant time outdoors in the summer could all be potential reasons
for the high prevalence of melanoma on Nantucket. It should be noted that when conducting
research on small communities, it is difficult to determine exact causation due to the sheer lack of
data. According to the Mayo Clinic, the risk factors of Melanoma include having a family member
with melanoma, fair skin, excessive UV light exposure, having many moles or unusual moles, and
history of sunburns.
Nantucket Chronic Disease Report | Page 11Cardiovascular Disease
Cardiovascular disease is the leading cause of death in the United States. It causes about 1 in 4
deaths according to the CDC. As defined by Mayo Clinic, cardiovascular disease refers to
“conditions that involve narrowed or blocked blood vessels that can lead to a heart attack, chest
pain, or stroke.” It is also commonly referred to as heart disease. Cardiovascular disease can be
caused by a combination of lifestyle choices, family history, and environmental factors. When a
person makes unhealthy lifestyle choices, they may develop atherosclerosis (a build-up of fatty
plaques in your arteries). It is caused by an unhealthy diet, lack of exercise, being overweight, and
smoking.
Another type of heart disease, heart arrhythmia, is a condition in which there is an abnormal heart
rhythm. This condition can be caused by birth defects, coronary heart disease, high blood pressure,
diabetes, smoking, accessing use of alcohol or caffeine, drug abuse, and stress. While not all these
conditions are correctable, most of them are lifestyle choices. Much like other chronic diseases,
heart disease can be prevented by a healthy and balanced diet, regular exercise, and not smoking.
Cardiovascular Disease by Year
From 2007-2014,
Massachusetts had a Cardiovascular Disease By Year, 2007-2014
2000
higher rate of
Age-Adjusted Rate Per 100,000
1800 Nantucket Massachusetts
cardiovascular disease 1600
(CVD) when compared 1400
to Nantucket. The 1200
highest rates of CVD 1000
occurred in 2008 on 800
600
Nantucket (1648.8 per
400
100,000). While the 200
rates of CVD have 0
started to decrease 2007 2008 2009 2010 2011 2012 2013 2014
consistently in Source: MDPH Year
Massachusetts, the
rates on Nantucket seem to fluctuate. There were three distinct increases in Cardiovascular
Disease on Nantucket between 2007 and 2014. Following the highest rate of CVD in 2008, rates
reached a low in 2010 at 1070.1 per 100,000. There was an increase in rates again in 2012, a
decrease in 2013 and a small increase in 2014. With such a small population on Nantucket, a few
new cases can drastically change the data.
Nantucket Chronic Disease Report | Page 12Heart Disease Death Rate by Race
The following graph shows heart disease death rates by race on Nantucket, statewide, and
nationwide. The Nantucket and statewide rates are very similar while the nationwide rates differ
somewhat drastically. Nationwide, the population with the highest death rate is Black, non-
Hispanic. On Nantucket and in the state of Massachusetts, the death rate is higher for White, non-
Hispanic people. For the Hispanic, American Indian and Alaskan Native, and Asian and Pacific
Islander populations, there were case numbers too small to report for Nantucket. Overall,
Nantucket has a lower death rate for every population when compared to the rest of the US.
Heart Disease Death Rate Per 100,000 by Race 2014-2016
450 Nantucket
400 Massachusetts
People per 100,000
350 National
300
250
200
150
100
50
0
All Races Black, Non- White, Non- Hispanic American Indian Asian and Pacific
Hispanic Hispanic and Alaskan Islander
Source: CDC Race Native
Hypertension Death Rate by Race
The following chart looks at hypertension death rates per 100,000 people by race in Massachusetts,
on Nantucket, and nationwide. Since hypertension is a risk factor for heart disease, it is important
to understand the prevalence of it in our community.
Corresponding to the heart disease death rate chart above, the nationwide rates of hypertension
deaths are much higher than those of Massachusetts and Nantucket. An interesting point to note is
that White, non-Hispanic people in Massachusetts and Nantucket are dying at a higher rate of heart
disease when compared to Black, non-Hispanic people, but the opposite is true for hypertension
death rates. Black, non-Hispanic people in Massachusetts and Nantucket are dying at a higher rate
due to hypertension when compared to White, non-Hispanic people. Again, the case numbers for
Hispanic, American Indian and Alaskan Native, and Asian and Pacific Islander people are too
small to report.
Nantucket Chronic Disease Report | Page 13Hypertention Death Rate Per 100,000 by Race 2014-2016
400 Nantucket
People per 100,000
350 Massachusetts
300 National
250
200
150
100
50
0
All Races Black, Non- White, Non- Hispanic American Indian Asian and Pacific
Hispanic Hispanic and Alaskan Islander
Source: CDC Native
Race
Stroke by Year
Stroke is a condition
that can occur from
Stroke by Year, 2007-2014
400
Age-Adjusted Rate Per 100,000
complications of Nantucket
350
heart disease. When Massachusetts
300
blood clots block
blood vessels in the 250
brain, a stroke occurs. 200
Strokes can be very 150
detrimental to the 100
brain and can even be 50
life threatening. They
0
can be avoided by 2007 2008 2009 2010 2011 2012 2013 2014
eating healthy and Source: MDPH Year
exercising regularly.
Generally, they can be prevented in the same way cardiovascular disease can. The rate of stroke
in Massachusetts has stayed relatively consistent from 2007 to 2014. There has been a slight
decrease over time. In 2017, the stroke rate was 272.2 per 100,000 people and it was 255.1 per
100,000 people in 2014. On Nantucket, the rate of stroke has changed a lot between 2007 and
2014. The lowest rate of stroke was in 2009 at148.6 per 100,000 people. The highest was in 2011
with a rate of 338.1 per 100,000. The rate of stroke decreased on Nantucket in 2012 and 2013,
however, it increased in 2014 to 233.8 per 100,000. Between 2007 and 2014, the stroke rate on
Nantucket only surpassed the statewide rate twice: in 2011 and 2012.
Nantucket Chronic Disease Report | Page 14Stroke Death Rate by Race
For all races, the stroke death rate is relatively similar. Nationwide, the death rate is 72.2 per
100,000 which is larger than both Massachusetts (55.1 per 100,000) and Nantucket (59.5 per
100,000). It should be noted that some data is missing from the chart. Nantucket only had death
rates high enough to report for the ‘all races’ category and the White, non-Hispanic population.
This means that on Nantucket, the White, non-Hispanic population had the highest number of
stroke deaths than any other race. Nationwide and at the state level, the Black, non-Hispanic
population had the
Stroke Death Rate by Race, 2014-2016 highest rate of
120 Nantucket
stroke deaths (64.3
Rate per 100,000 People
100 Massachusetts per 100,000 at the
80 National state level and
60 100.5 per 100,000
40 nationwide). The
20 Black, non-
0 Hispanic
All Races Black, Non- White, Non- Hispanic American Asian and population also
Hispanic Hispanic Indian and Pacific
Alaskan Islander had the highest
Source: CDC Race
Native heart disease death
rate nationwide and the highest hypertension death rate nationwide, statewide, and on Nantucket.
The data may suggest a health disparity among this population. The CDC defines health
disparities as “preventable differences in the burden of disease, injury, violence, or opportunities
to achieve optimal health that are experienced by socially disadvantaged populations.”
Massachusetts and Nantucket are not as diverse as the rest of the nation which can lead to under
reporting. By not being able to get a full picture of the data, we may overlook important trends.
Health disparities are everywhere, and it is important for all populations to make a note of them
so that we can work together towards health equity.
Nantucket Chronic Disease Report | Page 15Diabetes
There are three types of diabetes: Type One, Type Two, and gestational (occurs during pregnancy).
Type One
Over 1.25 million people in the United States have type one diabetes. This type can occur in people
of any age, gender, race, and size. For people with type one, their bodies do not produce insulin.
Insulin is a hormone that the body needs to transfer sugar from food into the bloodstream to use
for energy. Type one diabetics use insulin therapy and other treatments to manage their condition
and they can live healthy lives. There is currently no cure for type one diabetes which makes it a
chronic condition for those living with it.
Type Two
Type two is the most common type of diabetes. For people with this type, their bodies don’t use
insulin properly, this is called insulin resistance. The pancreas starts making more insulin to
combat high intakes of sugar. Eventually, the pancreas can’t keep up and a person’s blood sugar
will rise which leads to prediabetes and then type two diabetes. There is a period of prediabetes
before type two is diagnosable. During this period, the condition can be reversed with proper
exercise and diet. Over 84 million people in the United States are prediabetic. Since people with
type two still produce insulin on their own, this condition can be managed by eating a healthy diet
and exercising regularly. If enough damage to the pancreas is done, some people may need
medication or insulin support.
Gestational
Some women will develop diabetes during their pregnancy. In most cases, the condition reverses
itself when the baby is born. This condition can be treated with a healthy diet to control the
mother’s blood sugar. Although this condition normally corrects itself soon after delivery, the
mother may still be at risk for developing type two diabetes. The mother will then work with their
doctors to monitor and manage blood sugar.
Nantucket Chronic Disease Report | Page 16Percentage of Population with Diabetes
The following chart looks at the percentage of the population on Nantucket and statewide that had
diagnosed diabetes from 2004 through 2016. There has been a slight increase in diabetes for both
populations with spikes in 2008 and 2009 as well as in 2014 and 2015. The highest reported
percentage of diabetes on Nantucket was in 2015 with a percentage of 8.7. The highest percentage
statewide was in 2014 at 8.8%. While the trend on Nantucket seems to be decreasing as of 2016,
the statewide percentage increased in 2016. Based on the trends of the data, we can expect to see
a slight increase in the percentage of the population with diabetes in the future.
Diagnosed Diabetes by Year, 2004-2016
Nantucket
10
Massachusetts
9
Percentage of Population
8
7
6
5
4
3
2
1
0
2004 2005 2006 2007 2008 2009 2010 2011 2012 2013 2014 2015 2016
Source: CDC
Year
Nantucket Chronic Disease Report | Page 17Mental Health
While mental health conditions are not always considered to be chronic, many people may struggle
with them for long periods of time throughout their lives. Mental health issues and heightened
stress levels have been connected to an increased risk of developing chronic diseases.
Fairwinds Therapy
Fairwinds Counseling Center on island is a valuable resource for individuals and families
suffering from mental illness and substance abuse issues. Their therapeutic services range from
their walk-in urgent behavioral health clinic, to in-home therapy. In 2017, before the walk-in
clinic began, Fairwinds logged 5,960 therapy hours. These hours included evaluations, anger
management therapy, individual therapy, family therapy, and in-home therapy. In 2018,
Fairwinds introduced their urgent behavioral health clinic and they logged a total of 5,703
therapy hours. This decrease in hours can be generally attributed to a small decrease in the
number of in-home therapy hours and outpatient therapy hours. The urgent behavioral health
clinic was introduced in 2018 and is fully funded by a grant. Counselors at Fairwinds were
available for 736 hours for walk-in patients in 2018. In 2019, Fairwinds continued the walk-in
clinic and logged 736 hours of available time for clients for that specific service. There was a
slight increase in the number of in-home therapy hours as well as evaluations and outpatient
therapy hours. The total of hours Fairwinds spent on therapeutic services was 6,971 hours in
2019.
Mental Health Hospitalizations
For many years,
mental health has Mental Health Hospitalizations by Year, 2007-2014
1200
Nantucket
Age-Adjusted Rate Per 100,000
been expressed as
a concern for 1000 Massachusetts
Nantucket 800
residents. This is
600
largely due to the
high rates of 400
suicides and 200
substance abuse
0
on the island. The
2007 2008 2009 2010 2011 2012 2013 2014
following chart Source: MDPH Year
highlights
hospitalizations related to mental health on Nantucket and at the state level. From 2007-2014, the
statewide mental health hospitalization rate has stayed consistent. On Nantucket, there was a dip
in the rate of hospitalizations between 2009 and 2012. Hospitalization rates on Nantucket
increased again in 2013 and 2014. The highest reported mental health hospitalization rate on
Nantucket Chronic Disease Report | Page 18Nantucket was in 2008 at 886.3 per 100,000 people. At the state level, the highest rate was in
2012 at 953.2 per 100,000.
Our Students
NPR reports that up to 1 in 5 students in
Drug Use Among Nantucket Youth Who
public schools across the nation show signs
Considered Suicide
of a mental health disorder. Children who 50 46.3
Percent of Youth
are suffering from mental health disorders 40
are at a disadvantage when it comes to 29.3
30
learning and building relationship with their
20
teachers and peers. Of the 5 million students
suffering, about 80% of them never receive 10
2.4 2.4
therapy, medication, or any other form of 0
treatment according to NPR. As part of a Alcohol Marijuana Cocaine Meth
grant process for the Alliance for Substance Source: Pride Survey Drug Type
Abuse Prevention, the students in grades 6-12 at the Nantucket Public Schools participate in a
youth risk survey called the Pride Survey, bi-annually. In 2017, 5.3% of students reported thinking
about suicide. In 2019, 6.6% of students reported thinking ‘a lot’ or ‘often’ about suicide. While
this increase is not large, it is still a step in the wrong direction.
Intentional Self-Harm Deaths
From 1999-2017, Nantucket has reported 24 deaths related to self-inflicted harm. In
Massachusetts, there were 9921 deaths related to self-inflicted harm during the same period. When
these numbers are adjusted to reflect population, Nantucket had a crude rate of 12.5 per 100,000
while the state had a crude rate of 8 per 100,000. This means that the issue of self-inflicted harm
is more prevalent on Nantucket when compared to the state level. Nantucket also had the highest
rate of self-inflicted harm deaths of all counties in Massachusetts from 1999-2017. This data
supports the ongoing concern for our community’s mental well-being.
Nantucket Chronic Disease Report | Page 19Substance Use
Substance use and misuse can often be attributed to peer pressure, social norms, and/or improper
coping methods. As stated previously, there are many people on Nantucket struggling with
mental health disorders. While there is no doubt that some of our island’s substance use stems
from mental health disorders, it would be inappropriate to assume there is nothing else
contributing to it. It is widely known that the thousands of visitors who travel to Nantucket every
year bring with them a culture of partying. In a community where children grow up witnessing
the excitement of the summer, it is inevitable that some may wish to partake in the fun which
may involve the consumption of alcohol or other drugs.
Alcohol
Based on the results of the Pride survey, there is a large difference in the use of drugs and
alcohol between 11th and 12th graders at Nantucket High School. It was reported that 27.8% of
11th graders drink alcohol on the weekends while 62.7% of 12th graders drink alcohol on the
weekends. The data showed that alcohol use was higher among females in every grade except
6th, 9th, and 12th.
Fairwinds offers DAE, or Drivers Alcohol Education, which is a court-mandated course for
people who have been convicted of a DUI. This course requires each attendee to complete 17
weeks of counseling and education regarding the dangers of driving under the influence. In 2017,
Fairwinds spent 513 total hours on their DAE course, 668 hours in 2018, and 1,292 hours in
2019. This increase in total hours can only be caused by an increase in the number of clients in
these courses since each client is required to complete a standard number of hours per their
mandate. While it is not ideal that more people are seeking DAE services, it is comforting to
know that Nantucket has the necessary resources to support our community’s needs.
Marijuana
Since 2017, Marijuana has been legal for recreational use in Massachusetts. Nantucket opened its
first dispensary, The Green Lady, in August of 2019. It should be noted that although recreation
use of marijuana is legal, it is only legal for people age 21 and over. According to the Substance
Abuse and Mental Health Administration, smoking marijuana is not any less dangerous than
smoking cigarettes. While they are both harmful, more long-term research needs to be done on the
effects of marijuana. Tetrahydrocannabinol (THC), “the chemical responsible for most of
marijuana’s psychological effects,” affects brain cells in circuits related to learning and memory,
coordination, and addiction. Since marijuana affects your sense of time and coordination, it can
affect things like driving. This is concerning since 5.4% of students reported using marijuana in a
car.
Since marijuana is a natural substance, an extremely high dose of THC would be needed to
overdose. It has been estimated that an individual would have to smoke the equivalent of 2,000
joints to ingest a lethal amount of THC. It is very easy for suppliers to lace their product with other
substances without your knowledge. Many times, marijuana is laced with crack cocaine or spice
Nantucket Chronic Disease Report | Page 20(a synthetic form of marijuana, also known as K2). When these chemical substances are
introduced, people are at risk for overdose and even death.
Marijuana Use Among Youth
The following data is all from the 2019 Pride survey conducted by ASAP per a grant approval.
628 students in grades 6-12 were surveyed. Of the 628 students surveyed, 15.2% of them reported
using marijuana during the past year. Most students reported using marijuana at a friend’s house,
including 41.2% of 12th graders who smoke marijuana. Of the high schoolers who reported using
marijuana, an average of 20% of them use it at a friend’s house. In terms of when students use
marijuana, the most common answer was ‘on the weekends’ with 41.2% of 12th graders and 19%
of 11th graders using on the weekends. The percent of 12th graders using marijuana was much
higher than any other grade. Of those that use marijuana, 23% of 12th graders reported using after
school and 11.8% report using during school. Marijuana use was higher among males in grades 9-
12 and higher among females in grades 6-8.
E-Cigarettes
E-cigarettes, also known as vapes, are becoming one of the most popular drugs of choice for young
people in the US. E-cigarettes can be tobacco or marijuana and their small size and subtle smell
makes them easy to hide from teachers and parents. While only 3.5% of students in grades 6-12
reported using e-cigarettes on Nantucket, 4.9% of middle schoolers and 20.8% of high schoolers
nationwide report using them. The legal age to buy e-cigarettes is 21 in Massachusetts.
Of the students that reported using e-cigarettes, 13.7% of 12th graders reported using them at
school, 66.7% of students in grades 6-8 reported getting them from a friend and 75.9% of high
schoolers go theirs from a friend. E-cigarette use was higher among females in every grade except
6th and 11th.
Nantucket Chronic Disease Report | Page 21Other Drugs
Inhalants
The use of inhalants was highest among 12th grade males however, middle schoolers (grades 6-
8) had rates much higher than students in grades 10-11.
Heroin
Some students in grades 8, 9, 11, and 12 reported using heroin at least once in the past year.
Steroids
Steroids were reportedly used by some students in grades 8, 9, 11, and 12 at least once in the past
year.
Ecstasy
Some students in grades 7, 9, 11, and 12 reported that they had used ecstasy at least once in the
past year.
Meth
Meth use was reported at least once in the past year in grades 7, 8, 9 and 12 by some students.
Drug Use by Nantucket Students Grades 6-12
Opioid Pain Killers
Over-the-Counter Drugs
Perscription Drugs
Meth
Ecstacy
Steroids
Heroin
Hallucinogens
Inhalents
Cocaine
Marijuana
Alcohol
E-cigarettes
Cigarettes
Tobacco
0 5 10 15 20 25 30 35
Percentage of Students Using
Source: Pride Survey Annually Monthly
Nantucket Chronic Disease Report | Page 22Narcan
When we think about overdoses, many of us may assume that this tragedy mostly affects adults.
The results of the 2019 Pride survey showed that students in grades 8,9,11, and 12 reported using
heroin. Heroin is extremely addictive and caused 2,343 overdose deaths in 2015 among people
aged 15-24 according to the Substance Abuse and Mental Health Services Administration.
Naloxone, or Narcan, is an FDA approved medication that is used to prevent overdose by opioids
such as heroin, morphine, and oxycodone. Narcan blocks opioid receptor sites to reverse
symptoms of overdose to hopefully prevent permanent brain damage or death.
The following data was reported by the Nantucket Fire Department and the Nantucket Police
Department:
Year # of Responses to Overdoses # of Uses of Narcan
2012 10 Not Recorded
2013 12 Not Recorded
2014 13 Not Recorded
2015 15 Not Recorded
2016 17 11
2017 9 7
2018 15 8
2019 6 6
In recent years, there has been a decrease in the number of times Narcan was administered. Since
Narcan is now available to the public, the Fire and Police Departments have not needed to use
Narcan as frequently. In 2017 and 2019, the number of responses to cases that were classified as
overdoses were significantly less than other years. This may also be attributed to the increased
availability of Narcan. If people are regularly using drugs, chances are they have Narcan available,
so a friend or family member can reverse their overdose which may deter them from ever calling
for help. It should be noted that there is no evidence regarding the reasoning behind the decrease
in overdoses and uses of Narcan, this is just an educated guess.
Nantucket Chronic Disease Report | Page 23You can also read