Nordex SE - Investor Factbook - Nordex Group - Investor Relations Portal

Page created by Bruce Medina
 
CONTINUE READING
Nordex SE - Investor Factbook - Nordex Group - Investor Relations Portal
|

Nordex Group

Nordex SE – Investor Factbook
November 2020 – January 2021

    © Nordex 2020
Nordex SE - Investor Factbook - Nordex Group - Investor Relations Portal
2 | Nordex SE – Investor Factbook

         Experienced management team

              José Luis Blanco            Christoph Burkhard              Patxi Landa
                    CEO                           CFO                         CSO

  › CEO Acciona Windpower           › CFO Siemens Wind Power    › Business Development Director
                                      Offshore                    and Executive Committee
  › Various Senior Management
                                                                  member at Acciona Windpower
    & Chief Officer positions at    › Various other positions
    Gamesa                            at Siemens                › Various Chief Officer
                                                                  positions at Acciona
                                    › BHF Bank, EBRD

   © Nordex 2020
Nordex SE - Investor Factbook - Nordex Group - Investor Relations Portal
3 | Nordex SE – Investor Factbook

         Agenda

                                    1   Company overview & business model

                                    2   Products & markets

                                    3   Financials

                                    4   Nordex share

                                    5   Sustainability

   © Nordex 2020
Nordex SE - Investor Factbook - Nordex Group - Investor Relations Portal
4 | Company overview & business model

         Investment Case

                                                   Strategic drivers

                   Global                                   COE                                Onshore

           Global player with strong              Competitive and COE-driven             Onshore wind energy
            presence in all volume                  product portfolio covers           is the key technology for
           and growth markets for                       all regions and                the irrevocable transition
             onshore wind energy                       market conditions                  to renewable energy

                                                                                               
                                        Shareholder                            Team

                                Strong anchor shareholder             Experienced management
                                 supports growth strategy               and outstanding team

                                                                              
   © Nordex 2020
Nordex SE - Investor Factbook - Nordex Group - Investor Relations Portal
5 | Company overview & business model

         Nordex and Acciona Windpower created a top 4 global player

                                  A strong fit benefitting from complementary approaches

                                         Nordex                       AWP                     Nordex Group

       Market focus                      Europe           +     Emerging markets      =         Truly global

                                  Small & medium-sized           Large developers
     Customer focus                                       +                           =     Broad customer base
                                        customers                    and IPPs

                                    Complex and land             Projects without
      Product focus                                       +                           =      Different projects
                                   constrained projects          land constraints

                                                                                              Complementary
    Technology focus                     Blades           +      Concrete towers      =
                                                                                               technologies

                                                                                            Creating a stronger
                                                                                           and more competitive
                                                                                                 company

   © Nordex 2020
Nordex SE - Investor Factbook - Nordex Group - Investor Relations Portal
6 | Company overview & business model

         Nordex – a pioneer in wind with meanwhile 35 years of experience

  › Global manufacturer of wind energy          › Listed company in the German TecDax
    systems focused on turbines in the 2-5        and SDAX
    MW class
                                                › Founded 1985 in Denmark, IPO in 2001
  › WTG variants for all different wind
    and climate conditions, addressing          › Merger with Acciona Windpower (AWP) in
    the requirements of developed as well         04/2016
    as emerging markets
                                                › Main shareholder Acciona S.A. (36.41%)
  › Production sites in Germany, Spain,
    Brazil, India, USA (mothballed),            › Revenues 2019: Around EUR 3.3bn
    Argentina and Mexico
                                                › Installations of more than 30 GW
  › Headquarter in Hamburg; subsidiaries          in over 40 countries
    for sales and service in all core markets

   © Nordex 2019
            2020 | 27. November 2020 |
Nordex SE - Investor Factbook - Nordex Group - Investor Relations Portal
7 | Company overview & business model

         Strategy further strengthens Nordex competitive position

  We are:                                                 Sustainable | Global | COE Leader

  We focus on:                                                COE | Speed | Flexibility

                                        1             2                   3                   4            5
  We deliver:                  Global market    COE optimized        Supply chain    Operational cost    Service
                                 presence      product portfolio    transformation     efficiencies     business

                                                  Leading global onshore wind turbine supplier

   © Nordex 2020
Nordex SE - Investor Factbook - Nordex Group - Investor Relations Portal
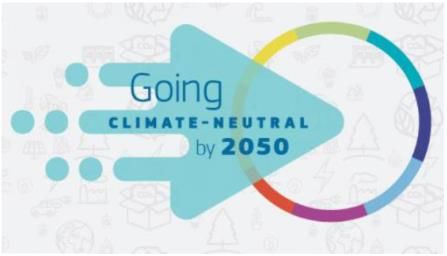
8 | Company overview & business model

         Nordex achieved global top 4 in 2019

    MARKET SHARES (BASED ON MW INSTALLED)

    Europe                       Nordex                                                            Americas             Nordex
                                 Group                                                                                  Group
    placed 4th                 11.5%                                                               placed 4th           7.3%

    Asia pacific                                                                                   Global               Nordex
    (excl. China)                                                                                  (excl. China)        Group
                                                                                                                        7.6%
    No installations in 2019                                                                       placed 4th

                                                     Others

   © Nordex 2020                        Source: Wood Mackenzie Global Wind Power Project Installation Database (2020)
Nordex SE - Investor Factbook - Nordex Group - Investor Relations Portal
9 |Company overview & business model

         Installation track record of Nordex

  MORE THAN 30,735 MW INSTALLED WORLDWIDE

                                       SPAIN    2,277 MW   IRELAND          937 MW       NORWAY        190   MW
                                       FRANCE   2,432 MW   GERMANY        4,683 MW       SWEDEN        537   MW
                                       PORTUGAL   423 MW   POLAND           494 MW       FINLAND       671   MW
                                       ITALY      778 MW   CZECH REPUBLIC    12 MW       DENMARK       152   MW
                                       CROATIA    280 MW   ROMANIA          100 MW       BELGIUM        93   MW
                                       GREECE     261 MW   BULGARIA           8 MW       NETHERLANDS   535   MW
                                       UK       1,468 MW   LUXEMBOURG        23 MW       ESTONIA        18   MW
                                                           AUSTRIA            5 MW       LITHUANIA      70   MW

                                                                                         TURKEY       2,174 MW
                                                                                         PAKISTAN       300 MW
                                                                                         INDIA           78 MW
                                                                                         CHINA        1,053 MW
                                                                                         JAPAN           73 MW
                                                                                         SOUTH KOREA     65 MW
   ARGENTINIA        461   MW
                                                                                         AUSTRALIA      371 MW
   CANADA            203   MW
                                                                                         EGYPT           63 MW
   USA             4,782   MW
                                                                                         SOUTH AFRICA   563 MW
   MEXICO          1,584   MW
                                                                                         OTHERS (ROW)   330 MW
   COSTA RICA         50   MW
   PERU              132   MW
   COLOMBIA           20   MW
   BRAZIL          1,308   MW
   URUGUAY           309   MW
   CHILE             372   MW

   © Nordex 2020
                                                                                     9
Nordex SE - Investor Factbook - Nordex Group - Investor Relations Portal
10 | Company overview & business model

          Long history as one of the pioneers in onshore wind industry

          Founding         First company      Installation                Completion         Commencement                   Installation
          of Nordex        worldwide          of the 100th                of the world’s     of industrial                  of the 2000th
          in Denmark       to produce         Nordex                      first series       rotor blade                    Nordex turbine
                           a MW-class         turbine                     multi-MW           production
                           turbine                       2000             turbine                          2003                          2005             2007

     1985               1995               1999                        2000                2001                          2003                Start of
                                                                                                                                             the series     Opening of
                                                           First AW                                          Opening of the wind             production     production
                                                           60/1300                                           turbine assembly in             of the AW      facility in
                                                           prototype                                         Barásoain, Spain                1500           US

                        Launch of                   Launch of                         Nordex and Acciona            Launch of                       Launch N155/4.5
                        Gamma                       Delta generation                  Windpower become one          4 MW product                    Entry into the
                        generation                                                    company                       series Delta4000                5 MW Class
                                                                                                                                                    Launch
                                                                                                                                                    N149./5.X and
     2008                        2013                             2014                            2016                          2018                N163./5X

                    2010                          2013                            2016                            2017                            2019
                                                                       More than                                                   Launch of
         Introduction                Industrial Implementation         2000 MW of the               Opening of first               N133/4.8 for
         of the AW                   in Brazil with the opening        AW 3000                      assembly plant                 strong wind
         3000                        of hub production plant           platform sold                in India                       sites

    © Nordex 2020
11 | Company overview & business model

          Value chain - Nordex core business

      MORE THAN A MANUFACTURER.

           Project              Wind Farm         Production and Technical          Wind Farm       Services and
         Development          System Planning         Implementation                Operations      Maintenance

          Project                Turbine         Civil             Electrical      Installation &    Service
        Development              Delivery       Works            Infrastructure   Commissioning

    › Selection of location
    › Ownership
    › Optimal siting
    › Wind measurements
    › Soil survey
    › Sound/shade
      emission
    › Economic viability
    › Grid connection
    › Special purpose
      registration
    › Environmental
      permitting
    › Building permitting

    © Nordex 2020
12 | Company overview & business model

          Production footprint supports international supply chain and demand

      GOOD GEOGRAPHICAL FIT FOR PRODUCTION TO SERVE GLOBAL DEMAND.

                                                Germany    Turkey                    China
                                                ›Nacelle   ›Blade                    ›Smart Logistics
                                                ›Blade                               ›Blade (2x)

                                          Spain
                                          ›Nacelle
                                          ›Blade
              Mexico                      ›Tower
              ›Tower
              ›Blade
                                                                          India
                                                                          ›Nacelle
                                             Brazil                       ›Tower
                                             ›Nacelle                     ›Blade
                                             ›Blade
                                             ›Tower (2x)
                                         Argentina         South Africa
                        Chile                              ›Tower
                        ›Tower           ›Nacelle
                                         ›Tower (3x)

    © Nordex 2020
13 | Company overview & business model

          Nordex operates lean and flexible business model

                                               Turbine development, production, projects and logistics
           Asset light
        business model
                                                           Component                                         Project
         in value chain          Turbine Research
                                                         development and
                                                                                    Turbine
                                                                                                           Management
                                  & Development                                    assembly
                                                          manufacturing                                    and Logistics

         Focus on core                                 Wind farm development and operations
         competencies
         by outsourcing
         parts of value                    Project                     Wind farm                         Operation and
             chain                       development                    owners                           maintenance

             Balanced vertical integration allows Nordex to manage capital commitment
                           efficiently and retain a flexible business model

                                                                 Third party        Partially in-house        Key focus/in-house

    © Nordex 2020
14 | Nordex SE – Investor Factbook

           Agenda

                                     1   Company overview & business model

                                     2   Products & markets

                                     3   Financials

                                     4   Nordex share

                                     5   Sustainability

     © Nordex 2020
15 | Products & markets

          Competitive portfolio for all different sites

    Development of product portfolio & pipeline
                                                                                              Future focus on ONE platform with
                          Light                   Medium                  Strong
                          wind                     wind                    wind               market specific derivatives
                                           N149/5.x
          5MW
                                           N163/5.x
                                                                                                                 Delta4000
                                                                        N133/4.8

         4MW+                        N155/4.5

                                  N149/4.0-4.5 incl. 4.8 mode

                                                                    AW116/3000

                                                      AW125/3000-3150
                                                                                                                                           Continuous CoE
                                            AW132/3000-3465                                                 AW
                                                                                                                                           improvements
                             AW140/3000                                                                                                    for low wind sites
         3MW+
                     AW148/3000

                                                                        N100/3300
                                                                                                                                  Phase-out of 3MW Delta
                                                  N117/3000-3600                                    Delta
                                                                                                                                  platform in preparation
                                  N131/3000-3900

                                                                    N90/2500
                                                                                                                       Phase-out of Gamma platform
         2MW+                                   N100/2500                                   Gamma
                                                                                                                       in preparation
                          N117/2400

                          Site dependent                                            today                                                            2022+

    © Nordex 2020
16 | Products & markets

           N149/5.X – Key facts

     WTG design purely focused
      on lowest possible COE                                                  lifetime extension up to 25 years
                                                                                        Standard design lifetime of 20 years

   proven Delta4000 product series
   “Staged Approach” philosophy
                                                             149m rotor
                                                         proven blade of N149/4.0-4.5

      only 5 MW+ WTG based                                                                       >5MW rating

                                            N149/5.X
      on proven platform                                                                           utilizing site potential

                     IEC S class
                          up to IEC A
                                                                                 up to 164m hub heights
                                                  Nacelle dimensions remain
                                                                                               site-specific towers
           suitable in core low-to-               unchanged to N149/4.0-4.5
           medium wind speed sites
                                                                                        104.8 dB(A) @ 5.5 MW
                      first contracts already signed    (major order of 400
                      MW from Norway received in March 2020)
                                                                                         + numerous sound modes

     © Nordex 2020
17 | Products & markets

           N163/5.X – Key Facts

     WTG design purely focused
      on lowest possible COE                                          lifetime extension up to 25 years
                                                                                    Standard design lifetime of 20 years

                                                          163m rotor
    Same nacelle as N149/5.X

                                                                                             >5MW rating

                                          N163/5.X
                                                                                               utilizing site potential
                     IEC S class

                                                                                                Suitable in core
        various site-specific towers                                              low-to-medium wind speed sites
        up to 164m hub height
                                                                                            numerous sound modes
                              Single-piece blade             +20% AEP
                                   based on N149 design      (Annual Energy Production)
                                                             (vs. N149/4.0-4.5)

     © Nordex 2020
18 | Products & markets

           Nordex global service network with more than 21 GW under contract

                                                     EU
                                                   Nordics
                                                   1.3 GW

                                       EU            EU
                                   UK & Ireland    Central
                                      2.2 GW       3.8 GW
             North
            America
                                        EU
             3.6 GW                Mediterranean                             India &
                                      3.5 GW                                 Australia
                                                                              0.0 GW

                                                         E. Europe, Turkey
                                                             & Mid East
                                                                 3.0 GW

                          Brazil
                          1.3 GW
                                                       Rest of
                                                        World
                                                       2.4 GW

     © Nordex 2020
19 | Products & markets

           Service portfolio: Nordex service makes the difference

                     On-site                                            Off-site

                Maintenance           Monitoring &                      Spare Parts                    Training
                & Inspections       Technical Support                   Management

       › Maintenance            › 24/7 Control Centre          › Worldwide supply of          › Uniform qualification of
       › HSE inspections        › Support for technical          spare parts, 365 days          all service technicians
                                  issues                         a year                         worldwide

             Trouble Shooting                        Digital and Data                  Upgrades &
                 & Repair                                Analytics                    Modernizations

       › Onsite repair &                        › Driving digital change,      › Products to enhance
         troubleshooting                          remote diagnostics &           the performance of the
       › Exchange & overhaul                      predictive maintenance.        installed fleet
         of major components

     © Nordex 2020
20 | Products & markets

           Wind will be a prominent source as global energy production rises

             World energy production is rising…                                                            … with onshore wind as a major contributor
                     Electricity generation by region ( PWh)                                                   Cumulative global installed capacity by source (GW)

                      OECD countries              US                    India                                                                 2018
                      European Union              China                 Others                                                                2035

       40.000                                             +39%
                                                                                                                                     528
                                                                                                                Onshore Wind                               +313%
       35.000                                                                                                                                      2,180

       30.000                                                                                                                   22
                                                                                                                Offshore Wind
                                                                                                                                 258
       25.000
                                                                                                                                     526
       20.000                                                                                                             PV
                                                                                                                                                           3,630
       15.000
                                                                                                                       Other               1,451
       10.000
                                                                                                                  Renewables                 1,831
        5.000
                                                                                                                 Conventional                                      4,365
                                                                                                                                                                             +8%
             0                                                                                                        Sources                                        4,731
              2012 2015           2020             2025              2030               2035

                             Strong, continuous growth of onshore wind in the medium term expected

                                         Source: Bloomberg New Energy Finance, New Energy Outlook 2019, as of Jun-2019
                                         Conventional sources include nuclear, coal, gas and oil capacities
     © Nordex 2020                       Other renewables include geothermal, hydro and others
21 | Products & markets

           Global demand for electricity continues to grow and will increasingly
           be met by renewables

     Key drivers of trend                                              Global renewable electricity generation

     › Global demand for electricity will grow by almost                Cumulative renewable electricity generation in China and India
       62% until 2050:
                                                                   PWh
         In non-OECD countries, power demand is
          expected to double                                      30

         Most of the growth comes from large, rapidly                                                            26.4
          expanding economies, especially China and India         25
         In OECD countries, demand will be flat or even                                       +4%                 8.8      OECD
          negative, reflecting a combination of improved energy
                                                                  20                                                        countries
          efficiency, modest economic expansion, and retreat                                    17.9
          from energy-intensive industries
                                                                                                                  10.3     non-OECD
         These dynamics are slightly offset by the               15
                                                                                                6.8                        countries
          increasingly important role of electric vehicles

                                                                  10
     › Cheap renewable energy and batteries                                                     7.2
                                                                              7.2
       fundamentally reshape the electricity system
                                                                   5          3.1
     › A total of USD 13.3 trillion will be invested in new
       power generating capacity between 2018 and 2050,                       2.3
       with over 83% going to renewables                           0
                                                                             2018              2035e             2050e

     © Nordex 2020                 Source: BNEF NEO 2019
22 | Nordex SE – Investor Factbook

           Agenda

                                     1   Company overview & business model

                                     2   Products & markets

                                     3   Financials

                                     4   Nordex share

                                     5   Sustainability

     © Nordex 2020
23 | Financials

           Executive summary

      9M/2020 RESULTS

                       Sales                             EBITDA margin                            Working capital ratio
                     EUR 3,167m                                2.2%                                        -5.7%

     › Order intake amounted to 3,759 MW in 9M/2020 with a share of 81% coming from turbine generation Delta4000.

     › 9M/2020 sales of EUR 3.2bn up 63% versus 9M/2019 (EUR 1.9bn).

     › EBITDA of EUR 71m versus EUR 60m (3.1%) in 9M/2019 and despite Covid-19 slightly better working capital ratio at minus
       5.7% (9M/2019: minus 5.2%).

     › 9M/2020 results negatively impacted by Covid-19 and major non-recurring events accounting for approximately EUR 300m
       in FY 2020.

     › Sale of Nordex European project development pipeline to RWE for around EUR 400m successfully completed.

     › Nordex scored a share of 31% in Germany’s latest auction in October sharing top position with Vestas.

     › Reinstated new guidance for FY 2020 with sales of approx. EUR 4.4bn and an EBITDA margin of 2%.

     › Strategic targets set for FY 2022: Sales of approx. EUR 5bn with an EBITDA margin of 8%.

     › Comprehensive company program in implementation in order to secure performance in FY 2021 and fulfillment of strategic
       targets for FY 2022.

     © Nordex 2020
24 | Financials

            COVID-19 and major non-recurring events impacting EBITDA in 2020

      General                              Replacement   EPC
      Covid-19          Blade                 of sub-   project           1   Productivity impacts on production and projects due to supply
       impact         ramp up       LD`s    contractors Nordics   Total       disruption and restricted movement of goods and people
                                                                               Covid-19 containment measures defined and executed
                                                                               Catch-up measures in place: Operations back to normal
  1
                                                                          2   Limited availability of manpower in blade factories led to delayed
                                                                              blades, projects and underutilization costs
                                                                                Keep the production running to mitigate further project delays
                                                                                Output now increasing and stable, back on track expected in
                                                                                 Q1/2021
                 2
                                                                          3   Reduced deliveries leading to project delays and causing LD`s

                                                                                Upgraded and stronger production ensures reliable future deliveries
                                                                                Second Covid-19 wave did NOT cause supply chain delays
                                3
                                                                          4   Replacement of suppliers and subcontractors severely affected by
                                                                              Covid-19 in Latin America and South Africa was difficult
                                                                               New business in Argentina stopped for the time being and execution
                                           4                                    in South Africa turned around
                                                                               Increased on-site supervision and acceleration measures

                                                                          5   Geotech issues in large Nordic EPC project leading to delays and
                                                                              cost overruns
                                                     5                          Increased quality and contract management
                                                                                Lessons learned and reorganisational measures implemented
                                                                                No spill over risk in other markets due to nature of business

      © Nordex 2020
25 | Financials

           Order intake 9M/2020

   Order intake turbine* (in MW)                             Order intake turbine* (in MW) by regions (in %)

                                                                Europe     North America   Latin America      RoW
                               -21%
                      4,742

                                                     3,759                45%
                                                                                                            64%

                                                                          34%
                                                                                                            16%

                                                                          18%                               20%
                                                                          3%                                0%
                     9M/2019                      9M/2020
                                                                         9M/2019                           9M/2020

    › Order intake in 9M/2020: EUR 2,642m (EUR 3,314m        › Largest orders received from USA, Norway, Great
      in previous year period)                                 Britain, Spain and Chile in 9M/2020

      thereof in Q3/2020:                                    › 86% of order intake accounts for Delta4000
      EUR 836m (EUR 1,199m in Q3/2019)                         generation in Q3/2020 and 81% for the first nine
                                                               months 2020
    › ASP remains stable of EUR 0.70m/MW in 9M/2020
                                                             › Order intake received from 20 different countries in
                                                               9M/2020 showing well balanced footprint

     © Nordex 2020              *Group segment „Projects“
26 | Financials

           Service 9M/2020

     Development of service revenues (EUR m) and EBIT margin               Comments
     EBIT margin       17.6%                 14.8%
                                                                           › Service sales share accounts for 10.0% of group sales
                                 +11%                                        in the first nine months 2020
                                             318.3                         › Service EBIT margin of 14.8% at the end of 9M/2020
                       287.1
                                                                           › 97.4% average availability of WTGs under service

                                                                           › Strong service order backlog of around EUR 2.8bn at
                                                                             the end of 9M/2020

                      9M/2019               9M/2020
     Share of fleet under contract (as % of installed base)

                                                      under contract
                                                      not under contract
                        31%

                                Installed
                                  base:
                                30.7 GW               Thereof:
                                                      72% Nordex WTGs
                                            69%       28% AWP WTGs

     © Nordex 2020
27 | Financials

           Order backlog remains on high level: EUR 7.9bn at the end of 9M/2020

   Order backlog turbines (EUR m)                         Order backlog service (EUR m)

                                                                                 +12%
                               -9%
                      5,651                                                                   2,768
                                        5,138                       2,476

                     9M/2019           9M/2020                     9M/2019                   9M/2020

    › Turbine order backlog of EUR 5,138m at the end of   › 8,192 wind turbines under service corresponding to
      9M/2020 remains on a high level                       21.1 GW at the end of 9M/2020

    › Distribution on Nordex focus markets: Europe
      (62%), Latin America (16%), North America (15%),
      RoW (7%)

     © Nordex 2020
28 | Financials

           Income statement 9M/2020

    in EUR m (rounded figures)                      9M/2020                9M/2019    abs. change   Comments

    Sales                                                     3,167          1,943          1,224
                                                                                                    › Sales figures of EUR 3,167m
    Total revenues                                             3,108          2,520           588     at the end of Q3/2020
                                                                                                      reflecting overall growth of
    Cost of materials                                         -2,764         -2,004          -760     Nordex despite the pandemic
    Gross profit                                                     343       515          -172
                                                                                                    › EBITDA carry significant
    Personnel costs                                              -314         -265            -49     Covid-19 impact and non-
                                                                                                      recurring costs counter-
    Other operating (expenses)/income                                 41      -190            231     balanced by proceeds from
                                                                                                      the pipeline sale to RWE
    EBITDA                                                           71         60            11

    Depreciation/amortization                                    -115         -102            -13   › RWE transaction has been
                                                                                                      recognized as Other operating
    EBIT                                                             -44       -42             -2     income
    Net profit                                                  -108           -77            -31   › PPA depreciation amounted to
    Gross margin*                                           10.8%           26.5%
                                                                                                      EUR 19m in 9M/2020 (EUR
                                                                                                      18m in 9M/2019)
    EBITDA margin                                              2.2%          3.1%

    EBIT margin w/o PPA                                      -0.8%           -1.2%

     © Nordex 2020              *Gross profit in relation to sales
29 | Financials

           Balance sheet 9M/2020

    in EUR m (rounded figures)                30.09.20                       31.12.19              abs. change                  Δ in %   Comments

    Non-current assets                                  1,495                       1,489                               6          0.4
                                                                                                                                         › Cash position of EUR 408m
                                                                                                                                           at the end of 9M/2020 (EUR
    Current assets                                      3,171                       2,514                           657           26.1     334m end of Q2/2020)
    Total assets                                       4,665                       4,003                           662            16.6   › Increase in current assets due
                                                                                                                                           to recognition of transaction,
    Equity                                                 635                         745                        -110           -14.8     i.e. sale of European project
                                                                                                                                           development business to RWE
    Non-current liabilities                                850                         914                           -64          -7.1
                                                                                                                                         › Reclassification of promissory
    Current liabilities                                 3,181                       2,343                           838           35.7     notes (SSD) into current
                                                                                                                                           liability
    Equity and total liabilities                       4,665                       4,003                           662            16.6
                                                                                                                                         › Refinancing of promissory
                                                                                                                                           notes of EUR 215m due in
    Net debt*                                              493                            84
                                                                                                                                           April 2021 already been
                                                                                                                                           secured in the context of the
    Working capital ratio**                            -5.7%                       -9.1%
                                                                                                                                           state-guaranteed RCF
    Equity ratio                                      13.6%                        18.6%

                                   *Bank borrowings, bond, employee bond and shareholder loan less cash and cash equivalents.
     © Nordex 2020                 **Based on last twelve months sales.
30 | Financials

           Working capital development 9M/2020

   Working capital ratio (in % of sales)*                                   Working capital development (in EUR m)*

                                                                                                  33

                                                                                                            107
         -5.2                                                                          237
                                                                     -5.7
                                                                                                                     49
                                                  -7.1
                              -7.5                                                                                          -258

                     -9.1                                                     -306
         Q3/          Q4/     Q1/                 Q2/                Q3/      Q2/    Receiva-   Inven-    Prepay-   Pay-    Q3/
        2019         2019    2020                2020                2020    2020      bles      tories    ments    ables   2020

    › Working capital ratio impacted by Covid-19 but still                  › Temporary increase of receivables due to Covid-19
      on a very acceptable level                                              related project delays

     © Nordex 2020             *Based on last twelve months sales.
31 | Financials

           Cash flow statement 9M/2020

    in EUR m                                               9M/2020   9M/2019   Comments

    Cash flow from operating activities                                        › Negative cash flow from
                                                              -239       -94
    before net working capital                                                   operating activities not yet
                                                                                 reflecting cash from RWE
    Cash flow from changes in WC                               -42        31     transaction (received on
                                                                                 November 2nd)

                                                                               › Cash flow from investing
    Cash flow from operating activities                       -281       -63
                                                                                 activities mainly reflects
                                                                                 ongoing expansion of supply
                                                                                 chain and blade production
    Cash flow from investing activities                        -97       -93
                                                                                 facilities

                                                                               › Cash flow from financing
    Free cash flow                                            -378      -156     activities largely determined
                                                                                 by funds received from new
                                                                                 RCF and outflows from leasing
    Cash flow from financing activities                        298       -62     payments and repayment
                                                                                 under EIB facility
    Change in cash and cash equivalents*                       -80      -218

     © Nordex 2020                 *Including FX effects
32 | Financials

           Total investments 9M/2020

   CAPEX (in EUR m)                                   Comments

        Property, plant, equipment                    › Investments in 9M/2020 primarily comprise:
        Intangible assets
                                                        •   Investments in blade production facilities in
                                     7.6%                   Mexico, India and Brazil
                                             108.6
                                                        •   Investments in installation and transport tooling
                      100.9
                                                            and equipment for international projects

                                                        •   Investments in product development

                                                      › Slight decrease in intangible assets due to lower
                                                        level of development costs compared to previous
                                             90.3       year period
                      80.9

                      20.0                   18.3

                     9M/2019                9M/2020

     © Nordex 2020
33 | Financials

           Capital structure 9M/2020

   Net debt*/EBITDA**                                                                                 Equity ratio (in %)

                                                                                                      30
                                                        6.7
      7
      6                                                                                               25
      5
      4                                                                         3.6
                                                                                                      20                   18.6
      3     2.2                                               Ambition                                                            17.3
      2                                                        level                                           15.5
                     0.7            1.2                                                               15                                    13.8         13.6
      1
      0
     -1                                                                                               10
        Q3/           Q4/      Q1/                     Q2/                   Q3/                        Q3/                 Q4/    Q1/       Q2/        Q3/
       2019          2019     2020                    2020                   2020                      2019                2019   2020      2020        2020

    › Leverage ratio in Q3/2020 decreased as expected                                                 › Equity ratio remains on a similar level compared to
      due to EBITDA contribution from RWE transaction                                                   Q2/2020

                             * Bank borrowings, bond, employee bond and shareholder loan less cash and cash equivalents.
     © Nordex 2020           ** Based on last twelve months.
34 | Financials

           Comprehensive financing structure successfully closed

               Details      Revolving credit facility (RCF)   Participating Lenders          Recent financing activities

     Amount:                350m EUR
                                                                                      › Three-year extension of EUR 1.21bn multi-
     Duration:              30th April 2022                                             currency guarantee facility (MGF) was
                                                                                        closed on April 9th
     Number of banks:       9                                                         › RCF of EUR 350m backed by German
                                                                                        State guarantee covering 90% was
     Purpose:               • General corporate purposes                                closed on August 6th
                            • Cash drawings
                                                                                      › RCF provided by a consortium of nine
                                                                                        lenders was significantly oversubscribed
     Security:              • Unsecured
                            • Pari-passu                                              › Refinancing of promissory notes
                                                                                        (Schuldscheindarlehen) of EUR 215m due
                                                                                        in April 2021 has been secured in the
                                                                                        context of the state-guaranteed RCF

                                                                                      › MGF and RCF contain an ESG component
     ESG rating provider:   ISS ESG                                                     and fit seamlessly into the company`s
                                                                                        sustainable financing structure

     ESG company rating:    B

     © Nordex 2020
35 | Financials

           Operations 9M/2020

   Installations (MW)                                        Production

                               +144%                          Turbine assembly (MW)         Blade production (#)
                                           3,817
                                                                        +43%                         -9%
                                                                               4,415         1.093
                                                                                                             990

                                                                3,095

                      1,565

                     9M/2019             9M/2020               9M/2019     9M/2020         9M/2019         9M/2020

    › Total installations of 1,052 WTGs in 21 countries in   › Output turbines amounts to 1,154 units in 9M/2020:
      the first nine months 2020: 43% Europe, 33%              594 GER, 332 ESP, 154 IND, 64 BRA and 10 ARG
      North America, 18% Latin America and 6% Rest of
      world                                                  › Inhouse blade production of 990 units in 9M/2020:
                                                               521 GER, 220 MEX, 194 IND and 55 ESP

                                                             › Outsourced blade production of 2,065 units in
                                                               9M/2020 (9M/2019: 1,695 units)

     © Nordex 2020
36 | Financials

           New guidance FY 2020 reinstated

                     Sales:                   approx. EUR 4.4bn

                     EBITDA margin:           2%

                     Working capital ratio:   below -4%

                     CAPEX:                   approx. EUR 170m

     © Nordex 2020
37 | Financials

           Drivers to keep the order intake momentum to support strategic targets
           for FY 2022

                       Highly competitive product
                        portfolio with Delta4000                        Strong market position
                                 turbines
                                                                      › Nordex EU TOP 2 player in
                     › One of the leading sold turbines                terms of order intake in 2020
                       in the 4 - 5 MW class worldwide
                                                                      › Good position in the US and
                      › Ideally qualified to serve the                   leading position in LatAm
                       European demand and shifting
                          the US to the 5 MW class                      › Strong customer base

                                                          DRIVERS

                      Supply chain in India up to 4
                              GW planned
                                                                    Remaining strong order intake
                     › Will deliver substantial volumes
                                  in the future                       › Vast majority of firm order
                                                                        intake for FY 2021 already
                       › Will lead to significant cost                            secured
                                    savings
                                                                     › Increased demand for 5 MW
                         › Will support mid-term                                platform
                              competitiveness

     © Nordex 2020
38 | Financials

           Modules of company program

                     Initiative clusters                           Initiative targets                          Overall project status

      1    Supply chain transformation               › Setting up 4 GW supply chain in India and     › Supply chain topics starting to mature
                                                       moving current EU partners to India             into contracting stage already
      2    Productivity enhancement                  › Safer, stronger ramp-up and focus on
                                                       efficiency and productivity
                                                                                                     › 2021 and 2022 costs being negotiated
      3    Increase service profitability            › Building a global service unit to further       show material improvement compared to
                                                       improve the margin profile                      current base levels
      4    PM/EPC excellence                         › Using experience of examples of excellence
                                                       from high-performance countries for new
                                                       markets                                       › Further initiatives beyond procurement
                                                                                                       being integrated to allow sustainable
      5    Product delivery                          › Stay at the curve of the market benchmark       transformation into 2022 and beyond
                                                       for products

      6    Continuation of the sales success story   › Stay in top 3 position in onshore business,
                                                       as already shown over the last 5 to 6         › Sales in the onshore wind industry
                                                       quarters                                        continue to reach or approach the second
      7    Expanding engineering further                                                               highest pace
                                                     › Expand presence and competency depth
                                                       with a new engineering office in India to
                                                       secure new supplies

     © Nordex 2020
39 | Financials

           Strategic targets for FY 2022

                  Sales:           approx. EUR 5bn

                  EBITDA margin:   8%

                  Capacity:        6 GW+

     © Nordex 2020
40 | Nordex SE – Investor Factbook

           Agenda

                                     1   Company overview & business model

                                     2   Products & markets

                                     3   Financials

                                     4   Nordex share

                                     5   Sustainability

     © Nordex 2020
41 | Nordex share

           Stable shareholder structure and strong market coverage

   Shareholder structure                                                            Analyst coverage

                                                                                                        Sell
                     Freefloat
                                                                                                          1
                                                     Acciona S.A.

                                          36.41%

                                                                                                                         7 Buy

                      63.59%                                                                 Hold 6

   Key figures:*                                                                    Consensus of 14 analysts:**

   › Number of shares:           106,680,691                                        › Ø Share price:              EUR 18.00
   › Share price:                EUR 16.70                                          › Ø 2020 Revenues (e):        EUR 4,4bn
   › Market capitalization:      EUR 1,8bn                                          › Ø 2020 EBITDA margin (e):   1.7%

                                 *As of 13th November 2020
     © Nordex 2020               ** Nordex own consensus as of 23rd November 2020
42 | Nordex share

           Nordex share price development (Jan 2019 – 23 November 2020)

                     Share price significantly recovered since Covid-19 dip in March 2020

     © Nordex 2020
43 | Nordex share

           Strong and committed anchor shareholder

     › Acciona Group profile / strategy                                            › Recent support for Nordex
    › Holding company with a presence in over 40 countries that invests,
      develops and operates infrastructure, with a particular emphasis on
      renewable energy
                                                                                               Continuously strong commitment to strategic
    › Group operates through three main business segments:                                     investment into Nordex recently underpinned
        › Infrastructure: Covers construction activities, industrial activities,               by €99m capital increase in October 2019
          concessions, water and services
        › Energy: Includes activities ranging from construction of
          wind farms to generation and distribution                                             1› Long-term supportive shareholder since merger
                                                                                                   of wind turbine business into Nordex in 2016
        › Other: Deals with businesses relating to fund
          management and stock market brokerage, wine
          production, real estate business and other
          investments                                                                           2› Additional liquidity facilitates expected growth
                                                                                                   due to ongoing demand for Delta4000 platform

    Key facts FY 2019:
    › Market capitalization: c. €5.2bn                                                          3› Commitment of anchor shareholder proves
                                                                                                   Nordex’ path of profitable growth
    › Revenue: €7.2bn
    › EBITDA: €1.4bn
    › Established track record across Debt and Equity Capital Markets
    › Entrecanales family as main anchor shareholder holding over 50%,
      free float c. 39%

     © Nordex 2020
44 | Nordex SE – Investor Factbook

           Agenda

                                     1   Company overview & business model

                                     2   Products & markets

                                     3   Financials

                                     4   Nordex share

                                     5   Sustainability

     © Nordex 2020
45 | Sustainability

           Macro & long-term drivers: the trend to renewables is irrevocable

                                                                                        Repowering

                                          On its way to an economy with
                                          net-zero GHG emissions: EU aims
                                          for climate neutrality by 2050

                                                                               10,000 WTGs running out alone
       The European Green Deal as a
                                                                                within the next three years in
       multilayer regulatory package              DRIVERS                       Germany. Further repowering
                                                                                potential coming from the US,
                                                                                   Denmark, Spain, India

         Draft of upcoming EEG                       German                          Regional projects:
        amendment for Germany                      Investitions-
       passed in September 2020:           beschleunigungsgesetz: will
    strong political signal of change -   support wind power projects in    100% electricity from renewables for
     expansion path onshore wind is          Germany, e.g. improving        federal state Schleswig-Holstein and
       targeted at 71 GW by 2030              permitting processes                   Hamburg until 2035

     © Nordex 2020
46 | Sustainability

           Sustainability strategy 2019 to 2021

     © Nordex 2020
47 | Sustainability

           Sustainability key facts

   Product                                                                                 Employees

        Lifecycle assessment of wind farm with Delta4000                                               Lost time injury frequency (LTIF) lowered to
                         turbines shows:                                                                      4.6 in FY 2019 (FY 2018: 5.6)
                        only 6.4 g CO2e
        are emitted per kilowatt-hour electricity generated
                                                                                                                           73
                                                                                                    nationalities were working at Nordex in FY 2019

            A single Nordex large-scale turbine1 covers
          the average annual electricity demand of about                                   Environment
                              3,000
                                                                                                                         73.5%
                     four-person households2.
                                                                                                      of the overall amount of purchased electricity
                                                                                                           in 2019 was generated by the use of
                                                                                                                       renewables
                         474 g of CO2
          are saved per kWh generated by wind turbines                                     ESG-Rating
         (compared to the German electricity mix 20183).
      Projection for one Delta4000 at medium wind speed:                                           ISS-ESG (B), MSCI (A), SUSTAINALYTICS (25.8),
                        savings of approx.                                                                     CDP (C) and IMAG (AA)
                      6,300 t CO2 per year.

                           1 Reference: N149/4.0-4.5, medium wind speed of 6.5m/s, excl. losses.
                           2 https://www.musterhaushalt.de/durchschnitt/stromverbrauch/ average electricity demand of 4,432 kWh per year.
     © Nordex 2020         3 https://www.umweltbundesamt.de/sites/default/files/medien/1410/publikationen/2019-04-10_cc_10-2019_strommix_2019.pdf.
48 | Nordex SE – Investor Factbook

           Preliminary financial calendar 2021*

    2021                                                Event

    March                                               Publication of preliminary figures FY 2020

    23 March                                            Publication of Annual Report 2020

    Spring                                              Capital Markets Day

    11 May                                              Interim Statement Q1/2021

    1 June                                              Annual General Meeting

    12 August                                           Interim Report H1/2021

    15 November                                         Interim Statement 9M/2021

     © Nordex 2020                   * Subject to change and the further development of the Covid-19 pandemic.
49 | Nordex SE – Investor Factbook

           Disclaimer

   › All financial figures within this presentation are unaudited.

   › This presentation was produced in November 2020 by Nordex SE solely for use as a source of
     general information regarding the economic circumstances and status of Nordex SE. It does not
     constitute an offer for the sale of securities or an invitation to buy or otherwise acquire securities in
     the Federal Republic of Germany or any other jurisdiction. In particular it is not intended to be an
     offer, an investment recommendation or a solicitation of an offer to anyone in the U.S., Canada,
     Japan and Australia or any other jurisdiction. This presentation is confidential. Any reproduction or
     distribution of this presentation, in whole or in part, without Nordex SE’s prior written consent is
     expressly prohibited.

   › This presentation contains certain forward-looking statements relating to the business, financial
     performance and results of Nordex SE and/or the industry in which Nordex SE operates, these
     statements are generally identified by using phrases such “aim”, “anticipate”, “believe”, “estimate”,
     “expect”, “forecast”, “guidance”, “intend”, “objective”, “plan”, “predict”, “project”, and “will be” and
     similar expressions. Although we believe the expectations reflected in such forward-looking
     statements are based upon reliable assumptions, they are prepared as up-to-date and are subject
     to revision in the future. We undertake no responsibility to update any forward-looking statement.
     There is no assurance that our expectations will be attained or that any deviations may not be
     material. No representation or warranty can be given that the estimates, opinions or assumptions
     made in, or referenced by, this presentation will prove to be accurate.

     © Nordex 2020
50 |

             Contact details

                               IF YOU HAVE ANY QUESTIONS PLEASE
                               CONTACT THE INVESTOR RELATIONS TEAM:

                               Felix Zander
                               Phone:    +49-40-30030-1116
                               Email:    fzander@nordex-online.com

                               Tobias Vossberg
                               Phone:   +49-40-30030-2502
                               Email:   tvossberg@nordex-online.com

                               Rolf Becker
                               Phone:   +49-40-30030-1892
                               Email:   rbecker@nordex-online.com

                               Nordex SE
                               Langenhorner Chaussee 600
                               22419 Hamburg / Germany
                               www.nordex-online.com

       © Nordex 2020
You can also read