Diabetic condition induces hypertrophy and vacuolization in glomerular parietal epithelial cells - Nature
←
→
Page content transcription
If your browser does not render page correctly, please read the page content below
www.nature.com/scientificreports
OPEN Diabetic condition induces
hypertrophy and vacuolization
in glomerular parietal epithelial
cells
Takahisa Kawaguchi1, Kazuhiro Hasegawa1, Itaru Yasuda1, Hirokazu Muraoka1,
Hiroyuki Umino1, Hirobumi Tokuyama1, Akinori Hashiguchi2, Shu Wakino1* & Hiroshi Itoh1
Diabetic nephropathy (DN) is accompanied by characteristic changes in the glomerulus, but little
is known about the effect of diabetes on parietal epithelial cells (PECs). In this study, a descriptive
analysis of PECs was undertaken in diabetic db/db mice and in diabetic patients. PEC hypertrophy was
significantly more prominent in diabetic mice than in nondiabetic mice, and this was evident even at
the early stage. Additionally, the number of vacuoles in PECs was markedly increased in diabetic mice,
suggesting the presence of cellular injury in PECs in DN. Although rare, binuclear cells were observed
in mice with early diabetes. In cultured PECs, a high glucose condition, compared with normal glucose
condition, induced cellular hypertrophy and apoptosis. Flow cytometry showed that some PECs in the
G0 phase reentered the cell cycle but got arrested in the S phase. Finally, in human diabetic subjects,
hypertrophy and vacuolization were observed in the PECs. Our data showed that PECs undergo
substantial changes in DN and may participate in rearrangement for differentiation into podocytes.
Diabetic nephropathy (DN) has been the leading cause for the initiation of renal replacement therapy, accounting
for approximately one-third of cases worldwide1. The renal pathological changes in early DN is characterized by
glomerular basement membrane (GBM) thickening and mesangial expansion, and those in late DN is character-
ized by glomerular nodular lesions2,3. These pathological alterations were mainly examined in the glomerular
lesions, with focus on podocytes, mesangial cells, and endothelial cells.
In addition to the mentioned glomerular cells, parietal epithelial cells (PECs) comprise another type of
resident glomerular cells; they are epithelial cells lining the Bowman’s c apsule4. Recently, PECs have been receiv-
ing great attention as progenitor cells of podocytes5,6 and as barrier-forming cells that prevent periglomeru-
lar ultrafiltrate leak7. Although PECs were reported to be strongly involved in the pathogenesis of crescentic
glomerulonephritis8,9 and focal segmental glomerulonephritis (FSGS)8,10,11, only a couple of reports have investi-
gated the role of PECs in the pathogenesis of DN. The thickening of the Bowman’s capsule basement membrane
(BBM) and capsular drop lesions have been known to be the representative morphological changes in PECs and
Bowman’s capsule in DN12,13. Similar to the GBM, the BBM is also thickened in DN. PECs contribute to this
phenomenon through the expression and secretion of Bowman’s capsule proteins, including c ollagen12. Capsu-
lar drop lesions are insudative lesions that can be identified as a round eosinophilic accumulation of materials
between the PECs and the BBM in DN13. In human renal biopsies of DN patients, cells marking as podocytes
on Bowman’s capsule increased, and Ki-67-expressing cells were identified on the glomerular tuft and Bow-
man’s capsule14. Although crescent formation is rarely observed in DN, these crescentic cells coexpressed PEC
and podocyte markers, which suggested that PEC may transdifferentiate into podocytes in response to severe
glomerular injury in D N15.
In the present study, we have examined the histopathologic changes in PECs that were evident in DN. Our
results indicated that PECs were hypertrophied and injured in DN, which may be associated with the pathogen-
esis of DN in mice and humans.
1
Department of Internal Medicine, School of Medicine, Keio University, 35 Shinanomachi, Shinjuku‑ku,
Tokyo 160‑8582, Japan. 2Department of Pathology, School of Medicine, Keio University, Tokyo 160‑8582,
Japan. *email: shuwakino@z8.keio.jp
Scientific Reports | (2021) 11:1515 | https://doi.org/10.1038/s41598-021-81027-8 1
Vol.:(0123456789)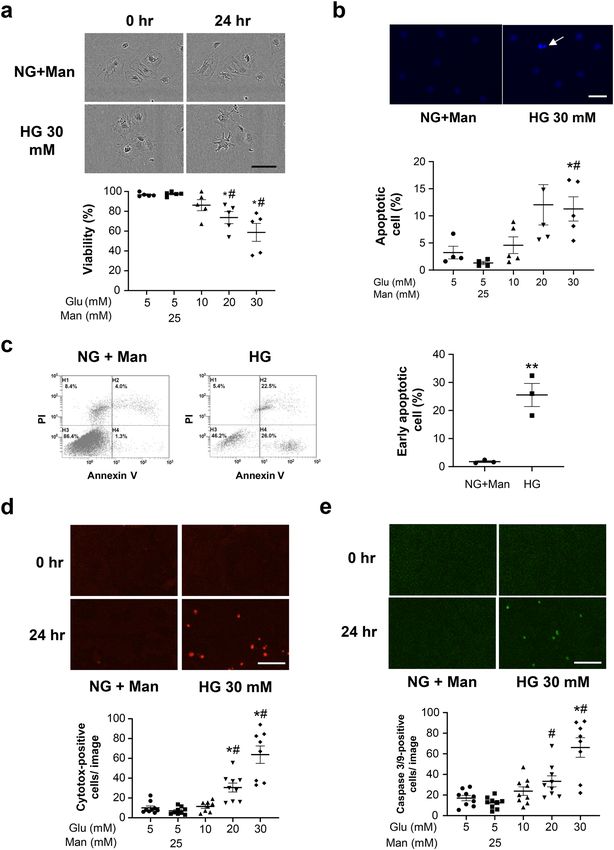
www.nature.com/scientificreports/
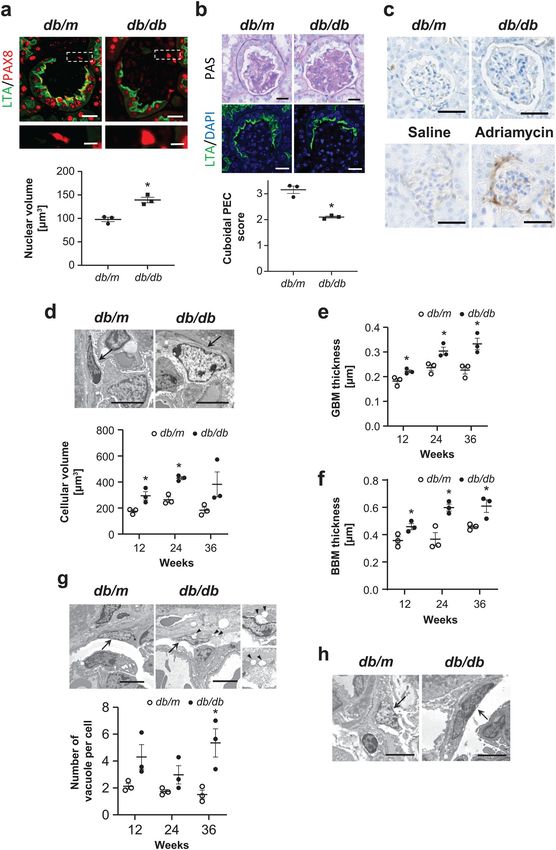
Figure 1. Morphological changes in PECs in diabetic db/db mouse. (a) Representative images of PAX8- ▸
LTA costaining in the 12-week-old db/m and db/db mice. The magnified view of the boxed region in the
upper panel is shown in the lower panel. The dot plot graph shows the mean nuclear volume of PECs. (b)
Representative images of PAS staining (upper) and LTA staining (lower) in the 12-week-old db/m and db/
db mice. The dot plot graph shows the average of semiquantitative cuboidal PEC score in the db/m and db/db
mice. (c) Immunostaining for CD44 in kidneys from the experimental mice groups (i.e., db/m, db/db, saline-
treated, and adriamycin-treated). (d) Representative PECs (arrows) on transmission electron microscopy at
12 weeks of age in each mouse group. The dot plot graphs show the temporal changes in the cellular volume of
PECs. (e,f) Temporal changes in the GBM thickness (e) and BBM thickness (f) in the db/m and db/db mice.
(g) Representative PECs (arrows) on transmission electron microscopy at 24 weeks of age in the db/m and db/
db mice. Arrowheads indicate the vacuole in PECs. The right inserts are the views on higher magnification.
Quantitative analysis of the number of vacuoles per cell is shown in the lower panel. (h) A binucleated PEC is
identified in db/db mice at 12 weeks of age but not in db/m mice. Arrows indicate PECs. PECs, parietal epithelial
cells. *P < 0.05 vs. db/m mice. Scale bars: (a up) 20 μm, (a low) 5 μm, (b,c) 20 μm and (d,g,h) 5 μm.
Results
PEC hypertrophy and damage in DN mice. Compared with nondiabetic db/m mice, the eight week-
old diabetic db/db mice had significantly higher blood glucose levels (446 ± 138.3 mg/dL vs. 117 ± 7.4 mg/
dL, P < 0.05), which remained persistently elevated above 600 mg/dL at 12, 24, and 36 weeks of age. The db/
db mice developed albuminuria with increased albumin-to-creatinine ratio at as early as eight weeks of age
(138.3 ± 22.4 μg/mg vs. 51.6 ± 7.4 μg/mg, P < 0.05) and remained thereafter until 36 weeks of age. Serum cre-
atinine levels were not significantly different at 12, 24 and 36 weeks of age. In morphological analysis, light
microscopy revealed nuclear hypertrophy of flat PECs in 12-week-old diabetic db/db mice by measuring the
PAX8 positive area per cell (Fig. 1a). On the basis of the cuboidal PEC score, as described in the Methods section,
the cuboidal cells on the Bowman’s capsule were significantly less prominent in 12-week-old male db/db mice
than in male db/m mice, respectively (Fig. 1b). CD44, which is an activated PEC marker, was not positive in the
hypertrophied PECs in the diabetic db/db mice at 12, 24 and 36 weeks, whereas CD44 was positive in PECs in
adriamycin nephropathy, as previously r eported16 (Fig. 1c). On electron microscopy, we confirmed PEC hyper-
trophy (Fig. 1d), which was evident as early as 12 weeks. Examination for the other early histological changes
in DN revealed evident thickening of both the GBM and BBM from 12 weeks (Fig. 1e,f, respectively). Cellular
hypertrophy sometimes induces cell apoptosis or cell damages in various cell types17–20. The PECs had no appar-
ent changes in apoptosis but exhibited vacuolar degeneration, which is reported to be a result of cell damage21,22;
time course analysis revealed that this change was evident at 36 weeks of age (Fig. 1g). In addition, we observed
PECs with binuclear cells in the 12-week-old db/db mice (Fig. 1h). This morphological change may indicate the
state of mitotic catastrophe, as previously reported in podocytes23–25.
High glucose exposure induced PEC hypertrophy in vitro. To elucidate the mechanisms for the
hypertrophic changes in PECs, we used an established immortalized PEC cell line23. The expressions of PEC-
specific mRNAs, claudin-1, pax-2, pax-8, and CD10 were high, whereas the expressions of the podocyte-specific
mRNAs, WT-1, nephrin, podocin, synaptopodin, nestin and desmin were low or barely detected (Fig. 2a). To
further verify the morphological features of PECs in culture, we stained the cells with the cytoskeletal protein
F-actin. There was a thin linear staining with F-actin in the cytoplasm and along the cell borders, reflecting the
characteristic simple cytoskeletal structures of PECs, as previously d escribed23 (Fig. 2b). We examined the effect
of high glucose exposure. On flow cytometry, cell size was significantly greater in the PECs cultured under high
glucose (HG, 30 mM) conditions than in those under normal glucose (NG, 5 mM) plus 25 mM mannitol (Man)
condition (Fig. 2c). The ratio of the total cellular protein to cell number, which is another indicator of cellular
hypertrophy, revealed HG-induced hypertrophic changes in the PECs (Fig. 2d). The cellular size of PECs was
not increased by simulation with other hypertrophic factors, including TGF-β124, insulin, or aldosterone, with
or without sodium c hloride25 (Fig. 2e). Because hypertrophy is often accompanied by cell cycle arrest26, we
analyzed the cell cycle distribution in PECs using flow cytometry. In an HG condition, the percentage of cells
decreased in the G0/G1 phase and increased in the S phase; these results indicated that some PECs in the G0/G1
phase entered the S phase after HG stimulation. However, these cells did not further progress into the G2 or M
phase, indicating that the cell cycle was arrested in these cells (Fig. 2f).
HG exposure induced cellular apoptosis in PECs in vitro. Treatment of PECs with increasing con-
centrations of glucose for 24 h caused dose-dependent decreases in cell viability (Fig. 3a). Hoechst staining
(Fig. 3b) and flow cytometry (Fig. 3c) revealed that treatment with increased concentration of glucose for 24 h
increased apoptosis. Moreover, the live cell analysis system showed concentration-dependent increase in cell
death (Fig. 3d) and apoptosis (Fig. 3e).
Hypertrophy and vacuolization in human PECs in DN. Hypertrophied and vacuolated PECs under
diabetic conditions were further examined using kidney tissue samples from patients with and without diabetes
(Table 1). Quantitative analysis using plastic-embedded semi-thin sections stained with toluidine blue showed
that the cellular volume of PECs was significantly increased in the diabetes group compared with the control
group (p < 0.05) (Fig. 4a–e). With the help of electron microscopy, we examined the morphological changes in
PECs on human renal biopsy specimens of control patients and patients with diabetes. We observed flat cell
Scientific Reports | (2021) 11:1515 | https://doi.org/10.1038/s41598-021-81027-8 2
Vol:.(1234567890)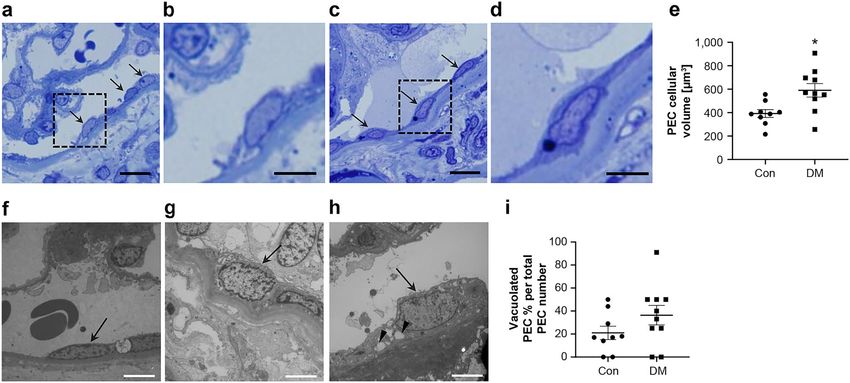
www.nature.com/scientificreports/

Scientific Reports |   (2021) 11:1515 |   https://doi.org/10.1038/s41598-021-81027-8        3

                                                                                       Vol.:(0123456789)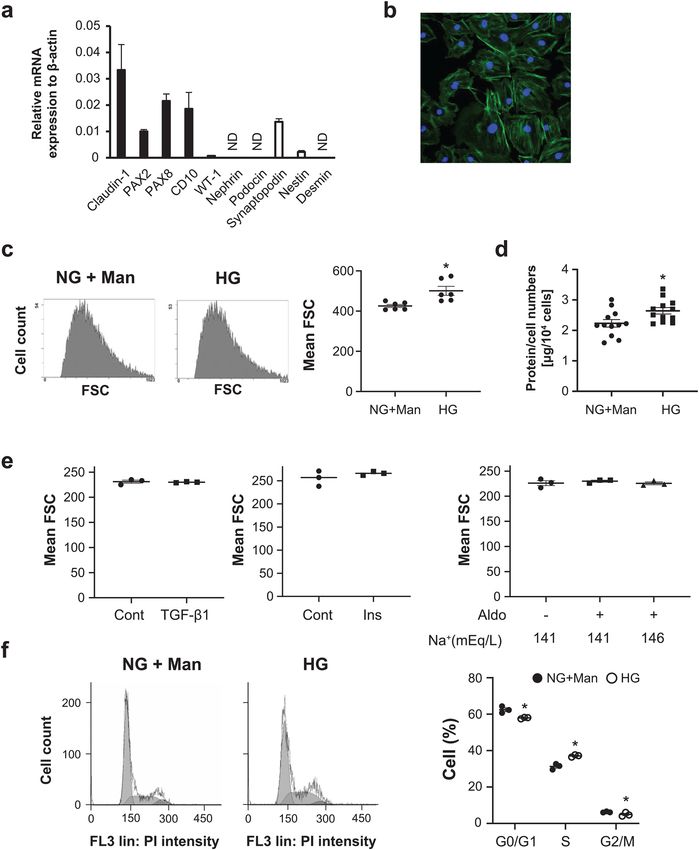
www.nature.com/scientificreports/
Figure 2. The mechanisms for PEC hypertrophy. (a) The relative mRNA expressions of PEC-specific (black
bars) and podocyte-specific (white bars) transcripts in mouse PECs. Quantitative PCR analysis was performed
in three independent experiments per each molecule. Values were normalized to the mRNA expression of
β-actin as the housekeeping gene and were expressed as mean ± SE (n = 3). (b) A representative photograph
of F-actin staining of mouse PECs. (c) Representative flow cytometry images of cultured PECs exposed to
RPMI medium containing 5 mM of glucose (normal glucose, NG) with 25 mM of mannitol (Man) or 30 mM
of glucose (high glucose, HG) for 24 h. The dot plot graph on the right shows the mean FSC (forward scatter)
values. *P < 0.05 vs. NG + Man group (n = 6). (d) The value of the protein/cell number of PECs exposed to
NG + Man or HG. *P < 0.05 vs. NG + Man group (n = 12). (e) Cultured PECs were exposed to RPMI medium
with or without TGF-β1 (10 ng/mL), insulin (Ins, 300 nM) or aldosterone (Aldo, 10−7 M), in the presence of 141
or 146 mEq/L of sodium ion (n = 3). (f) The effects of glucose on the cell cycle in PECs. PECs were exposed to
HG (30 mM) or normal glucose (5 mM) with mannitol (25 mM) culture for 24 h. The percentages of the cells in
the G0/G1, S and G2/M phases were determined by computer analysis. *P < 0.05 vs. NG + Man group (n = 3).
Scientific Reports | (2021) 11:1515 | https://doi.org/10.1038/s41598-021-81027-8 4
Vol:.(1234567890)www.nature.com/scientificreports/
bodies and a little vacuolar changes in the control patients (Fig. 4f), whereas cellular enlargement and vacuolar
changes in the patients with diabetes (Fig. 4g,h). Quantitative analysis showed that the ratio of vacuolated PEC
per total PEC number in DN was high compared with that in control subjects but did not reach significance
(Fig. 4i).
Discussion
In this study, we focused on the morphological alterations in PEC, which is one of the glomerular cells, in DN.
We found hypertrophy of PECs and decrease in cuboidal PECs in diabetic mice. We analyzed the morphological
changes on HG stimulation causing cell cycle arrest and cellular hypertrophy. Moreover, in mouse models with
diabetes, HG stimulation caused PEC injury, which was represented by vacuolization. Although the pathologic
implications remain to be clarified, our study identified several histologic characteristics of PECs in DN and may
provide some information for further investigation on PECs.
In human DN, PEC hypertrophy was described as enlargement of the nuclear diameter and the presence of
euchromatic nuclei on transmission electron microscopy, although the timing of occurrence was not clarified
and the detailed mechanism was not elucidated12. On electron microscopy, PEC hypertrophy was observed
in the early stage in the mice model of DN. PEC hypertrophy was apparent as early as the occurrence of BBM
thickening; this suggested that PEC hypertrophy plays an important role in the hyperproduction of the BBM
by PECs. In renal cells, HG has been reported to induce cellular hypertrophy in podocytes17,18,27–29, mesangial
cells30–32 and renal tubular cells33,34. We tested various stimuli, including HG, insulin, TGF-β1 and aldosterone
and demonstrated that only HG caused hypertrophy of the PECs. The hypertrophic changes in podocytes have
been reported to be involved with the cell cycle35. Consistently, our cell cycle analysis suggested reentry into the
cell cycle and the S phase arrest of hypertrophied PECs.
In the process of searching for the hypertrophied PECs in diabetic mice, we carefully distinguished them
from activated PECs and cuboidal PECs. In activated PECs, various morphological changes were reported,
including cell enlargement, nuclear swelling, structural changes from flat to cuboidal shape, and extracellular
matrix production10,36. CD44 is a marker of activated P EC4,9, and the expression is higher in crescentic glomeru-
lonephritis and in FSGS16,37,38. The relationship between CD44 expression and hypertrophy was suggested in
DN12,39. Indeed, the expression of CD44 on PEC was found in patients with DN, especially in the late phase12.
However, our findings showed hypertrophy of PECs without CD44 expression in the early stage of diabetic
model mice, suggesting that PEC hypertrophy in the early stage of DN was independent of CD44 activation.
The CD 44 expression in human samples with DN in the early stage needs to be further investigated. Cuboidal
PECs have been defined by their shape, localization on the Bowman’s capsule and the presence of brush borders
and abundant mitochondria, similar to the shape of proximal tubular cells. These cells were recently reported
to be more easily activated compared with classical flat PECs in disease c onditions11. We found that the area
lined with cuboidal PECs was decreased in diabetic mice, implying that the hypertrophied PECs may extrude
cuboidal PECs away into the proximal tubular area. Sex hormones40–42, age43,44 and differences in mouse strain40
have been described to affect the distribution of cuboidal PECs, although the factor that reduces the cuboidal
PECs in diabetic mice remain to be clarified.
We demonstrated that HG exposure led to PEC apoptosis in a dose-dependent manner in vitro. PEC apop-
tosis has been reported in high fat feeding m ice45, albumin overload model mice and r ats46, transgenic mouse
model of human immunodeficiency virus-associated nephropathy47 and mice with electrocoagulation of the
renal cortex48 in vivo. Moreover, apoptosis has been reported in cultured PECs exposed to a lbumin46 and IFN-β
exposure49. On transmission electron microscopy, our results did not show any apoptotic PECs, but there was
vacuolization of PECs in early diabetes mice model and in diabetic human subjects. Because vacuolization is one
of the characteristics of cell injury in p odocytes21,22, this result suggested the presence of PEC injury in DN. In
addition, the presence of binuclear PECs in diabetic mice suggested that PECs in DN undergo mitotic catastrophe
instead of apoptosis. Mitotic catastrophe is cell death due to aberrant mitosis, and this implies PEC detachment
from the BBM and death, as previously described in podocytes50–52.
Pathologically, this PEC injury was speculated to reduce glomerular regeneration in DN, because, recently,
the function of PECs as progenitors of podocytes has been n oticed53. PEC injury may also lead to periglomerular
inflammation through cytokine secretion54, which can result in periglomerular fibrosis, as observed previously
in diabetic model m ice55 and human diabetic p atients56.
We acknowledge some limitations in this study. First, the number of human subjects for the assessments of
PEC morphology was small. Further studies including larger populations of patients with DM are necessary. Sec-
ond, our examination on human diabetic sample was performed only at the late stage of DN, which is associated
with profound proteinuria and elevated creatinine. Generally, there are few chances of performing renal biopsy of
patients with early stage of DN. However, hypertrophy and vacuolization of PECs was observed even at late stage
of DN. Further studies on human subjects with only microalbuminuria and early histologic changes are needed.
In conclusion, diabetic condition induced hypertrophy and injury in PECs. Because PECs are considered pro-
genitors of podocytes, this injury to PECs might impair glomerular regeneration or periglomerular inflammation
in a later stage. Further studies are warranted to elucidate the potential pathologic role of these morphological
changes in PECs in DN.
Methods
Animal experiments. Obese-type diabetic db/db mice were used as the DN model. Two congenic strains,
male db/db mice with diabetes (BKS.Cg-Leprdb/Leprdb) and db/m mice without diabetes (BKS.Cg-Leprdb/+),
were obtained from CLEA Japan (Tokyo, Japan). Adriamycin nephropathy was induced in eight week-old male
BALB/c mice (CLEA Japan) by tail vein injection of adriamycin (doxorubicin hydrochloride; Sigma-Aldrich,
Scientific Reports | (2021) 11:1515 | https://doi.org/10.1038/s41598-021-81027-8 5
Vol.:(0123456789)www.nature.com/scientificreports/
Scientific Reports | (2021) 11:1515 | https://doi.org/10.1038/s41598-021-81027-8 6
Vol:.(1234567890)www.nature.com/scientificreports/
◂Figure 3. Cell damage and apoptosis of PECs in vitro. (a) Representative images of cultured PECs (original
magnification × 40) exposed to RPMI medium containing 5 mM of glucose (normal glucose, NG) with 25 mM
of mannitol (Man) or 30 mM of glucose (high glucose, HG) for 24 h. The bar graph shows quantification of
the viability of the cultured PECs exposed to increasing concentrations of glucose. *P < 0.05 vs. NG, #P < 0.05
vs. NG + Man (n = 5–6). (b) Hoechst 33,342 staining of cultured PECs. The arrow shows a cell with condensed
nuclei, which is suggestive of an apoptotic cell. The dot plot graph shows quantification of the apoptotic cultured
PECs exposed to increasing concentrations of glucose. *P < 0.05 vs. NG, #P < 0.05 vs. NG + Man (n = 4–6). (c)
Apoptosis was determined by flow cytometry. Each graph for flow cytometry represents the population of cells
stained with Annexin V (X axis) and PI (Y axis). The dot plot graph shows the percentage of early apoptotic
cells. **P < 0.01 vs. NG + Man (n = 3). (d, e) Cell viability and apoptosis were assessed using an IncuCyte
imaging system. Representative microscopy images of the degree of viability, which was measured as Cytotox
fluorescence (red) (d), and the degree of apoptosis, which was measured as Caspase 3/7 activation (green) (e) at
the 0 and 24 h time points. *P < 0.05 vs. NG, #P < 0.05 vs. NG + Man (n = 8–10). Scale bars: (a,d,e) 100 μm and
(b) 50 μm.
St. Louis, MO, USA) at a dose of 10 mg/kg body weight, as reported previously57. Throughout this study, the
mice were housed in individual cages and were given water ad libitum. The animal room was maintained under
controlled conditions (20 °C, 65% humidity and a 12 h light/12 h dark photoperiod with lights on at 8:00 a.m.).
Urine albumin was determined using an Albuwell M ELISA kit (Exocell, Philadelphia, PA, USA). Urine cre-
atinine was determined using a colorimetric microplate assay (BioAssay Systems, Hayward, CA, USA). At 12,
24 and 36 weeks of age, the mice were anesthetized by pentobarbital injection (50 mg/kg) and exsanguinated
through a cervical artery incision under anesthesia. All procedures were conducted in accordance with relevant
guidelines and regulations approved by the Keio University Animal Care and Use Committees. Every effort was
made to minimize suffering of the mice.
Assessment of cultured PECs hypertrophy. A conditionally immortalized mouse PEC line26, which
was kindly provided by Professor Stuart Shankland (University of Washington, Seattle, WA, USA), was used for
the cell culture studies. Differentiated PECs were stimulated with normal glucose (5 mM); normal glucose with
mannitol (25 mM); HG (30 mM); 10 ng/mL of recombinant human TGF-β1 (R&D Systems, Minneapolis, MN);
300 nM of insulin (Sigma-Aldrich) or 1 0−7 M of aldosterone (Sigma-Aldrich) for 24 h. A medium with high salt
content (146 mEq/L of sodium chloride; Wako, Osaka, Japan) was made, as previously r eported25. Hypertro-
phy of the cultured PECs was assessed by measuring the cellular protein/cell counts and by flow cytometry, as
described previously29. To directly determine the cell size, the cells were stained with propidium iodide (PI) and
analyzed by forward light scattering using a flow cytometer (Gallios; Beckman Coulter, Brea, CA). We counted
5,000–15,000 cells per each experiment. Data were analyzed with Kaluza software (Beckman Coulter).
Cell cycle analysis. The cell cycle status was analyzed by PI staining and flow cytometry, as previously
described58. Briefly, 1 06 cells were washed twice with PBS. The adherent cells were collected and fixed in ethanol
overnight at 4 °C and then incubated with a mixture of PI (50 mg/mL, Sigma-Aldrich) and RNase A (25 mg/mL,
Sigma-Aldrich) at 37 °C for 30 min. The level of PI fluorescence was measured with a Gallios flow cytometer,
and the proportion of cells in the G0/G1, S and G 2/M phases was measured by computer analysis. We counted
5,000–15,000 cells per each experiment.
Apoptosis assessment. Apoptosis was measured by Hoechst 33,342 staining (Invitrogen, Thermo Fisher
Scientific, Waltham, MA) and by careful morphological analysis, as previously reported17. The Annexin V FITC
Apoptosis Detection Kit (BD Biosciences, Franklin Lakes, NJ, USA) was also used to detect apoptosis by Gal-
lios flow cytometer. About 106 cells were washed twice with PBS. The adherent cells were detached with 0.05%
trypsin–EDTA after about 1 min. Annexin V FITC, in combination with PI, was used for quantitative determi-
nation of the percentage of cells undergoing apoptosis, with the aid of Kaluza software. We counted 3,000–20,000
cells. Apoptosis was also analyzed by the IncuCyte Live Cell Imaging system (Essen BioScience, Ann Arbor,
MI, USA). Caspase-3/7 green stain (1:1000 dilution, Essen Biosciences) and Cytotox red stain (1:4000 dilution,
Essen Biosciences) were used according to the manufacturer’s instructions to label apoptotic and dead cells,
respectively.
Immunofluorescence staining of F‑actin in cultured PECs. Cells were fixed with 4% paraformalde-
hyde for 15 min at 37 °C and were permeabilized with 0.3% Triton X-100 (Sigma-Aldrich) for 5 min at room
temperature. Nonspecific binding was quenched with a blocking solution (10% normal goat serum) for 30 min at
room temperature. For F-actin detection, cells were incubated with Alexa Flour 488 phalloidin (Invitrogen) after
permeabilization. The sections were examined under a confocal fluorescence microscope (Carl Zeiss LSM-710;
Carl Zeiss, Jena, Germany).
RNA isolation, reverse transcription and quantitative polymerase chain reaction. The total
RNA from the cultured cells was extracted using the RNeasy Plus Mini Kit (QIAGEN, Hilden, Germany). Real-
time reverse transcriptase polymerase chain reaction (RT-PCR) was performed using a sequence detector (ABI
Step One Plus; Applied Biosystems, Thermo Fisher Scientific, Waltham, MA) and the SYBR GREEN System
Scientific Reports | (2021) 11:1515 | https://doi.org/10.1038/s41598-021-81027-8 7
Vol.:(0123456789)www.nature.com/scientificreports/
Vacuolated
Serum creatinine eGFR (mL/ Proteinuria [g/ PEC volume PEC% per total
Sample name Sex Age [years] [mg/dL] min/1.73 m2) day] HbA1c [%] RPS DN Class [µm3] PEC number
Controls
CO-1 Male 22 0.94 85 0.17 4.9 504 18
CO-2 Male 20 0.80 98 0.23 5.1 404 14
CO-3 Male 51 0.83 77 0.12 5.7 308 0
CO-4 Female 39 0.65 80 0.09 5.2 215 44
CO-5 Female 39 0.72 74 0.46 5.0 388 0
CO-6 Female 30 0.63 90 0.06 5.4 406 29
CO-7 Female 65 0.75 59 0.06 5.8 361 17
CO-8 Male 55 1.16 52 0.32 6.2 555 50
Diabetes mellitus
DM-1 Male 51 2.60 22 5.00 5.9 2 750 50
DM-2 Female 57 0.50 96 0.40 8.9 2 518 40
DM-3 Female 41 1.27 38 8.72 6.0 3 571 0
DM-4 Male 67 1.36 41 0.44 5.7 2 256 50
DM-5 Male 44 1.09 60 1.24 7.7 2 908 91
DM-6 Female 41 1.53 32 5.13 6.5 3 563 0
DM-7 Male 66 0.90 65 3.03 7.1 2 679 25
Table 1. Clinical and pathological data of controls and patients with diabetes mellitus. CO control, DM
diabetes mellitus, RPS DN class scores as defined by the Renal Pathology Society Diabetic Nephropathy
Classification.
Figure 4. Morphological findings of PECs in diabetic human subjects. (a–d) PECs in human renal biopsy
specimens from control patients (Con) (a,b) and patients with diabetes mellitus (DM) (c,d) (plastic-embedded
semi-thin section stained with toluidine blue). Arrows indicate PECs. (b,d) The magnified view of the boxed
region in (a) and (c), respectively. (e) Quantification of PECs’ cellular volume in Con and patients with DM.
(f–h) Transmission electron microscopic evaluation of the PECs in Con without diabetes (f) and patients with
DM (g,h). (f) An example of a PEC (arrow) is shown to have a flat cell body and a flat nucleus on the BBM in
a nondiabetic subject. (g,h) The PECs in patients with DM were enlarged (arrow) and exhibited cytoplasmic
vacuolization (arrowhead). Each figure was obtained from corresponding patients in Table 1, (e) CO-7, (f)
DM-1, (g) DM-5. (i) Quantification of the ratio of vacuolated PEC number per total PEC number in Con and in
patients with DM. Scale Bars: (a,c) 10 µm, (b,d,f–h) 5 µm.
Scientific Reports | (2021) 11:1515 | https://doi.org/10.1038/s41598-021-81027-8 8
Vol:.(1234567890)www.nature.com/scientificreports/
Genes Forward primer Reverse primer
Claudin 1 AGCTGTGCATGGCCTCTTGTT AGGGCCTTTCCTATGGATGAGAGT
PAX-2 AGCTACATGCCCACTAAAGCACAG CACGGGACCATGTTCGTCA
PAX-8 TGCTATCGCAGGCATGGTG ACTACAGATGGTCAAAGGCTGTGG
CD10 TTATGTCCTGTCATAGCAGCCAAAG CAGCAGGAATCTAGGCACCAGAG
WT-1 TGAAGACCCACACCAGGACTC TGTGATGGCGGACCAATTC
Nephrin GTGATGACGTCACAGAAGCAAGAA TTTGTGTGGCATACACTGTCAGG
Podocin TATGGGCCCAAACATCTACACAA CAGAGGCAGCCAGTCAGTCA
Synaptopodin GCTCGAATTCCGATGCAAATAAAC CAGGCCAC AGTGAGATGTGAAGA
Nestin GAGGTGTCAAGGTCCAGGATGTC ACACCGTCTCTAGGGCAGTTACAA
Desmin TCATGCTCAGC GAGATTGAACAG TTACCCGATGCCCAGGTGATA
Β actin CATCCGTAAAGACCTCTATGCCAAC ATGGAGCCACCGATCCACA
Table 2. List of primer sequences used for the RT-PCR analysis in this study.
(Applied Biosystems)59. The relative mRNA level for each gene was normalized to the mRNA express level of
β-actin. The primer sequences for the forward and reverse primers are listed in Table 2.
Immunohistochemical analysis. Immunohistochemistry was performed, as previously described59.
Briefly, paraffin-embedded kidney pieces were stained using rat monoclonal antibody against CD44 (1:500; BD
bioscience, San Diego, California; catalog number 550538). Before incubation, the tissue sections underwent
antigen retrieval in 0.01 mol/l of sodium citrate buffer (pH 6.0) at 120 °C for 20 min. Then, the sections were
incubated with biotin-labeled goat anti-rat IgG (1:200; Vector Laboratories, Burlingame, CA) antibody then
treated with the Vectastain Elite ABC Kit (Vector Laboratories). Sections were examined using a biological
microscope (Olympus BX53; Olympus Corporation, Tokyo, Japan). Quantitative computer-assisted image anal-
ysis was performed by a blinded observer using the Image-Pro Plus software (version 5.1; Media Cybernetics,
Bethesda, MD), which is an image analysis software program.
Immunofluorescence staining. Immunofluorescence staining for PAX8 was performed on paraffin-
embedded sections using rabbit polyclonal anti-PAX8 antibody (1:100; Proteintech Group, Rosemont, IL; cat-
alog number 10336–1-AP). Alexa Fluor 594 donkey anti-rabbit IgG (Invitrogen) was used as the secondary
antibody. Immunofluorescence staining for Fluorescein-labeled LTA (Vector Laboratories) was performed in
a similar manner. The slides were premounted with VECTASHIELD mounting medium with DAPI (Vector
Laboratories) and kept in darkness to dry. For fluorescence microscopy, all sections were stained and analyzed
simultaneously to exclude artifacts due to variable decay of the fluorochrome. The sections were examined using
a confocal fluorescence microscope (Carl Zeiss LSM-710) at a magnification of 400 × .
Identification of flat PECs and cuboidal PECs. PECs comprise mainly of flat and cuboidal PECs. We
discriminated between flat and cuboidal PECs using PAX8 which stain flat PECs and cuboidal PECs in Bow-
man’s capsule)60, and LTA which only stain cuboidal PECs in Bowman’s capsule11. Flat PECs were identified as
PAX8 positive LTA negative cells internally lining the Bowman’s capsule. We measured flat PEC nuclear volume
as a substitute for flat PEC cellular volume, because the ratio between nuclear and cytoplasmic size has long been
observed to be maintained at a constant value61. The flat PECs’ nuclear area was measured as PAX8 positive area
per cell, and then the nuclear volume was calculated as described in morphological analysis. Cuboidal PECs
were identified as LTA positive cells in the Bowman’s capsule for immunofluorescent s taining11. For morpho-
metric analysis of cuboidal PECs, each glomerulus within the kidney section was ranked on a scale of zero to
five, depending on the degree of cuboidal PECs. Each rank was represented as follows: 0 = no cuboidal PECs;
1 = cuboidal PECs up to one-fourth of the glomerular circumference; 2 = cuboidal PECs < 50% of the glomerular
circumference; 3 = cuboidal PECs < 75% of the glomerular circumference; 4 = cuboidal PECs < 100% of the glo-
merular circumference and 5 = entirely cuboidal PECs without the classical flat PECs. A ge46,47, gender43–45 and
43
genetic background affect the distribution of cuboidal PECs and flat PECs; therefore, we matched age, gender,
and genetic background to compare cuboidal PECs other than compared conditions. We compared cuboidal
PEC score of male db/m mice with that of male db/db mice. The background of mice is shown in Supplementary
Table S1. Thirty glomeruli were obtained for each sample, and the total mean score was calculated.
Electron microscopy. The kidney tissues were fixed on 2% glutaraldehyde and embedded in epoxy resin.
The semi-thin sections stained with toluidine blue were inspected under the light microscope. The ultrathin
sections, stained with uranyl acetate and lead citrate, were investigated and snapped using an electron micro-
scope. To evaluate PEC morphometry, electron micrographs of at least five glomeruli per kidney were randomly
obtained from each mouse and observed at a magnification of 2000 × . To evaluate GBM thickness and BBM
thickness, a mean of 30 measurements were taken per kidney at random sites where the GBM and BBM were
displayed in best cross-section as previously described62.
Scientific Reports | (2021) 11:1515 | https://doi.org/10.1038/s41598-021-81027-8 9
Vol.:(0123456789)www.nature.com/scientificreports/
Human renal biopsy specimens. We obtained renal needle biopsy specimens from 15 patients. We ret-
rospectively identified eight control cases without diabetes and seven cases with diabetes. Control cases were
obtained from patients without glomerular abnormalities in light microscopy. Before study enrollment, written
informed consent was obtained from all patients. The study was performed in accordance with the Declaration
of Helsinki, and the study protocol was approved by the human ethics review committee of the Department of
Internal Medicine, School of Medicine, Keio University. Patients for whom fewer than nine PECs were observed
on biopsy were excluded. PECs with sclerotic glomeruli were excluded. All visible PECs from each human sam-
ple were assessed by morphology. All the biopsies were categorized based on the pathologic classification of
the Renal Pathology Society (RPS) Diabetic Nephropathy C lassification3. PEC area was measured in plastic-
embedded semi-thin sections stained with toluidine blue using light microscopy at a magnification of 1000 × .
The area measurement was performed using Image-Pro Plus software. The volume was calculated as described in
morphological analysis below. Vacuolated PECs were counted and assessed by the ratio to the total PEC number
using electron microscopy. The patient clinical data at the time of renal biopsy and the pathological data are
summarized in Table 1.
Morphological analysis. Podocyte volume has been estimated using various methods63–66. However, to
the best of our knowledge, a method to quantitatively estimate PEC volume and PEC nuclear volume has not
been reported to date. Therefore, we substituted the measurement methods of podocytes for those of PECs.
First, for counting the PEC number, we used the Weibel and Gomez method. Briefly, the PEC number was
calculated from the cell density per volume (Ncv) and the volume density of PECs (Vcv) according to the equa-
tion: Ncv = k/β × NcA1.5/Vcv0.5 with β = 1.5 and k = 1. The average volumes of individual PEC and PEC nuclei were
calculated with Vc = Vcv × Vglom66.
Statistical analysis. Data are expressed as the mean ± standard error of mean and were analyzed by one-
way analysis of variance, followed by the Bonferroni post hoc test. The criterion for statistical significance was
a P value < 0.05.
Received: 22 December 2019; Accepted: 9 December 2020
References
1. Reutens, A. T. & Atkins, R. C. Epidemiology of diabetic nephropathy. Contrib. Nephrol. 170, 1–7 (2011).
2. Jefferson, J. A., Shankland, S. J. & Pichler, R. H. Proteinuria in diabetic kidney disease: A mechanistic viewpoint. Kidney Int. 74,
22–36 (2008).
3. Tervaert, T. W. et al. Pathologic classification of diabetic nephropathy. J. Am. Soc. Nephrol. 21, 556–563 (2010).
4. Shankland, S. J., Smeets, B., Pippin, J. W. & Moeller, M. J. The emergence of the glomerular parietal epithelial cell. Nat Rev Nephrol.
10, 158–173 (2014).
5. Kaverina, N. V. et al. Dual lineage tracing shows that glomerular parietal epithelial cells can transdifferentiate toward the adult
podocyte fate. Kidney Int. 96, 597–611 (2019).
6. Eng, D. G. et al. Glomerular parietal epithelial cells contribute to adult podocyte regeneration in experimental focal segmental
glomerulosclerosis. Kidney Int. 88, 999–1012 (2015).
7. Ohse, T. et al. A new function for parietal epithelial cells: A second glomerular barrier. Am. J. Physiol. Renal Physiol. 297, F1566-
1574 (2009).
8. Eymael, J. et al. CD44 is required for the pathogenesis of experimental crescentic glomerulonephritis and collapsing focal segmental
glomerulosclerosis. Kidney Int. 93, 626–642 (2018).
9. Smeets, B. et al. Tracing the origin of glomerular extracapillary lesions from parietal epithelial cells. J. Am. Soc. Nephrol. 20,
2604–2615 (2009).
10. Smeets, B. et al. Parietal epithelial cells participate in the formation of sclerotic lesions in focal segmental glomerulosclerosis. J.
Am. Soc. Nephrol. 22, 1262–1274 (2011).
11. Kuppe, C. et al. Novel parietal epithelial cell subpopulations contribute to focal segmental glomerulosclerosis and glomerular tip
lesions. Kidney Int. 96, 80–93 (2019).
12. Holderied, A. et al. Glomerular parietal epithelial cell activation induces collagen secretion and thickening of Bowman’s capsule
in diabetes. Lab. Invest. 95, 273–282 (2015).
13. Stout, L. C., Kumar, S. & Whorton, E. B. Insudative lesions—their pathogenesis and association with glomerular obsolescence in
diabetes: A dynamic hypothesis based on single views of advancing human diabetic nephropathy. Hum. Pathol. 25, 1213–1227
(1994).
14. Andeen, N. K. et al. The phenotypes of podocytes and parietal epithelial cells may overlap in diabetic nephropathy. Kidney Int. 88,
1099–1107 (2015).
15. Gaut, J. P., Hoshi, M., Jain, S. & Liapis, H. Claudin 1 and nephrin label cellular crescents in diabetic glomerulosclerosis. Hum.
Pathol. 45, 628–635 (2014).
16. Okamoto, T. et al. Prevalence of CD44-positive glomerular parietal epithelial cells reflects podocyte injury in adriamycin nephropa-
thy. Nephron Exp Nephrol. 124, 11–18 (2013).
17. Lee, S. H. et al. Podocyte hypertrophy precedes apoptosis under experimental diabetic conditions. Apoptosis 20, 1056–1071 (2015).
18. Kim, D. K. et al. Translationally controlled tumor protein is associated with podocyte hypertrophy in a mouse model of type 1
diabetes. Diabetologia 55, 1205–1217 (2012).
19. Advani, A. et al. Inhibition of the epidermal growth factor receptor preserves podocytes and attenuates albuminuria in experimental
diabetic nephropathy. Nephrology (Carlton). 16, 573–581 (2011).
20. Hara, Y. et al. Rho and Rho-kinase activity in adipocytes contributes to a vicious cycle in obesity that may involve mechanical
stretch. Sci Signal. 4, ra3 (2011).
21. Ueda, S. et al. ENOS deficiency causes podocyte injury with mitochondrial abnormality. Free Radic. Biol. Med. 87, 181–192 (2015).
22. Catanuto, P. et al. In vivo 17beta-estradiol treatment contributes to podocyte actin stabilization in female db/db mice. Endocrinol-
ogy 153, 5888–5895 (2012).
Scientific Reports | (2021) 11:1515 | https://doi.org/10.1038/s41598-021-81027-8 10
Vol:.(1234567890)www.nature.com/scientificreports/
23. Ohse, T. et al. Establishment of conditionally immortalized mouse glomerular parietal epithelial cells in culture. J. Am. Soc. Nephrol.
19, 1879–1890 (2008).
24. Monkawa, T., Hiromura, K., Wolf, G. & Shankland, S. J. The hypertrophic effect of transforming growth factor-beta is reduced in
the absence of cyclin-dependent kinase-inhibitors p21 and p27. J. Am. Soc. Nephrol. 13, 1172–1178 (2002).
25. Yamamuro, M. et al. Direct effects of aldosterone on cardiomyocytes in the presence of normal and elevated extracellular sodium.
Endocrinology 147, 1314–1321 (2006).
26. Shankland, S. J. & Wolf, G. Cell cycle regulatory proteins in renal disease: Role in hypertrophy, proliferation, and apoptosis. Am.
J. Physiol. Renal Physiol. 278, F515-529 (2000).
27. Lv, W. et al. Mycophenolate mofetil inhibits hypertrophy and apoptosis of podocyte in vivo and in vitro. Int. J. Clin. Exp. Med. 8,
19781–19790 (2015).
28. Romero, M., Ortega, A., Izquierdo, A., Lopez-Luna, P. & Bosch, R. J. Parathyroid hormone-related protein induces hypertrophy
in podocytes via TGF-beta(1) and p27(Kip1): Implications for diabetic nephropathy. Nephrol. Dial. Transplant. 25, 2447–2457
(2010).
29. Xu, Z. G. et al. Angiotensin II receptor blocker inhibits p27Kip1 expression in glucose-stimulated podocytes and in diabetic
glomeruli. Kidney Int. 67, 944–952 (2005).
30. Zhuo, L. et al. NAD blocks high glucose induced mesangial hypertrophy via activation of the sirtuins-AMPK-mTOR pathway.
Cell. Physiol. Biochem. 27, 681–690 (2011).
31. Abdel-Wahab, N., Weston, B. S., Roberts, T. & Mason, R. M. Connective tissue growth factor and regulation of the mesangial cell
cycle: Role in cellular hypertrophy. J. Am. Soc. Nephrol. 13, 2437–2445 (2002).
32. Wolf, G., Schroeder, R., Zahner, G., Stahl, R. A. K. & Shankland, S. J. High glucose-induced hypertrophy of mesangial cells requires
p27Kip1, an inhibitor of cyclin-dependent kinases. Am. J. Pathol. 158, 1091–1100 (2001).
33. Sun, L., Kondeti, V. K., Xie, P., Raparia, K. & Kanwar, Y. S. Epac1-mediated, high glucose-induced renal proximal tubular cells
hypertrophy via the Akt/p21 pathway. Am. J. Pathol. 179, 1706–1718 (2011).
34. Huang, J. S., Chuang, L. Y., Guh, J. Y., Huang, Y. J. & Hsu, M. S. Antioxidants attenuate high glucose-induced hypertrophic growth
in renal tubular epithelial cells. Am. J. Physiol. Renal Physiol. 293, F1072-1082 (2007).
35. Li, J. J. et al. Podocyte biology in diabetic nephropathy. Kidney Int. Suppl. 72, S36-42 (2007).
36. Smeets, B. et al. The parietal epithelial cell: A key player in the pathogenesis of focal segmental glomerulosclerosis in Thy-1.1
transgenic mice. J. Am. Soc. Nephrol. 15, 928–939 (2004).
37. Fatima, H. et al. Parietal epithelial cell activation marker in early recurrence of FSGS in the transplant. Clin. J. Am. Soc. Nephrol.
7, 1852–1858 (2012).
38. Nakamura, H., Kitazawa, K., Honda, H. & Sugisaki, T. Roles of and correlation between alpha-smooth muscle actin, CD44, hya-
luronic acid and osteopontin in crescent formation in human glomerulonephritis. Clin. Nephrol. 64, 401–411 (2005).
39. Zhao, X. et al. Albumin induces CD44 expression in glomerular parietal epithelial cells by activating extracellular signal-regulated
kinase 1/2 pathway. J. Cell. Physiol. 234, 7224–7235 (2019).
40. Yabuki, A., Suzuki, S., Matsumoto, M. & Nishinakagawa, H. Morphometrical analysis of sex and strain differences in the mouse
nephron. J. Vet. Med. Sci. 61, 891–896 (1999).
41. Carpino, F., Barberini, F., Familiari, G. & Melis, M. Columnar cells of the parietal layer of Bowman’s capsule and their relationship
with the sexual cycle in normal female mice. Experientia 32, 1584–1585 (1976).
42. Crabtree, C. Sex differences in the structure of Bowman’s capsule in the mouse. Science 91, 299 (1940).
43. Tabatabai, N. M. et al. De novo expression of sodium-glucose cotransporter SGLT2 in Bowman’s capsule coincides with replace-
ment of parietal epithelial cell layer with proximal tubule-like epithelium. J. Membr. Biol. 247, 675–683 (2014).
44. Haley, D. P. & Bulger, R. E. The aging male rat: Structure and function of the kidney. Am. J. Anat. 167, 1–13 (1983).
45. Szeto, H. H. et al. Protection of mitochondria prevents high-fat diet-induced glomerulopathy and proximal tubular injury. Kidney
Int. 90, 997–1011 (2016).
46. Chang, A. M. et al. Albumin-induced apoptosis of glomerular parietal epithelial cells is modulated by extracellular signal-regulated
kinase 1/2. Nephrol. Dial. Transplant. 27, 1330–1343 (2012).
47. Barisoni, L., Bruggeman, L. A., Mundel, P., D’Agati, V. D. & Klotman, P. E. HIV-1 induces renal epithelial dedifferentiation in a
transgenic model of HIV-associated nephropathy. Kidney Int. 58, 173–181 (2000).
48. Schulte, K. et al. Origin of parietal podocytes in atubular glomeruli mapped by lineage tracing. J. Am. Soc. Nephrol. 25, 129–141
(2014).
49. Migliorini, A. et al. The antiviral cytokines IFN-alpha and IFN-beta modulate parietal epithelial cells and promote podocyte loss:
Implications for IFN toxicity, viral glomerulonephritis, and glomerular regeneration. Am. J. Pathol. 183, 431–440 (2013).
50. Liapis, H., Romagnani, P. & Anders, H. J. New insights into the pathology of podocyte loss: Mitotic catastrophe. Am. J. Pathol.
183, 1364–1374 (2013).
51. Tang, H. et al. MDM2 is implicated in high-glucose-induced podocyte mitotic catastrophe via Notch1 signaling. J. Cell. Mol. Med.
21, 3435–3444 (2017).
52. Hara, M., Oohara, K., Dai, D. F. & Liapis, H. Mitotic catastrophe causes podocyte loss in the urine of human diabetics. Am. J.
Pathol. 189, 248–257 (2019).
53. Appel, D. et al. Recruitment of podocytes from glomerular parietal epithelial cells. J. Am. Soc. Nephrol. 20, 333–343 (2009).
54. Medzhitov, R. Inflammation 2010: New adventures of an old flame. Cell 140, 771–776 (2010).
55. Takashima, S. et al. Stromal cell-derived factor-1 is upregulated by dipeptidyl peptidase-4 inhibition and has protective roles in
progressive diabetic nephropathy. Kidney Int. 90, 783–796 (2016).
56. Jenkins, J., Brodsky, S. V., Satoskar, A. A., Nadasdy, G. & Nadasdy, T. The relevance of periglomerular fibrosis in the evaluation of
routine needle core renal biopsies. Arch. Pathol. Lab. Med. 135, 117–122 (2011).
57. Wang, Y., Wang, Y. P., Tay, Y. C. & Harris, D. C. Progressive adriamycin nephropathy in mice: Sequence of histologic and immu-
nohistochemical events. Kidney Int. 58, 1797–1804 (2000).
58. Yang, Y. L. et al. Interaction between high glucose and TGF-beta in cell cycle protein regulations in MDCK cells. J. Am. Soc. Nephrol.
9, 182–193 (1998).
59. Hasegawa, K. et al. Renal tubular Sirt1 attenuates diabetic albuminuria by epigenetically suppressing Claudin-1 overexpression in
podocytes. Nat. Med. 19, 1496–1504 (2013).
60. Sweetwyne, M. T. et al. The mitochondrial-targeted peptide, SS-31, improves glomerular architecture in mice of advanced age.
Kidney Int. 91, 1126–1145 (2017).
61. Chan, Y. H. & Marshall, W. F. Scaling properties of cell and organelle size. Organogenesis 6, 88–96 (2010).
62. Reiniger, N. et al. Deletion of the receptor for advanced glycation end products reduces glomerulosclerosis and preserves renal
function in the diabetic OVE26 mouse. Diabetes 59, 2043–2054 (2010).
63. Fukuda, A. et al. Angiotensin II-dependent persistent podocyte loss from destabilized glomeruli causes progression of end stage
kidney disease. Kidney Int. 81, 40–55 (2012).
64. Herbach, N. et al. Diabetic kidney lesions of GIPRdn transgenic mice: Podocyte hypertrophy and thickening of the GBM precede
glomerular hypertrophy and glomerulosclerosis. Am. J. Physiol. Renal Physiol. 296, F819-829 (2009).
65. Pagtalunan, M. E. et al. Podocyte loss and progressive glomerular injury in type II diabetes. J. Clin. Invest. 99, 342–348 (1997).
Scientific Reports | (2021) 11:1515 | https://doi.org/10.1038/s41598-021-81027-8 11
Vol.:(0123456789)www.nature.com/scientificreports/
66. Gross, M.-L. et al. ACE-inhibitors but not endothelin receptor blockers prevent podocyte loss in early diabetic nephropathy.
Diabetologia 46, 856–868 (2003).
Acknowledgements
The authors wish to thank Professor Stuart Shankland (University of Washington, Seattle, WA, USA) for pro-
viding cultured PECs. We are also grateful to the Fourth Laboratory of the Department of Pathology in Keio
University School of Medicine for assistance with electron microscopy analysis.
Author contributions
T.K. performed the experiments and drafted the manuscript. K.H., S.W. and H.I. designed the research, analyzed
data, and drafted the manuscript. A.H. worked on the evaluation of pathologic findings. I.Y., H.M., H.U. and
H.T. worked on the general coordination of the study.
Competing interests
The authors declare no competing interests.
Additional information
Supplementary Information The online version contains supplementary material available at https://doi.
org/10.1038/s41598-021-81027-8.
Correspondence and requests for materials should be addressed to S.W.
Reprints and permissions information is available at www.nature.com/reprints.
Publisher’s note Springer Nature remains neutral with regard to jurisdictional claims in published maps and
institutional affiliations.
Open Access This article is licensed under a Creative Commons Attribution 4.0 International
License, which permits use, sharing, adaptation, distribution and reproduction in any medium or
format, as long as you give appropriate credit to the original author(s) and the source, provide a link to the
Creative Commons licence, and indicate if changes were made. The images or other third party material in this
article are included in the article’s Creative Commons licence, unless indicated otherwise in a credit line to the
material. If material is not included in the article’s Creative Commons licence and your intended use is not
permitted by statutory regulation or exceeds the permitted use, you will need to obtain permission directly from
the copyright holder. To view a copy of this licence, visit http://creativecommons.org/licenses/by/4.0/.
© The Author(s) 2021
Scientific Reports | (2021) 11:1515 | https://doi.org/10.1038/s41598-021-81027-8 12
Vol:.(1234567890)You can also read