Nanoparticles in enhancing microwave imaging and microwave Hyperthermia effect for liver cancer treatment - De Gruyter
←
→
Page content transcription
If your browser does not render page correctly, please read the page content below
Rev. Adv. Mater. Sci. 2021; 60:223–236

Research Article

Walaa Maamoun*, Mohamed I. Badawi, Ayman A Aly, and Y. Khedr

Nanoparticles in enhancing microwave imaging
and microwave Hyperthermia effect for liver cancer
treatment
https://doi.org/10.1515/rams-2021-0014
Received Oct 30, 2019; accepted May 18, 2020
                                                                    1 Introduction
Abstract: Hyperthermia therapy is a promising therapy for           In 2019, an expected 42,030 adults (29,480 men and 12,550
liver cancer treatment that utilizes external electromagnetic       women) in the United States will be diagnosed with pri-
waves to heat the tumor zone to preferentially kill or min-         mary liver cancer. Since 1980, the percentage of liver cancer
imize cancer cells. Nevertheless, it’s a challenge to real-         has tripled. Between 2006 and 2015, the number of cases
ize localized heating of the cancer tissue without harming          diagnosed with the disease increased by around 3% an-
the surrounding healthy tissue. This research proposes to           nually. Men are about 3 times more likely than women to
utilize nanoparticles as microwave absorbers to enhance             be diagnosed with the liver cancer [1]. Severe patients that
microwave imaging and achieve localized hyperthermia                cannot undergo surgical resection are eligible for hyper-
therapy.                                                            thermia which is a new therapeutic method that consists in
A realistic 3D abdomen model has been segmented using               heating the tumor cells in order to make selective damage.
3D Slicer segmentation software, and then the obtained seg-         Final temperatures can range between 42∘ C to 45∘ C (mild
mented CAD model exported to Computer Simulation Tech-              hyperthermia) [2].
nology (CST STUDIO) for applying the Finite Element Mod-                 Currently, two frequencies – 915 and 2.4 GHz – are uti-
eling (FEM). Next investigating both imaging and treatment          lized in microwave hyperthermia; the frequency of 2.4 GHz
capability. Finally, the specific absorption rate (SAR) and         is commonly applied in the clinic. Compared with 2.4 GHz
temperature distribution were computed without nanopar-             microwaves, 915 MHz microwaves have a larger penetra-
ticles and with different types of nanoparticles such as gold       tion depth. Besides, the energy attenuation of 915 MHz
(GNPs) and silver nanoparticles at frequency 915 MHz.               microwaves is less than that of 2.4 GHz microwaves and
By comparing the achived results, it was seen that Silver           more electromagnetic energy may convert into heat energy.
nanoparticles can make a great enhancement in raising               Therefore, 915 MHz microwaves can provide a larger hyper-
the temperature. However, this result was unsatisfactory            thermia zone [3, 4].
but, after adding gold nanoparticles the temperature ex-                 Nevertheless, achieving localized hyperthermia of the
ceed 42∘ C, at frequency 915 MHz which is achieving the hy-         cancer cells without harming the nearby healthy tissue still
perthermia treatment without harming the nearby healthy             challenges [5]. This study proposes to utilize nanoparticles
tissue, GNPs also can achieve a great enhancement in SAR            as microwave absorbers to realize localized heating under
result                                                              microwave radiation which has been investigated for pre-
                                                                    vention, treatment, and early diagnosis of cancer, since
Keywords: liver cancer, microwave imaging, hyperthermia
                                                                    nanoparticles can accumulate around or inside malignant
                                                                    regions, to aid localized heating only affecting tumors. Ap-
                                                                    proaches to nanoparticle-mediated hyperthermia include
                                                                    plasmonic photothermal therapy (PPTT), magnetically in-
                                                                    duced heating [6], and microwave irradiation. For PPTT
                                                                    methods, gold nanoparticles can possess greatly enhanced
*Corresponding Author: Walaa Maamoun: Department of
                                                                    visible and near-infrared light absorption due to the phe-
physics, Faculty of science Damanhur University, Egypt; Email:
                                                                    nomenon of surface Plasmon resonance. Unfortunately,
walaamagdy3010@gmail.com; Tel.: 02-01023467900
Mohamed I. Badawi: Department of Medical Equipment, Faculty of      the penetration depth of near-infrared light in the human
Allied medical science, Pharos University in Alexandria, Egypt      body is only a few millimeters due to notable scattering
Ayman A Aly, Y. Khedr: Department of physics, Faculty of science    and attenuation of light by biological tissues. Furthermore,
Damanhur University, Egypt

  Open Access. © 2021 W. Maamoun et al., published by De Gruyter.            This work is licensed under the Creative Commons Attribution
4.0 License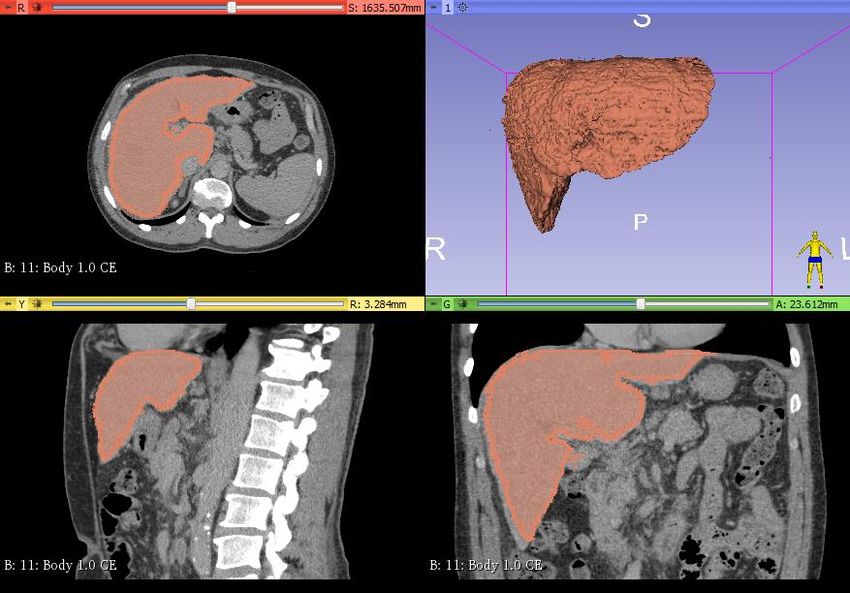
224 | W. Maamoun et al.

the toxicity of a surfactant utilized in gold nanoparticle
synthesis can degrade membranes and peptides.
                                                                2 Physical phenomena during
     Magnetically induced heating takes advantage of mag-         microwave tissue hyperthermia
netic nanoparticles excited by the external electromagnetic
(EM) field with a much longer wavelength, which can pen-        2.1 Microwave Absorption in Tissue
etrate deeper through the human body [7]. Under the EM
field, magnetic nanoparticles can perform magnetic hys-         The complex geometries and tissue properties involved
teresis [8], Néel or Brown relaxation, and magnetic reso-       in simulation of microwave hyperthermia therapy, espe-
nance, coupling the external EM field power into nanoparti-     cially perfusion term, makes computer simulations an ideal
cles to generate heat [9]. However, the absorption efficiency   choice over analytical solutions which require many sim-
of these magnetic nanoparticles highly depends on their         plifying assumptions. The present work is based on EM
size and morphology, which are difficult to manage due          numerical analysis approach of FEM, because FEM uses
to their complex chemical synthesis processes: the intrin-      piecewise approximation to solve the governing bioheat
sic complex synthesis limits their optimal structures. Fur-     transfer equation. Geometric irregularities and regional
thermore, besides the problem of particle aggregation, bio-     heterogeneity are more easily handled by FEM.
compatibility remains another notable hurdle for magnetic            The ultimate goal of computer models for microwave
nanoparticle hyperthermia. The third type of nanoparticle-      tissue hyperthermia is to induce tissue damage, which is
based hyperthermia therapy, called microwave irradiation,       a function of the time-temperature, and for this temper-
is based on microwave absorbers with high conductivity.         ature profile in tissue during a hyperthermia procedure
The penetration depth of microwaves in the 0.9–3 GHz range      depends upon two physical phenomena: (a) interaction of
into the human body can be several centimeters, which is        microwaves with tissue and (b) heat transfer in tissue [15].
suitable for medical applications. Comparing to the other       While considering the interaction of microwaves with tis-
mentioned methods [10, 11].                                     sue, propagation and absorption of microwaves in tissue is
     Current efforts have shown that numerical simulation       governed by Maxwell’s equations, stated in Equations (1)–
of nanoparticles assisted thermal therapy can be used as        (4).
a pre-treatment planning strategy which can help to pre-                                ∇ · D = ρ free                  (1)
dict temperature distribution within the body to optimize
the treatment parameters before the actual heating opera-
                                                                                          ∇·B =0                            (2)
tion [12, 13]. The main weakness with the current numerical
simulation is that the model has been often assumed with
a simple phantom geometry rather than the actual geome-                                            ∂B
                                                                                        ∇×E =−                              (3)
try [14]. One improvement to the current simulation model                                          ∂t
is to use three-dimensional (3-D) anatomically realistic ab-
                                                                                                    ∂D
domen model geometry to strength the accuracy of heat                                  ∇×H = J+                             (4)
                                                                                                    ∂t
transfer models for accurate prediction of temperature dis-
tribution. The use of 3-D realistic abdomen model geometry      Where D [C/m2 ] is electric flux density, B [T] is magnetic
is a key requirement for accurate prediction of temperature     field, E [V/m] is electric field strength, H [A/m] is magnetic
distribution during simulation of the heat transfer process.    field intensity, ρ free [A/m2 ] is current density and J [C/m2 ]
     This paper explains, through computer simulation of        is free charge density.
the real human model the use of microwave antennas in                The EM fields radiations radiated in a given tissue by
microwave imaging of tumor inside liver and it also predicts    an appropriate antenna can be determined by solving the
the temperature distribution in the liver; inside and outside   Maxwell’s equations, with the knowledge of tissue electro-
the tumor during hyperthermia with and without using            magnetic properties (permittivity and conductivity) and
nanoparticles.                                                  appropriate initial and boundary conditions, in order to
                                                                develop accurate models of the hyperthermia process.
                                                                     The absorption of electromagnetic power in tissues is a
                                                                function of their material properties, conductivity σ [F/m]
                                                                and dielectric permittivity ε [S/m].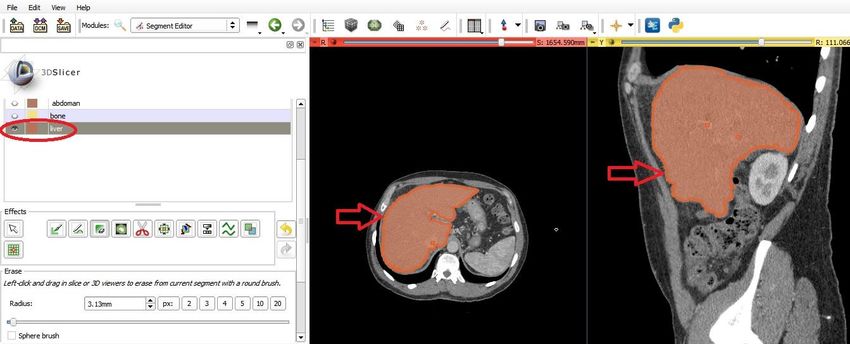
Nanoparticles in enhancing microwave imaging and microwave Hyperthermia effect | 225
2.2 Attenuation effect and penetration depth Where ω b [kg/m3 * s] is blood perfusion rate, c b [J/kg*K]
is the specific heat capacity of blood and T b [K] is blood
Microwave passes through the abdomen of the human body, temperature. Commonly, Q m is neglected as its magnitude
then through liver; it will attenuate, resulting in the de- is much smaller than other terms in this equation. The ab-
crease of the energy obtained by the liver. Interaction be- sorbed electromagnetic energy, Q, is computed from the
tween the microwave and a liver may be obtained with electromagnetic field distribution in tissue and can be writ-
knowledge of the relative complex permittivity ϵ* of that ten as (11).
material, given by the relation [16]. 1
Q = σ t |E|2 (11)
2
ϵ* = ϵ′ − jϵ′′ (5) As is the case with the electromagnetic model characteri-
zation of tissue thermal properties is required for accurate
Where ϵ′ is the dielectric constant and ϵ′′ is the dielectric
prediction of the temperature profile.
loss factor given by:
σ
ϵ′′ = (6)
2πf ϵ0
f is the frequency in Hertz,
3 Methods
From equations (5) and (6) it is possible to derive the
quantity of plane wave skin depth (δ) which is defined as
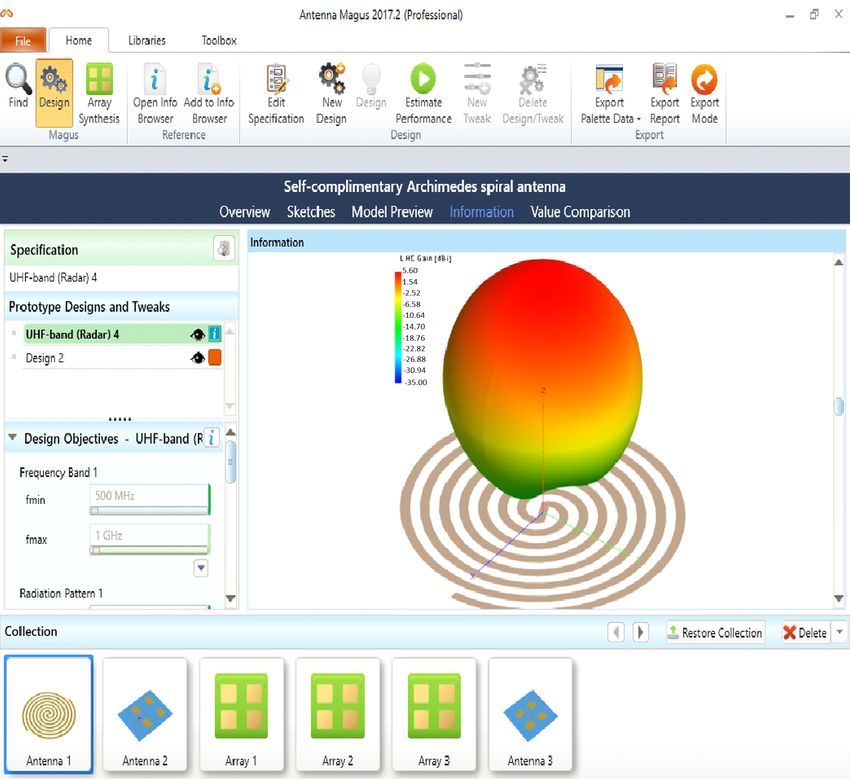
3.1 Antenna Design
the distance measured from the surface to a point in the
Antenna Magus (AM) is antenna design software product.
bulk material at which the amplitude of the electric field of
It takes on a totally new method to designing antennas. Its
an electromagnetic signal has been reduced by a factor of
tools assist researchers with antenna design. AM is the first
1/e of its surface value. The relation is given by:
design tool of its kind. Its huge searchable collection of an-
1 tennas can be explored to find, design and export models of
δ= (7)
α
designed antennas to CST Studio. It reduces the time to find
Where the attenuation coefficient α is given by: and assess feasible antenna approach for biomedical ap-
⎯
⎸ [︃√︂ ]︃ plication, providing reliable initial designs and confirmed
⎸ µϵ [︁ σ ]︁2
α = ω⎷ 1+ −1 (8) simulation models. It matches CST Studio very well, as im-
2 ωϵ portant tools within the antenna synthesis process [17, 18].
A planar Archimedes spiral is used also called planar
and µ is the material permeability given by the product of
Archimedean spiral (PAS) antenna, it considered to be fre-
relative permeability µ r and the permeability of free space
quency independent. However, in practice it has finite band-
µ0 , ϵ is the material permittivity given by ϵ r ϵ0 , σ is the
width due to their finite arm lengths and finite inner gap
material conductivity [16].
width. The minimum frequency is determined by the outer
diameter of the spiral and the maximum frequency by the
inner diameter and the precision at the feed region. PAS is
2.3 Heat Transfer in Tissue inherently circularly polarized with relatively constant in-
put impedance and radiation patterns over wide frequency
The temperature profile in tissue during hyperthermia is ob-
ranges [19].
tained by solving a bioheat equation. The most widely used
The arms of PAS antenna have a constant growth rate
bioheat equation for modeling thermal therapy procedures
as defined by the following equation:
is the Penne’s bioheat equation [13].
∂T r = b + ro φ (12)
ρc = ∇ · K ∇T + Q + Q p + Q m (9)
∂t
where the constants b is the starting radius and r o is the
Where ρ [kg/m3 ] is mass density, c [J/kg*K] is specific heat growth rate. The angle is represented by the independent
capacity, k [W/m·K] is thermal conductivity, T [K] is tem- variable, φ Figure 1 shows PAS antenna design sketch and
perature, Q [W/m3 ] is the absorbed electromagnetic energy, gain pattern, Figure 2 show shows Abdomen model using
Q p [W/m3 ] is the heat loss due to microvascular blood per- Self Complimentary Archimedes antenna
fusion, and Q m [W/m3 ] is metabolic heat generation. The The PAS antenna has a substrate made of Rogers RT
blood perfusion term, Q p is given by (10). 5880 which has a dielectric constant of 2.2 and thermal con-
Q p = ω b c b (T − T b ) (10) ductivity value 0.2 W/K·m. The thickness of the substrate is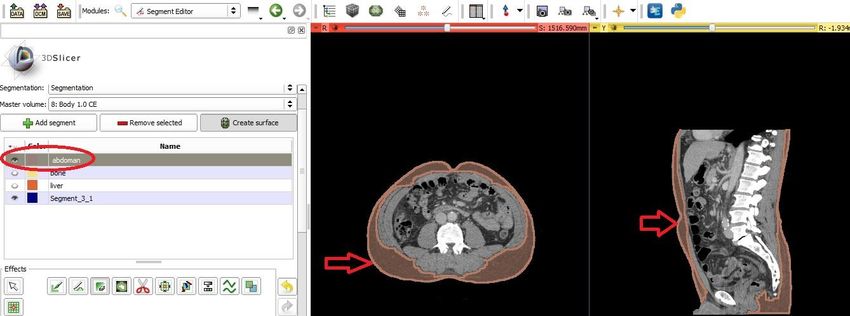
226 | W. Maamoun et al.

    (a)                                         (b)

Figure 1: PAS antenna (a) Sketch, (b) Gain pattern

                                                                 1 mm from the ground plane. The back side of the substrate
                                                                 contains the partial ground plane, the antenna is based on
                                                                 a 50 Ω semirigid copper-Teflon coaxial cable the ground
                                                                 plane is made up of copper which is a lossy metal, Table 1,
                                                                 demonstrate PAS Antenna Specifications.

                                                                 Antenna designing steps:
                                                                    • Investigate reflection coefficient S11 parameter vari-
Figure 2: Abdomen model using PAS antenna                             ations along with antenna parameter changes. By
                                                                      this way, we obtain the relation between S11 and an-
Table 1: PAS antenna Dimensions and specification
                                                                      tenna’s structural parameters [20].

      Antenna Specifications                    Dimensions /                                             Pr
                                                                                         S11 = 10log10                    (13)
                                                specification                                            Pi
                 Wa                              11.49 mm             Where P r is the reflected power and P i is the input
                 Sa                              11.49 mm             power. Smaller S11 indicates greater power coupled
                 Do                              429.4 mm             to the liver tissue
                 Di                              27.26 mm           • Computation of the EM field distribution, The CST
            Polarization                           Circular           STUDIO is applied in the computation process an
          Radiation pattern                     Bi-directional        adaptive solution is applied. The maximum number
                Gain                               4 : 6 dBi          of passes is set to 10 and maximum delta E per pass
                                                                      and refinement per pass is set to 0.2 and 20%.
                                                                    • Calculation of the specific absorption rate (SAR dis-
                                                                      tribution), first, we calculate the electric field around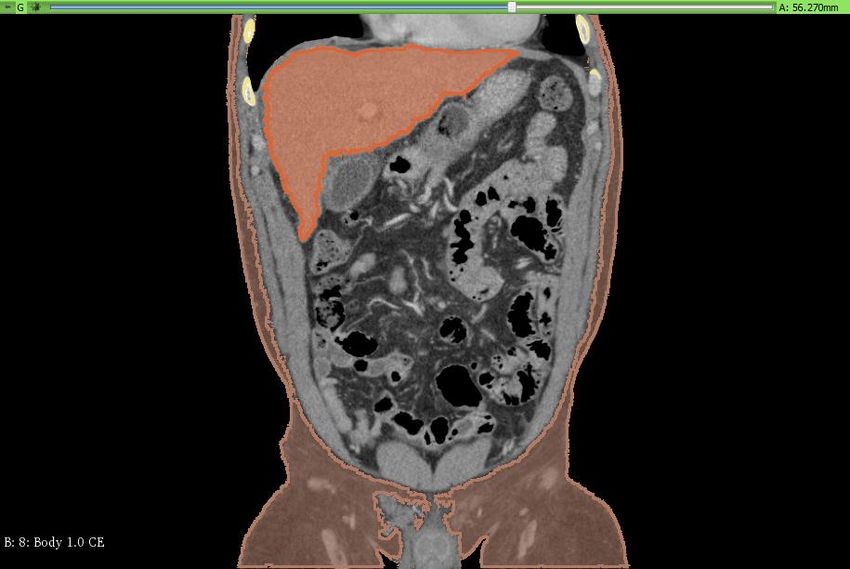
Nanoparticles in enhancing microwave imaging and microwave Hyperthermia effect | 227

       the antenna and parameter (S11 the reflection coeffi-
       cient). Next, we calculate the SAR distribution. The
       SAR takes a value proportional to the square of the
       electric field around the antenna and is correspond-
       ing to the heating source generated by the electric
       field in the tissue.
                                          σE2
                                SAR =                         (14)
                                           ρ
    • We investigated S11 as a function of frequency
      changes along with antenna’s different structural pa-          Figure 4: Fully automated segmentation for bone in 3D Slicer
      rameters. We obtained the relation between S11 and
      antenna’s structural parameters. The result shows
      that proper changing the space of adjacent spiral cir-
      cle or the spiral circle numbers of the antenna makes
      antenna to work at broadband frequency. And S11
      decreases when the width of spiral wire decreases.
    • An optimized PAS was designed. Its SAR distribution
      in tissue at 915 MHz was simulated. As a result, dis-
      tribution of SAR is convenient control when work
      frequency 915 MHz.

                                                                     Figure 5: Manual segmentation for liver in 3D Slicer

3.2 Modeling procedure

3.2.1 3D Human Abdomen Model Reconstruction

The first step into the construction of a realistic model was
to build a proper geometry based on anthropomorphic data.
This was accomplished by collecting actual anatomical CT

Table 2: DICOM images properties

 Plane                Number of slices               Resolution
                                                                     Figure 6: Semi-Automated segmentation for abdomen in 3D Slicer
 Axial                  455 slices                     1 mm
Sagittal                399 slices                     1 mm
Coronal                 399 slices                     1 mm

Figure 3: Direction of 3 plans data set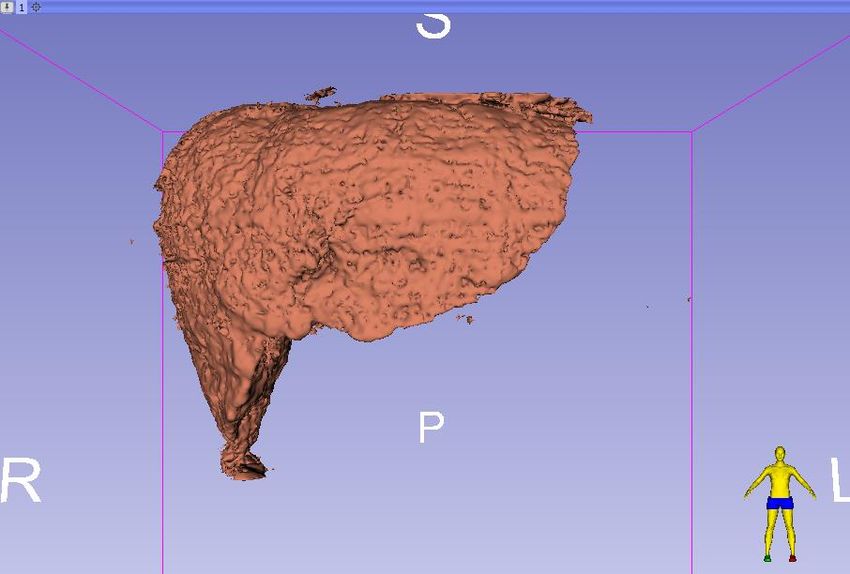
228 | W. Maamoun et al.

Figure 7: 3D Longitudinal sector of real human bone and abdomen model, and a Flow chart for segmentation procedures

images of the abdomen area in a real patient. It consists of        (EM) simulator for 3D volumetric modeling that takes ad-
four different tissues: fat, liver, bone and cancer. Each of        vantage of the familiar Microsoft Windows graphical user
these tissues which had been determine as 3D shapes and             interface. It integrates simulation, visualization, solid mod-
dimensions by using powerful software 3D Slicer.                    eling, and automation, are unique, where solution to 3D EM
     The provided data set is consisting of images in all the       problems is accurately obtained. Dielectric properties at
three planes axial, sagittal and coronal. Figure 3 shows the        frequency 915 MHz and thermal properties of the proposed
direction of the 3 planes used in data set Table 2. list the        3D real human abdomen model [8] are shown in Table 3
used DICOM images properties in each plane.                         and Table 4.
     After building each segment for different tissues, we               The proposed 3D real human abdomen model was de-
convert these segments into 3D shapes as STL file in order to       veloped using Computer Simulation Technology (CST Stu-
use these shapes for our simulation, where STL is abbrevia-         dio) which is a high-performance full-wave electromagnetic
tion of stereo lithography which is a CAD software created          (EM) simulator for 3D volumetric modeling that takes ad-
by 3D Systems, STL files describe only the surface geometry         vantage of the familiar Microsoft Windows graphical user
of a three-dimensional object without any representation            interface. It integrates simulation, visualization, solid mod-
of color. Figure 4, 5, and 6 shows the 3D segmentation of           eling, and automation, are unique, where solution to 3D
bone, real human liver, and abdomen model respectively              EM problems is accurately obtained.
Figure 7 shows the 3D Longitudinal sector of real human                  When a 3D abdomen model embedded in CST the re-
bone and abdomen model, and a Flow chart for segmenta-              sulting mesh elements total number was about 110 million
tion procedures.                                                    tetrahedral, To save time and cash memory used we utilize
                                                                    a simple model with fewer curvature, in addition to a spher-
                                                                    ical tumor with 1 cm was inserted at location 0, 0, 2 (x,y,z)
3.3 Finite Element Modeling (FEM)                                   instead of actual tumor in CT image which its volume was
                                                                    larger than 3.5 cm, as shown in Figure 8 also the aim of this
The proposed 3D real human abdomen model was devel-                 is to detect the ability of a microwave imaging to enhance
oped using Computer Simulation Technology (CST Studio)              tumor detection and diagnostic accuracy.
which is a high-performance full-wave electromagnetic

Figure 8: Abdomen model used in CST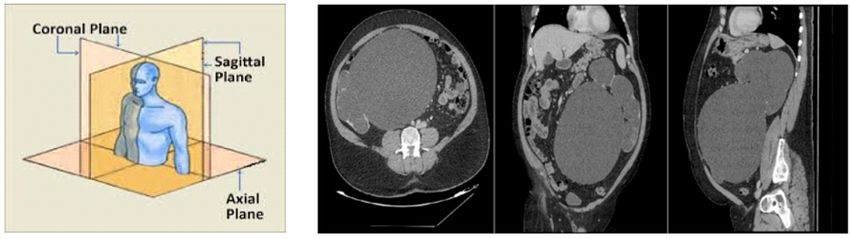
Nanoparticles in enhancing microwave imaging and microwave Hyperthermia effect | 229

Table 3: Dielectric properties of human tissue and cancer at         recorded at the transmitter. Microwaves traveling through
915 MHz                                                              the tumor experience a change in material dielectric prop-
                                                                     erty which leads to scattering of the incident wave. This
      Tissue                              915 MHz
                                                                     scattering modifies the energy detected at the SAR monitor
                                  εr                   σ (S/m)
                                                                     and the transmitter also. Finally, images are formed from
         Fat                   5.2801                  0.10452       the information of detected energies. This implies at least
        Bone                   20.756                  0.34353       two approaches for creating microwave images which are
        Liver                  46.764                  0.86121       tomography and radar-based technology.
       Tumor                   38.836                   0.595             In this work, we present the imaging results of our Mi-
Where ε r : Electrical permittivity, σ: Conductivity                 crowave imaging system that is equipped with a PAS an-
                                                                     tenna. Moreover, to demonstrate the safety of our system for
Table 4: Thermal properties of tissue and cancer
                                                                     human subject tests, we simulated the Specific Absorption
                                                                     Rate (SAR) in a realistic liver tissue model and compared
   Tissue           ρ [kg/m3 ]           C [J/Kg]        K [W/m]
                                                                     the resulted values with ICNIRP Standard [16].
     Fat                910               2973            0.201
                                                                          The operating frequency in this simulation is 915 MHz
    Bone               1850               1256             0.11
                                                                     the model is simulated by running the high frequency tran-
    Liver              1020               3816            0.469
                                                                     sition solver in CST Microwave Studio, set for an accuracy
   Tumor               1000               3500            0.570
                                                                     of −50 dB. These responses represent the state of the model
                                                                     without Nanoparticles as shown in Figure 9. The SAR was
                                                                     computed in the model at frequency 915 MHz a centrally lo-
4 Results and Discussion                                             cated region of SAR (0.063 W/kg) is observed (green color).
                                                                     This SAR region coincides with the cancer placed at the
4.1 Microwave Imaging                                                center of the liver model.

Currently X-ray-based imaging systems suffer from low con-
trast between malignant and healthy tissues in liver. Mi-             4.2 Effect of Gold nanoparticles on Specific
crowave Imaging shows a higher contrast between the afore-                Absorption Rate
mentioned tissues and therefore can enhance tumor detec-
tion and diagnosis accuracy [21].                                    A spherical gold nanoparticle with a diameter of 100 nm
     Exposing the liver to microwaves will cause the liver tis-      was embedded. The SAR was recomputed in the model after
sues to absorb some of the incident energy. The microwave            adding nanoparticles. We use GNPs in our simulation. The
energy travels through the liver model from a transmitter            SAR value (2 W/kg) shows a great enhancement after adding
(planar Archimedes spiral) and is detected at SAR mon-               GNPs as shown in Figure 10.
itor in CST Studio located on the other side of the liver
which acts as a receiver. Instantaneously, reflections may be

Figure 9: SAR by using (PAS) antennas at frequency 915 MHz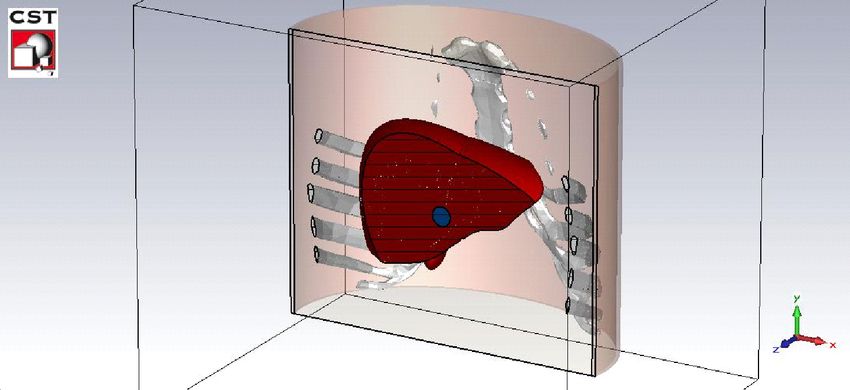
230 | W. Maamoun et al.

Figure 10: SAR by using PAS antenna after adding GNPs

4.3 Temperature Prediction                                            4.4 Effect of different nanoparticles on
                                                                          temperature measurement
Two temperature monitors were used to record tempera-
ture increase in the liver tissue which illuminated by PAS            4.4.1 Effect of silver nanoparticles
antenna. These temperature measurements were recorded
inside and outside the tumor with and without nanopar-                Spherical Silver nanoparticles (AgNPs) with a diameter
ticles. One monitor was placed at the center of the tumor;            of 100 nm were embedded around cancer at frequency
the other monitor was placed at 2 cm from the first monitor.          915 MHz and the transient temperature was once again
Figure 11 shows the temperature distribution in the human             studied.
liver model obtained from CST. With Presence of nanoparti-                Figure 12 shows that the temperature at the cancer re-
cles, there is an insignificant temperature increase in the           gion is now 40.5∘ C at frequency 915 MHz while the tem-
cancer to cause any damage to the tissues.                            perature of healthy tissue still not affected which is a great
                                                                      enhancement after adding AgNPs However; the results were

Figure 11: Temperature distribution during hyperthermia without nanoparticles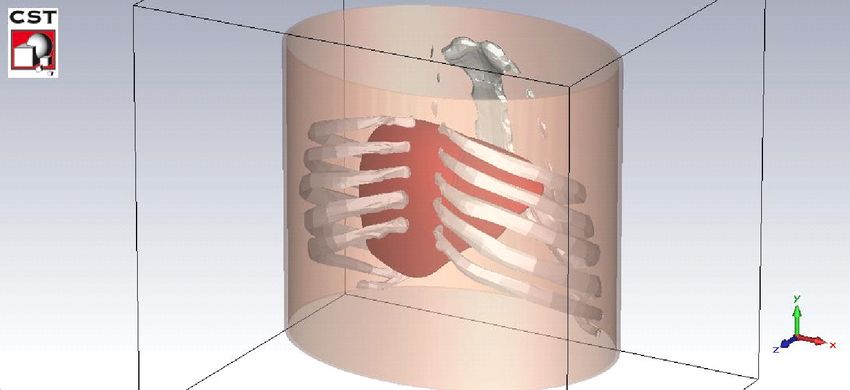
Nanoparticles in enhancing microwave imaging and microwave Hyperthermia effect | 231

Figure 12: Temperature distribution during hyperthermia with AgNPs at 915 MHz

unsatisfactory and did not achieve the required tempera-             frequency and also the temperature of healthy tissue still
ture.                                                                not affected which is a great enhancement after adding
                                                                     GNPs which is achieved the desired temperature for hyper-
                                                                     thermia.
4.4.2 Effect of gold nanoparticles                                       Results of SAR and Hyperthermia analysis at the end of
                                                                     the simulation were summarized Table 5, by analysis these
Gold nanoparticles were injected around the cancer at fre-           results it note that:
quency 915 MHz and then transient temperature was once
                                                                         • SAR has a better value (2 W/kg) when using GNPs at
again studied. These results in Figure 13 shows that the
                                                                           915 MHz frequency.
temperature at the cancer region is now 42.1∘ C at the same

Figure 13: Temperature distribution during hyperthermia with GNPs at 915 MHz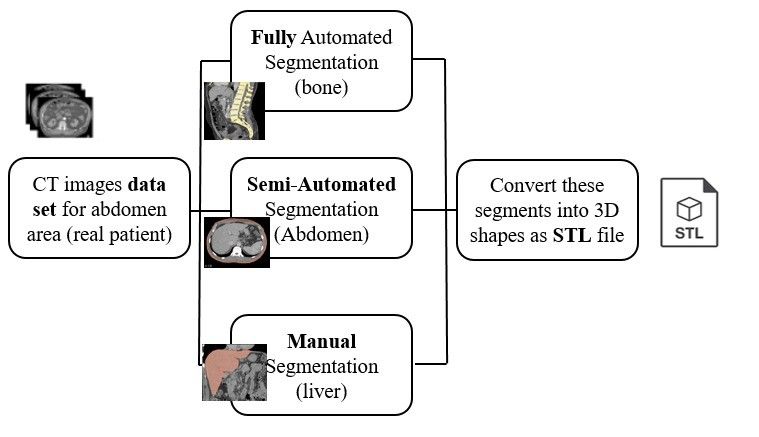
232 | W. Maamoun et al.

Table 5: SAR and Hyperthermia Results at 915 MHz

    Result                   SAR                       Hyperthermia                          Hyperthermia
                             W/Kg                  Without Nanoparticles                 With Nanoparticles
                                                     (Temperature ∘ C)                     (Temperature ∘ C)
                                                                                     AgNPs                   GNPs
                     Without         With           Inside        Outside     Inside     Outside      Inside      Outside
                       NPs           GNPs           Cancer        Cancer      Cancer      Cancer      Cancer      Cancer
    SAR               0.063           2                -             -           -            -           -          -
Hyberthermia            -              -             38.6          37.5        41.9         38.5       42.2        38.3

    • Achieving hyperthermia (41.9∘ C) when using AgNPs in and outside the cancer were modeled to accurately study
      at 915 MHz frequency, while the temperature in the microwave imaging and hyperthermia treatment for can-
      surrounding healthy tissue is in a safe limit (38.5∘ C). cerous tissues in the realistic liver model.
    • Achieving hyperthermia (42.2∘ C) when using GNPs              Simulated results were obtained using CST Studio and
      at 915 MHz frequency, while the temperature in the values for the SAR and transient temperature in the healthy
      surrounding healthy tissue is in a safe limit (38.3∘ C). tissue and the cancer were presented. Using Penne’s bio-
                                                               heat transfer equation and comparing results with and with-
    Figure 14 compares results of hyperthermia at 915 MHz
                                                               out Nanoparticles it was seen that Silver nanoparticles can
frequency, it notes that without using NPs (black) it reaches
                ∘                                              make a great enhancement in raising the temperature. How-
a value of 38.6 C, when using AgNPs (blue) it reaches a
                                                               ever, this result was unsatisfactory and did not achieve the
value of 41.9∘ C inside the cancer, while when using GNPs
                                                               required temperature but, after adding gold nanoparticles
(green) the temperature reaches a value 42.2∘ C inside the
                                                               the temperature exceed 42∘ C which is achieving the hy-
cancer, which is archived hyperthermia treatment, without
                                                               perthermia treatment without harming the nearby healthy
harming the nearby healthy tissue since the temperature
                                                               tissue.
outside cancel is 38.3∘ C.
                                                                    GNPs also can achieve a great enhancement in SAR
                                                               result and this result show that the system is safe for test
                                                               on human subjects, in accordance with Europe standards.

                                                                    Founding information: None. No funding to declare

                                                                    Author contribution: W. Maamoun: Collected the data, Con-
                                                                    tributed data or analysis tools, performed the analysis,
                                                                    drafting of the manuscript. Mohamed I. Badawi: Conceived
                                                                    and designed the analysis, provided the conception and de-
                                                                    sign of the study, drafting of the manuscript. Ayman A.Aly:
Figure 14: Compare results of hyperthermia at 915 MHz frequency
                                                                    Contribute to conclusion and review the manuscript. Y.
                                                                    Khedr: Contribute to conclusion and review the manuscript.

                                                                    Conflict of interest: The authors declare that they have
                                                                    no known competing financial interests or personal rela-
5 Conclusion                                                        tionships that could have appeared to influence the work
                                                                    reported in this paper
The challenge in hyperthermia treatment is to heat the
cancer to a therapeutic temperature without harming the             Data availability statement: The authors confirm that the
nearby healthy tissue. The results presented in this paper          data supporting the findings of this study are available
show that microwave imaging and hyperthermia treatment              within the article and its supplementary material.
can be enhanced by the use of GNPs.
     A system with a microwave applicator (PAS antenna)
at 915 MHz, Nanoparticles and Two temperature monitors
Nanoparticles in enhancing microwave imaging and microwave Hyperthermia effect | 233
[11] Dimitriou, N. M., A. Pavlopoulou, I. Tremi, V. Kouloulias, G. Tsi-
References garidas, and A. G. Georgakilas. Prediction of gold nanoparticle
and microwave-induced hyperthermia effects on tumor control
[1] Siegel, R. L. and K. D. Miller Cancer Statistics, 2019. A Cancer via a simulation approach. Nanomaterials, Vol. 9, No. 2, 2019,
Journal for Clinicians, Vol. 69, No. 1, 2019, pp. 7–34. pp. 167.
[2] Beik, J., M. Asadi, S. Khoei, S. Laurent, Z. Abed, M. Mirrahimi, et [12] Asadi, M., J. Beik, R. Hashemian, S. Laurent, A. Farashahi, M.
al. Simulation-guided photothermal therapy using MRI-traceable Mobini et al. MRI-based numerical modeling strategy for simula-
iron oxide-gold nanoparticle. Journal of Photochemistry and Pho- tion and treatment planning of nanoparticle-assisted photother-
tobiology. B, Biology, Vol. 199, 2019, id. 111599. mal therapy. Physica Medica, Vol. 66, 2019, pp. 124–132.
[3] Goyal, R. and R. Bhargava. FEM simulation of EM field effect on [13] Ardakani, A. A., A. Shakeri-zadeh, S. K. Kamrava, and B. Ghalan-
body tissues with bio-nanofluid (blood with nanoparticles) for dari. The effects of gold nanoparticles characteristics and laser
nanoparticle mediated hyperthermia. Mathematical Biosciences, irradiation conditions on spatiotemporal temperature pattern of
Vol. 300, 2018, pp. 76–86. 80 an agar phantom: A simulation and MR thermometry study.
[4] Sun, Y., Z. Cheng, L. Dong, G. Zhang, Y. Wang, and P. Liang. Com- Optik, Vol. 202, 2020, id. 163718.
parison of temperature curve and ablation zone between 915- [14] Mitilineos, S., S. Vassiliadis, P. Grimanis, K. Rizopoulos, S. P.
and 2450-MHz cooled-shaft microwave antenna: Results in ex Savaidis, N. A. Stathopoulos, et al. Design of a textile linear spiral
vivo porcine livers. European Journal of Radiology, Vol. 81, No. 3, antenna for medical imaging. 5th International Istanbul Textile
2012, pp. 553–557. Congress 2015: Innovative Technologies “Inspire to Innovate”,
[5] Alamzadeh, Z., J. Beik, V. Pirhajati, and A. Abbasian, Ultrastruc- September 11-12, 2015, Istanbul, Turkey.
tural and optical characteristics of cancer cells treated by a nan- [15] Prakash, P. Theoretical modeling for hepatic microwave ablation.
otechnology based chemo-photothermaltherapy method. Jour- Open Biomedical Engineering Journal, Vol. 4, 2010, pp. 27–38.
nal of Photochemistry & Photobiology, B: Biology, Vol. 192, 2019, [16] Clegg, P. J. and N. J. Cronin. Microwave soft tissue ablation. Con-
pp. 19–25. ference on Thermal Treatment of Tissue: Energy Delivery and
[6] Beik, J., M. Asadi, M. Mirrahimi, Z. Abed, A. Farashahi, R. Assessment III, April 14 2005, San Jose, California USA.
Hashemian, et al. An image based computational modeling ap- [17] Antenna Magus, User guide. 2017
proach for prediction of temperature distribution during pho- [18] Volakis J. L. Antenna engineering handbook.McGraw-Hill, New
tothermal therapy. Applied Physics. B, 55 Lasers and Optics, Vol. York, Chicago, San Francisco, Athens, London, Madrid, Mexico
125, No. 11, 2019, pp. 213. City, Milan, New Delhi, Singapore, Sydney, Toronto, 2007.
[7] Hilger, I., R. Hergt, and W. A. Kaiser. Towards breast cancer treat- [19] Nikawa, Y., Shima, M., Mori, S., & Okada, F. (n.d.). A flexible spiral
ment by magnetic heating. Journal of Magnetism and Magnetic antenna for medical application. AMPC Asia-Pacific Microwave
Materials, Vol. 293, No. 1, 2005, pp. 314–319. Conference, DOI: https://doi.org/10.1109/apmc.1992.672017.
[8] Ito, A., M. Shinkai, H. Honda, and T. Kobayashi. Medical appli- [20] Yacoob, S. M. and N. S. Hassan. FDTD analysis of a noninvasive
cation of functionalized magnetic nanoparticles. Journal of Bio- hyperthermia system for brain tumors. BioMedical Engineering
science and Bioengineering, Vol. 100, No.1, 2005, pp. 1–11. OnLine, Vol. 11, No. 47, 2012, pp. 1–22.
[9] Lu, B., X. L. Long, H. Huang, X. F. Zhang, X. G. Zhu, J. P. Lei, et al. [21] Badwai, M. I., M. B. Tayel, M. I. Badwai, and H. T. A. Hasan. A
Microwave absorption properties of the core / shell- type iron novel microwave image slices technique for early breast tumors
and nickel nanoparticles. Journal of Magnetism and Magnetic detection based on metalenses. The 7th International Conference
Materials, Vol. 320, No. 6, 2008, pp. 1106–1111. on Metamaterials, Photonic Crystals and Plasmonics, META’16,
[10] Wang, Y., J. Stang, M. Yu, M. Tsvetkov, C. Wu, and X. Qin et al. Mi- July 25-28, 2016, Malaga, Spain, pp. 1158.
crowave selective heating enhancement for cancer hypertheimia
therapy based on lithographically defined micro / nanoparticles.
Advanced Materials Technologies, Vol 1, No. 3, 2016, pp. 1–9.234 | W. Maamoun et al. A Additional figures Figure A1: Abdomen segmentation in 3D slicer Figure A2: Liver segmentation in 3D slicer
Nanoparticles in enhancing microwave imaging and microwave Hyperthermia effect | 235

Figure A3: Liver segmentation in 3D slicer

Figure A4: Three plan of segmentation in 3D slicer
236 | W. Maamoun et al.

Figure A5: Segmented liver model in 3D Slicer

B Multimedia
You can also read