Subjective audibility of MP3-compression artefacts in practical application
←
→
Page content transcription
If your browser does not render page correctly, please read the page content below
HAMBURG UNIVERSITY, INSTITUTE OF MUSICOLOGY

 Subjective audibility of
MP3-compression artefacts
 in practical application
     Hendrik Böhne, René Gröger, David Hammerschmidt, Robin Helm,
         David Hoga, Julian Kraus, Jakob Rösch, Christian Sussek

              Results of Praktikum Musikpsychologie, Student Work,
                             Leader: Prof. Rolf Bader
                                    18.04.2011

Abstract
This paper aims to assess the audibility of potential quality loss in MP3-compressed files
compared to CD quality files (WAV-files), as well as the influence of listening habits on qulatity
evaluation. For this study, samples of various musical genres were processed in different MP3
compression rates (48 kbit/s to 256 kbit/s). 21 listeners participated in an A/B comparison task
judging random combinations of either CD quality files to compressed files or compressed files
among each other. We investigated whether trained listeners notice differences between the files
and whether they prefer CD quality or MP3 quality. The results show that each participant notices
differences in files compressed at the lowest rate 48 kbit/s. Differences in files at 128 kbit/s and
higher cannot be noticed within the majority of listeners. At 96 kbit/s the majority at least notices
differences between the MP3 and the WAV-files. Still some subjects judge the MP3 versions as
sounding better. Additionally, differences appeared in terms of media use of participants. Subjects
who only consume compressed formats were much less able to tell compressed from the
uncompressed music than subjects who still listen to uncompressed CDs. So the exclusive use of
compressed media seems to lead both, to a decrease in sound perception ability, as well as to a
tendency to favour the compressed music over the uncompressed music.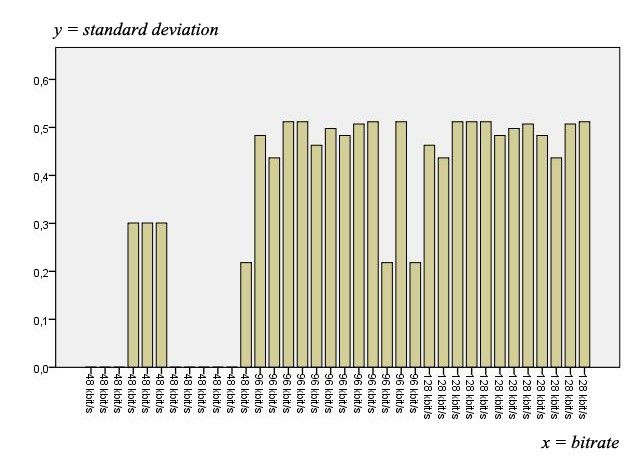
1

Table of Contents

1. Introduction                               2
  1.1 Literature Research                     2
  1.2 MP3                                     7
2. Experiment                                 9
  2.1 Participants                            8
  2.2 Preparation                             8
  2.3 Questionaire                            10
  2.4 Setup                                   11
  2.5 Test procedure                          12
3. Analysis                                   14
  3.1 Participants                            14
  3.2 Results of the test at 48 kbit/s        15
  3.3 Results of the test at 128 kbit/s       16
  3.4 Results of the test at 96 kbit/s        17
4. Discussion                                 21
2

1. Introduction
The subject of this paper is to evaluate whether a difference in sound quality can
be detected listening to pieces of music in various compression formats. Therefore
samples processed in various MP3 compression rates were presented to a group of
musicology students completing an A/B comparison task.
The work first sums up the current state of research continuing with a brief
overview of the MP3 format. It then explains the preparation of the test and its
procedure as well as the concluding analysis of the test results.
The following null hypothesis was phrased for the test: There are no noticeable
differences between samples in WAV format and ones processed in MP3 format.
This null hypothesis obviously leads to the following alternative hypothesis:
There are indeed noticeable differences between samples in WAV format and
ones processed in MP3 format.

1.1 Literature Research
Preparing our study we examined the literature at hand in order to get an overview
of the current research done in the field of knowledge we are addressing. We
collected different papers published by scientists who worked on studies related to
the topic subjective audibility of MP3 encoded sound files. In general, there has
been only little research done in this field so far. Only a small amount of studies
investigated the differences in compressed and uncompressed music. The studies
we read are all concerning different details, so they cannot really be compared.
Still a lot of research and investigation has to be done in the future.
The main source for our literature research was the website of the Audio
Engineering Society (AES) where every article published in the Journal of the
Audio Engineering Society or presented on one of the AES conferences can be
downloaded. Another source was the homepage of the Institute of Electrical and
Electronics Engineers (IEEE). In the following paragraph we will present a
selection of studies related to the field of knowledge of our study.
In 1992, the scientist John P. Stautner introduced his research on
psychophysically based digital audio encodings, such as the MP3 algorithm.
Within his research he presents two new measurement methods based on a
psychophysical model: the worst-case signal-to-mask ratio and the bit-rate
histogram.
3

The two measurements introduced by Stautner utilize a tree structured signal
decomposition. The tree structured decomposition takes advantage of the "ear's
critical bandwidth frequency sensitivity" 1. The audio signal is split into several
branches, each representing a filter bank of frequency subbands. The branches are
split furthermore, resulting in a total amount of 23 bands. Each leaf of the tree
represents an analyzed output or frequency subband of the decomposition. The
tree provides a so-called "multi-rate representation" of the given frequency
bandwidth of the audio signal 2. Stautner compares each of his measurement
methods, both utilizing the new tree structured signal decomposition with the
uniform signal decomposition of the ISO/MPEG layer ΙΙ, which divides the signal
into 32 bands.
The signal-to-mask ratio can be measured for a given set of input signals. "Its
value indicates the number of bits required to quantize the signal without
introducing audible noise"3. The higher the ratio, the worse is the audio quality of
the quantized signal. Stautner measures the highest signal-to-mask ratio, which is
the worst-case signal-to-mask ratio for every frequency band. The different
encoding algorithms use different audio signal decompositions, some are coarse
whilst others are more precise. Through these measurements the psychophysical
effectiveness of an audio signal decomposition can be estimated4.
The bit-rate demand histogram is another way to determine the psychophysical
effectiveness of an audio signal decomposition. The bit rates required for each
analyzed frequency band are measured and displayed in a histogram. It shows the
exact amount of bits required to quantize the signal without introducing audible
noise5.
Both measurements showed that the new tree structured algorithm provides an
advantage compared to the ISO/MPEG algorithm, because "it can be used to
approximate the critical bandwidth dependency of human hearing"6, meaning it is
psychophysically more effective.
Lee and Horner researched the discrimination of MP3-compressed instrument
tones. They wanted to find out, at what bit rates the differences between

1   cf.: Stautner, 1992: p. 205
2   cf.: Stautner, 1992: p. 205
3   cf.: Stautner, 1992: p. 205
4   cf.: Stautner: 1992: p. 205
5   cf.: Stautner, 1992: p. 205
6   cf.: Stautner, 1992: p. 206
4

compressed and uncompressed tones of musical instruments are either
distinguishable or indistinguishable.
Another aim was to find out whether these thresholds, where the difference is still
noticeable, depend on the type of instrument.
Therefore Lee and Horner recorded eight stimuli of eight different musical
instruments (bassoon, clarinet, flute, horn, oboe, saxophone, trumpet, violin) at
approximately 311Hz (Eb). All these stimuli had equal loudness and duration (two
seconds)7.
The original recordings were then compressed by ten different bitrates from 32 to
160 kbit/s and then presented to 31 listeners in a two-alternative forced-choice
discrimination paradigm. One trial consisted of two pairs, one with two original
and one with an original and a compressed tone, so that four different types of
trials were possible (AA-AB, AB-AA, AA-BA, BA-AA). The listeners’ task was
then to compare these pairs and detect the differences8.
Lee and Horner found out that there is a significant two-way interaction of bit rate
and instrument. Discrimination scores over all instruments showed that for the
lowest bit rate (32 kbit/s) discrimination is near 100%. When the bit rate increased
to 80 kbit/s and beyond, the discrimination scores were about 50%, which means
random guessing and the inability to differentiate between compressed and
uncompressed tones.
Discrimination scores of each instrument showed that at 128kbps and beyond no
differences between compressed and uncompressed tone can be heard
significantly9.
Lee and Horner named spectral irregularity, masking, signal-to-mask-ratio (SMR)
and spectral envelope sensitivity as reasons for their results, but did not describe
further explanations.
In 2006, the IEEE student member Evan P. Ruzanski published an article called
"Effects of MP3 encoding on the sounds of music" in the journal IEEE Potentials.
The article is about an experiment Ruzanski did to test whether listeners recognize
any quality reduction in MP3 encoded audio samples in comparison to raw WAV
audio samples across different musical genres. He explored the MP3 compression
effects in a blind A/B-comparison of the MP3 encoded track to the corresponding

7 cf.: Lee/Horner, 2010: p. 2
8 cf.: Lee/Horner, 2010: p. 3
9 cf.: Lee/Horner, 2010: p. 5
5

CD track in four different musical genres (heavy metal, soft rock, rap, classic).
The test persons – five untrained listeners between 19 and 32 years of age with
adequate hearing – were asked to select the track that they considered to be the
higher quality track between two tracks at a time.
Ruzanski hypothesized that the listener would not be able to recognize the MP3
track between the compression bitrates 128 kbit/s and 192 kbit/s. At 96 kbit/s the
track selection from the less dynamic genre (classic (nocturne)) would be
recognized. Furthermore, tracks between 32 kbit/s and 64 kbit/s would easily be
recognized10.
The results of this experiment showed, that the encoding of tracks at lower bitrates
could be done without notable negative effects. In this way, it is possible to save
storage space on hard disks and perceive quality, especially in the less dynamic
genres, because these tracks can be encoded at low bitrates. The MP3
compression algorithm proves to be an effective method. It can even increase the
perceived audio quality by removing enough high-frequency components from the
signal, which are most likely recognized as noise, via auditory masking to yield a
cleaner sounding piece of music11.
A study similar to our own was realised by four scientists at the Centre for
Interdisciplinary Research in Music Media and Technology at the McGill
University, Montréal, Québec. It was presented at the 127th Convention of the
Audio Engineering Society in October 2009.
The group of scientists investigated whether listeners prefer CD quality to MP3-
files at various bit rates (96 kbit/s to 320 kbit/s), and whether this preference is
affected by musical genre. Therefore they tested 13 trained listeners with a mean
length of studio experience of six years in a blind A/B comparison task. They
hypothesized that trained listeners would be able to discriminate between CD
quality files and MP3 compressed files. Furthermore, they sought to know
whether the results given depended on musical genre and/or listener's expertise
and if trained listeners could identify perceptual sound artefacts introduced by the
MP3 compression.
The comparison task included 5 musical samples in CD quality (WAV format),
each representing one musical genre (pop, metal rock, contemporary, orchestra,
opera). The samples were encoded into MP3 format at five different bit rates (96,

10 cf.: Ruzanski, 2006: p. 44
11 cf.: Ruzanski, 2006: p. 45
6

128, 192, 256 and 320 kbit/s). In the listening test the participants had to listen to
all possible combinations in a pairwise comparison and choose the one they
preferred. After the listening test, every participant had to fill out a three-part
questionnaire including questions about the procedure of the test, personal
listening habits, experience in different musical genres and the specific sound
criteria, which were used to make a decision on every sample12.
The investigation led to significant results: Over all, the participants preferred the
higher quality 68% of times. Listeners preferred CD quality files to MP3-files for
bitrates ranging from 96 to 192 kbit/s. The files encoded in higher bit rates had no
significant results in comparison to CD quality files. There was a significant
function of musical genre and expertise: In nearly 80% of times the higher quality
version was preferred from the group of sound engineers, regarding the two
samples for pop and metal rock. About 70% of times the sound engineers
preferred the higher quality version on the samples in contemporary, orchestra and
opera. The musicians group preferred the higher quality version in pop and metal
rock in 60% of times. For contemporary, orchestra and opera they had a
preference of 55% of times for the higher quality version. The results of this study
indicate that MP3 compression produces audible artefacts. The listener's
sensitivity varies as a function of musical genre and expertise. Trained listeners
are able to discriminate between CD quality files to MP3 compressed files in
bitrates ranging from 96 to 192 kbit/s13.
The results "indicate that MP3 compression introduces audible artefacts and that
listeners' sensitivity varies as a function of musical genre and listeners'
expertise"14.
One problem in analyzing the audibility of differences between compressed and
uncompressed music is shown in the experiment of Precoda and Meng who did
researches on listener differences in audio compression evaluations. Listeners
were asked to discriminate the original from a compressed version and to rate the
difference between these two phrases. They used 14 compressed versions of
Mozart’s Concerto No. 1 in G, which were played by either by solo violin or solo
flute15.

12   cf.: Pras et al., 2009: p. 2 – 3
13   cf.: Pras et al., 2009: p. 4 – 6
14   cf.: Pras et al., 2009: p. 6
15   cf.: Precoda/Meng, 1997: p. 2
7

The experiment yielded poor interlistener agreement for most pairs, which can be
explained by different ways of analysing the musical phrases16.

1.2 MP3
MP3 or MPEG 1 Layer III is a form of lossy audio compression, which has
become more and more important over the last ten years.
The advantage of MP3-technology compared to CD is that the files need only
1/10 of the space. A digital audio file on CD has for example a bit rate of
1.411.200 bit/s, a standard MP3-file has a bit rate of 128.000 bit/s.
This compression of information is possible because the MP3-algorithm works
with the perceptual limitation of the human hearing and filters information, which
are unable to hear. This process of filtration is based on a psychoacoustic model,
which is applied to the music files. The human ear for example is only able to
hear frequencies in a musical signal in a range of 20 Hz to 16 kHz. 17 Below or
above this auditory threshold the audio data are mostly irrelevant for the listener
and can be filtered.
An important aspect of the psychoacoustic model is the effect of masking. This
effect occurs, when a loud tone covers a more silent tone, so the listener is not
able to hear that there are two different tones. This can happen for example when
two sounds in the same frequency range appear at the same time. In this case we
talk of auditory or simultaneous masking. Another factor is the temporal masking,
which appears when a loud sound follows a silent sound with a maximal distance
of 5 ms.
This is an important aspect of how MP3-encoder reduces the size of the audio file
with little or no noticeable degradation in sound quality.
Another factor is the joint stereo effect. It describes an algorithm used for low
frequencies. Low frequencies have a wide wavelength and because of this the
human ear has no directional hearing for these tones. 18 The stereo coding exploits
this limitation and reduces the data by merging the stereo-signal to one mono
channel. This process does not reconstruct the original signal without loss.
The encoder calculates the energy values for masked sounds or the parts in which
joint stereo effect occur and assigns fewer bits to them than to the relevant ones.

16 cf.: Precoda/Meng, 1997: p. 2 – 3
17 Brandenburg, MP3 and AAC
18 Todd, Audio Data Compression Techniques
8

For this process is it necessary to convert the input signal into a mathematical
spectrum and compare the values of the signal with psychoacoustic tables.
To analyze the information calculated with the psychoacoustic model, an
analyzing filter is needed. This filter works with mathematical algorithms such as
the Discrete Cosine Transformation or the Fast Fourier Transformation. These
algorithms split each layer into a filter bank with 32 sub-bands. These sub-bands
represent different parts of the frequency spectrum of the audio file. By separating
the audio signal into these sub-bands, the encoder is able to classify different
sounds according to their frequency content — and so to prioritise some events
over others. For this prioritization the encoder requires the psychoacoustic model
in turn. For sub-bands containing more irrelevant frequencies for the listener the
encoder allocates fewer bits of data, whereas sub-bands with relevant information
get more bits. With this partition the important parts of the signal do not become
distorted while the amount of data with unimportant frequencies can be reduced.
For further information see Digital Audio Compression by Davis Yen Pan.
The different sub-band information is grouped into frames with a duration of circa
0.26 seconds. These frames enable the encoder to calculate how many bits of data
should be used to encode the signal by examining the content of each frame.
When little or no masking occurs in a frame, the encoder allocates more bits for it
and fewer bits for the frames where masking is likely to occur.
The total number of bits depends on the preset bit rate. At begin of every frame is
a header, which contains the structural factors of the particular frame. The header
data are important for reading the MP3-file.
To play the MP3-file as audio signal a decoding program examines the bit stream
of header and data frames for spectral components and the side information stored
alongside them.
9

2. Experiment

2.1 Participants
21 listeners participated in the experiment. All of them were undergraduate and
postgraduate musicology students from the University of Hamburg, Germany.
The group consisted of male as well as female participants between 21 and 31
years of age, and their experience in music ranged from 4 to 21 years. Their
experience varied from sparingly making and playing music to producing and
engineering it.
The tested people indicated their taste in music with different kinds like classical
music, jazz, rock/metal, pop, hip-hop, electronical/house music, and world music.
It was important for the experiment to recruit musically trained people to make
sure they knew the rough difference between MP3-files and WAV-files. The
participants used different kind of media to listen to music like CD, Vinyl MP3-
Player, and internet streams (YouTube and other sites). All participants chose to
partake in the experiment voluntarily.

2.2 Preparation
The samples chosen for the experiment were generated from the musical genres of
rock, classic, jazz, electronic/techno music, and hip-hop, as those genres provide
an overview of the most common music in the 21st Century.
The next step of the process was to find representative songs for each genre and
first of all, how many of them. Our team was split up into five groups – one for
each genre – and had to come up with five subjectively picked songs that present
the genres the best, considering public notice and sales figures. For the files
themselves we had to decide which parts of the songs were most representative.
The idea was to pick a preferably short sample of each song – as constant as
possible, concerning dynamic and frequency spectrum. Furthermore we had to
decide on how many samples in different bit rates we wanted to use per song. The
first test designed would have taken longer than one hour, thus we abolished the
hip-hop samples. As well we reduced the number of files for each genre from 5 to
3, otherwise the survey would have taken too long to keep the participants
concentrated.
10

Therefore it was of even greater importance to pick the samples most
representative for the chosen genres. To represent a typical rock song, for
instance, we chose the 3 basic elements of chorus, verse, and a guitar solo. It
became apparent, that finding ten seconds of a single song representing a whole
genre indeed is very difficult and only roughly possible.
Another problem to address was the audio quality and especially the volume
levels of songs on older records, produced in the 1970s or earlier. The audio
quality certainly differs from the quality on new records. Nonetheless we decided
to stick to samples from different eras, as the common listening habits of people
using MP3 players include Jimi Hendrix as well as Metallica, to name but two
examples for different production techniques.
The main question of our hypothesis was to find out, whether it is possible to hear
the difference between WAV- and MP3-files, and if it is, in which bit rates a
salient contrast is audible. The second question was, whether habits like total
listening time and regularly used media correlates to the detection ability. The
next step was to prepare the questionnaire including additional questions
concerning listening habits and musical experience of the participants.

2.3 Questionnaire
The questionnaire was ordered in two boxes, one each for the example A and B of
a pair. The boxes were in the same line and the groups were arranged among one
another. The questions on the second page referred to the participants’ gender and
age, their experience in music and their listening habits such as musical taste and
media used to consume music, as MP3-players, CDs, vinyl or internet streams.
We also asked the participants about the amount of music consumed per week and
their self-evaluation concerning their hearing abilities. The final question
addressed how quality differences of the music files were located.

2.4 Setup
Audio files were created using a personal computer on a windows vista operating
system. The audio files were stored on hard disk. The digital audio workstation
Steinberg Cubase SX was used for rendering and manipulating sound files as well
as for creating an audio file for testing. The M-Audio Mobile Pre USB-Interface
was used for D/A conversion. Audio was represented via Sennheiser HD-800
11

Headphones. Research included various genres as classic, jazz, rock and
electronic music. Three Songs were chosen from each genre. The titles of these
songs and the names of the artists as well as the year of publication and the name
of the genre are given in Figure 1.
Out of every song an excerpt of 10 seconds was extracted and stored to WAV-
format. Every excerpt was manipulated by adding a fade-in and a fade-out at a
length of one second for each excerpt at the beginning and at the end of the
sample. Every file was converted to different MP3-formats at bit rates of 48
kbit/s, 96 kbit/s, 128 kbit/s, 192 kbit/s and 256 kbit/s by using the lame encoder
and a joint-stereo-algorithm. All audio files were stored in different folders, one
folder per sample. The samples were grouped as either WAV & MP3 or MP3 &
WAV but even WAV & WAV for individual testing. After the MP3-files were cut
and processed to different bit rates, the samples were put in a random order, but
without deranging the genres. The whole test file was split in A/B categories. To
meet the requirements of the musical short-term memory, we created a pause of
one second of silence between two samples from the same song in different bit
rates and a pause of four seconds of silence between different songs. After
creating the test file in Cubase, a listening session was performed to adjust the
volume levels of all samples to aim a relative constant volume level due to
psychological loudness. The following pretest revealed that the proceedings of the
survey might lead to misunderstandings, so we decided to start the survey with an
example to prepare the participants. Our example contained two files with the
biggest range in compression: a WAV sound file and a 48 kbit/s MP3-file.
12

Name                                    Artist                Genre         Year of
                                                                            Publication
Die Roboter                             Kraftwerk             Electro       1978
We have arrived (Aphex Twin QQT         Mescalinum United     Electro       1994
Mix)
We love animals                         Crookers              Electro       2010
Smells Like Teen Spirit                 Nirvana               Rock          1991
Whole Lotta Love                        Led Zeppelin          Rock          1994
Voodoo Child                            Jimi Hendrix          Rock          1999
W.A. Mozart: Streichquintett g-moll     Melos Quartett        Classical     1987
KV 516 Adagio ma non troppo
M. Ravel: Bolero                        New Philharmonica     Classical     1996
                                        Orchestra
J.S. Bach, Goldberg Variationen         András Schiff         Classical     2003
BMV 988: variatio 6: canone alla
seconda a 1
So What                                Miles Davis            Jazz          1959
Achnowledgement                        John Coltrane          Jazz          1965
Eleventh Hour                          Abdullah Ibrahim       Jazz          2001
 Figure 1: Recordings used in the experiment

2.5 Test procedure
Prior to actual testing, a series of pre-tests were performed on members of the
research team to determine whether the experiment contained any possible flaws,
or alterations had to be made. The thirty-minute experiment was conducted in a
quiet room and with fully closed headphones to eliminate any falsifications of test
results caused by background noise. For mere practical reasons, two persons were
always tested simultaneously.
Before the beginning of the test, two pages of questionnaires were handed out to
the participants and the matter of the experiment was explained. It was clarified
that they were about to hear 72 pairs of sound samples, each pair containing the
same piece of music, compressed at different compression rates. They were
instructed to spontaneously decide which of the two samples sounded better to
their ears. Even if no tangible difference was experienced, the participants were
asked to check either one of the boxes on the first sheet.
The second page of the questionnaire contained various questions about the
person, the consumer behaviour of music and musical experience. This metadata
was collected to allow possible conclusions about correlations between
musicality, sex, or age of a participant and the audibility of quality loss in MP3-
13 compressed music. Furthermore, the test takers were asked which acoustical characteristics and mutations they had noticed as causes for their experienced quality loss. Since this question could only be answered after the actual test procedure, the subjects were asked to fill in the second page subsequent to the experiment. To avoid misunderstandings in the experimental setup, two exemplary sample pairs were played to the test persons under survey of a member of the research team before the beginning of the test. After making sure that nothing had been left unclear, the experiment was started and the participants were left alone.
14

3. Analysis

3.1 Participants
The 21 participants in the study were between 21 and 31 years old and had an
average active musical experience of 11,95 years. Although there were only 2
professional musicians/sound-engineers, the group can be considered as musically
skilled. Most of them had a confident self-assessment of their ability to hear
differences in audio material (average of 4,86 on a scale from 1 to 7). There was
no specific musical taste to be noticed. All participants named a more or less
widely spread repertoire of musical genres as their personal taste in music. The
average time per week they spent listening to music was 26,90 hours which is
almost 4 hours per day.

Figure 2: Use of Audio-Media [%]

These facts show, that the average participant was musically very accomplished
and (although rather young) experienced in dealing with audio material.
The youth of the participants may serve as a hint for their interesting habits
concerning the use of audio media. All participants possess an MP3-Player and
often use it. 85 % regularly listen to music via web-streams (myspace.com,
youtube.com etc.), which is usually the most compressed audio material available.
Furthermore, only 25 % use vinyl as an audio medium and even 10 % use MP3-
players and web-streams exclusively. These figures show, that people of this age
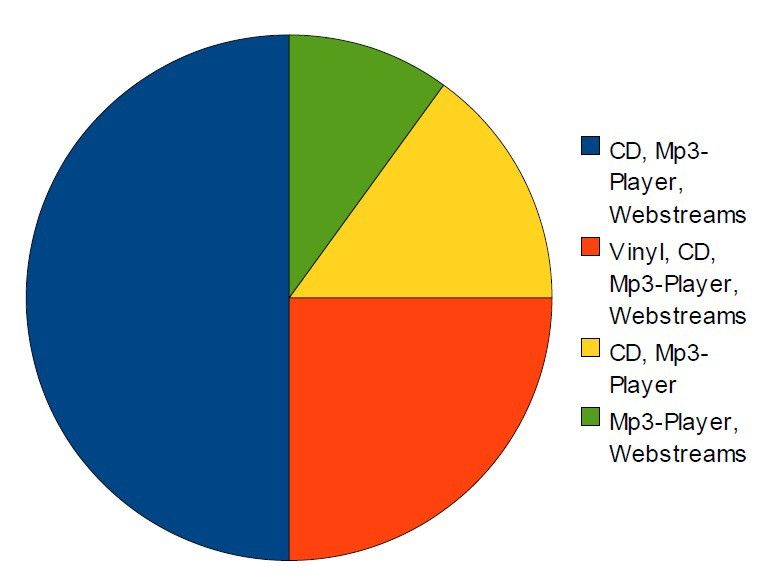
15

(so called “digital natives”) are really used to listening to compressed audio
material like MP3, which is considered as being of minor quality. Another
important fact may be, that MP3-players and web-streams are most often used
with bad headphones or bad speakers. Multitasking and a noisy environment may
also play an important role concerning lower attention to audio. The question is,
whether all this indicates ignorance or tolerance for the difference/loss of
information in audio-material.

3.2 Results of the Test at 48 kbit/s
The most significant and obvious result of the test is, that almost all participants
recognized the 48 kbit/s compressed file in direct comparison to a WAV-file.
Only few false answers were given concerning the question for the “better
sounding” file.
Of course, terms like “false answer” are misleading in this case, because the
construction of the survey asked for the participants’ personal opinion. Anyway,
we consider WAV-files as highest quality and MP3-files as lower quality for
descending bit rates. This may serve as an explanation for the use of terms like
“wrong answer”, “right decision” etc. in this paper. A neutral description – either
for the participants' answers, or for sound formats – may not always be used, but
rather the general scientific and public opinion is assumed.
Within the 48 kbit/s ratings, there are three standard deviation values of 0.3
happening to be the result of a mistake in the sample cutting process. Those three
WAV-files were accidentally taken as a mono-mix. This led certain participants to
a “wrong” decision in the quality evaluation. The other results in the 48 kbit/s
ratings display a clear consciousness for the sound of a low bit rate MP3. Figure 5
displays the standard deviations of the comparisons.
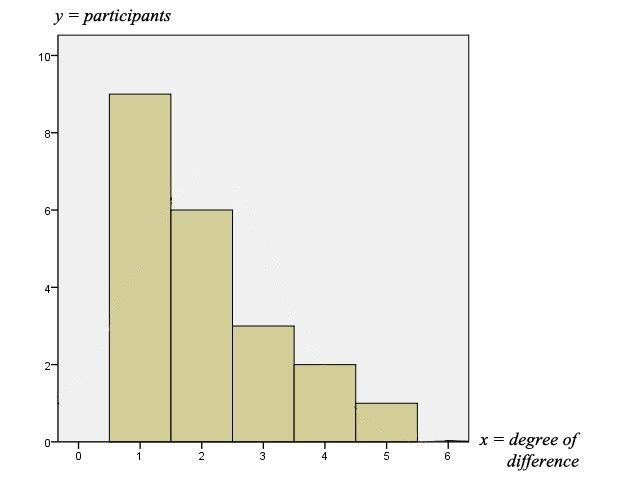
16

3.3 Results of the Test at 128 kbit/s
For the third lowest MP3-bit rate (128 kbit/s) the study gives a clear result as well:
Participants did not tell WAV from MP3 correctly. All standard regressions lie
around 0.5 for values between 0 and 1. The pair-comparison leads to maximum
entropy. Small majorities in single cases for one of the compared samples are
totally random and do not necessarily hint to the “right” file (as Figure 3 shows).

Figure 3: Direct comparison no.18 (128 kbit/s - WAV)

These right or wrong majorities can be found throughout all bit rates and even in
the WAV-WAV comparisons. The difference evaluation between 1 and 7 shows
an equally obvious result: Most people estimate the degree of difference as a 1 or
2. The fact that many participants who do not recognize the WAV-file answer
with higher values than 1 underlines this very obvious tendency. Nevertheless the
results are not as clear as at the 48 kbit/s bit rate. The reason for this might be the
natural way of peoples’ judgement: A clear difference will rather lead to a 7
whilst no difference will lead to a 1. The subconscious awareness that “there must
be a difference” makes people choosing higher values randomly. The WAV-
WAV comparison proves this explanation. The sample-arrangement in the study
kept this influence as small as possible, but in consideration of this phenomenon
the difference evaluations at 128 kbit/s draw a significant picture.
17

                                                                                 Figu
re 4: Difference evaluation at 128 kbit/s

3.4 Results of the Test at 96 kbit/s
The contrary results at 48 kbit/s and 128 kbit/s raise the question for the bit rate of
96 kbit/s, which is expected to be the critical point between noticeable and not
noticeable differences in sound. Furthermore, bit rates around 96 kbit/s are often
used for web radios and in private CD conversions.
Figure 5 shows the standard regressions of all pair comparisons from the three
lowest bit rates. It contains the most important information for one of the central
thesis in this study: People do not identify the allegedly “better sounding” WAV-
file from an MP3 with a bit rate of 96 kbit/s or more. Almost all standard
regressions for 96 kbit/s lie around 0.5 for values between 0 and 1. Right
identifications of MP3-files have to be considered as totally coincidental.
18 Figure 5: Standard deviation of the comparison between WAV and MP3, where most 48 kbit/s comparisons are 0 and the rest is around 0,5. But even though most people do not prefer WAV-files to 96 kbit/s, this study can prove that a majority still notices differences. While the overall average standard deviation is at 1.1, the value for the 48 kbit/s tests is 0.94. It is the lowest value and shows the confidence and unity of the participants. On the other hand, the highest value is 1.37 and can be found at the 96 kbit/s samples. So these samples produced a large disagreement on the degree of difference. To be exact: The average degree of difference at 96 kbit/s (2.79) lies above the 128 kbit/s (2.4) and all higher bit rates (2.0), as well. As a first conclusion, one can say that although bit rates of 96 kbit/s and higher cannot be identified as worse in sound quality, (some) people notice differences in sound. So there must be a number of participants who identify those differences better than others. Which dependencies on other variables of the test can be found? The first idea coming to mind is the amount of music people listen to. The Participants were asked how many hours per week they spent listening to music. The answers reached from 7 to 60 and averaged 26.90. Figure 7 shows generically, that there is no direct connection between the amount of consumed music and the ability to recognize differences in sound at 96 kbit/s. The few participants who hear differences go through the whole range of time-per-week. No tendency in any direction or specific clusters is discernible.
19

Figure 6: Average standard deviations

Figure 7: Hours of music per week concerning the difference heard at 96 kbit/s
While time-investment does not seem to play an important role, the question for
the used media displayed interesting results: In almost every case the participants
using only MP3-players and webstreams hardly identify any differences. Figure 8
shows a typical example of the participants’ difference evaluation in relation to
20

their regularly used audio-media. Obviously, a higher variability of media always
enables participants to notice differences slightly better. At the same time,
listening to music via vinyl does not lead to a better evaluation between WAV-
and MP3-files. A reason for this may be the entirely different sound of CD and
vinyl. Nevertheless, the exclusive use of compressed audio-media deadens the
feeling for sound differences while the use of CDs keeps it up.

            5

          4,5

            4

          3,5

            3
                                                                                     participants
          2,5

            2

          1,5

            1
                    Vinyl, CD, Mp3-Player, Webstreams               Mp3-Player, Webstreams
  CD, Mp3-Player, Webstreams                       CD, Mp3-Player

Figure 8: Regularly used Audio-Media concerning the difference heard at 96
kbit/s

The difference evaluation of two WAV-files proves the validity of this result. As
one can see in figure 9, the first two groups of higher quality media users tend to
evaluate non existent differences more easy (the reasons for this behavior are
described in chapter 3.3). Nevertheless, these values between 1 and 2 are not high
enough to explain a generally higher rating of differences at 96 kbit/s.
21
5
4,5
4
3,5
3
participants
2,5
2
1,5
1
Vinyl, CD, Mp3-Player, Webstreams Mp3-Player, Webstreams
CD, Mp3-Player, Webstreams CD, Mp3-Player
Figure 9: Regularly used Audio-Media concerning the difference heard at WAV-
WAV comparisons22 4. Discussion The average participant taking part in the study is young and as well musically interested as trained. The participants are well aware of digital media and use them naturally. Rather few of them are used to listening to music pressed on vinyl. On the other hand they are familiar with consuming music of inferior sound quality in noisy and distracting surroundings. Each participant easily recognises the MP3 played to them in 48 kbit/s, but nearly no one can tell the difference between a WAV-file and a 128 kbit/s MP3-file. On the other hand, listening to a 96 kbit/s MP3-file, most of them are able to detect differences in sound, but there is no coherent answer given about which sample sounds “better”. There seems to be no relation between the given answers concerning the quality of the samples and the amount of music consumed per week by the participants. In contrast, the media to consume music used by the participants seems to make a noticeable difference when it comes to judging the files’ quality. According to our results, it is conceivable that different listening habits may lead to a different perception of sound quality in general. If someone is familiar with MP3 rather than with how the original recording would sound on CD, they may possibly consider that the technically inferior MP3 appears more authentic to them. Another reason for the participants’ perception differing so evidently might be the test simply being too time consuming and difficult. Thus, to gain more informative results, another test would have to be performed – based on more precise requirements. The hypothesis pursued in that case would be whether people used to listening to MP3s naturally apprehend this form of media as sounding “better” than other sound carriers they are not as familiar with, neglecting the fact that the sound quality provided through a CD is technically higher.
23

References:
   − Brandenburg, Karlheinz: MP3 And AAC Explained, Erlangen 1997
   − Lee, C., Horner, A.: Discrimination of MP3-Compressed Musical
       Instrument Tones; J. Audio Eng. Soc., Vol. 58, No. 6, June 2010
   − Pras, Amadine et al.: Subjective Evaluation of MP3 Compression for
       different Musical Genres; 127th AES Convention, Convention Paper 7879,
       October 2009
   − Precoda, K., Meng, T.H.: Listener Differences in Audio Compression
       Evaluations; J. Audio Eng. Soc.,Vol. 45,No. 9, September 1997
   − Ruzanski, Evan P.: Effects of MP3 Encoding on the Sounds of Music;
       IEEE Potentials, Vol. 25, Issue 2, p. 43 – 45, March – April 2006
   − Stautner, John P.: Physical Testing of Psychophysically – Based Digital
       Audio Coding Systems; 11th International AES Conference: Test &
       Measurement, May 1992
   − Todd, Martin: Audio Data Compression Techniques; 94th AES
       Convention paper 3584, March 1993
   − Yen Pan, Davis: Digital Audio Compression; Digital Technical Journal
       Vol.5 No. 2, 1993
You can also read