COVID-19: What's New for June 25, 2020 - Main updates on IHME COVID-19 predictions since June 15, 2020 - Institute for Health ...
←
→
Page content transcription
If your browser does not render page correctly, please read the page content below
COVID-19: What’s New for June 25, 2020
Main updates on IHME COVID-19 predictions since June 15, 2020

Generating COVID-19 projections and alternative scenarios for all countries
SARS-CoV-2 continues to spread globally, and for many locations, rising rates of COVID-19 infections,
hospitalizations, and deaths are now occurring in the wake of eased or ended distancing policies. It is
increasingly clear that COVID-19’s toll will extend beyond the summer months in the Northern
Hemisphere, and current epidemics could easily worsen as the Southern Hemisphere enters its winter
season.

With today’s release, we publish a first set of COVID-19 projections for nearly all countries in the
world to October 1, 2020, except for countries that have experienced fewer than three deaths to date
(see end of document for a complete list). In addition, today we are not releasing our projections for
China, Ethiopia, Nigeria, India, Indonesia, and South Africa, but expect to release those in the next few
days.

With today’s release, we also publish our first set of alternative scenarios for the trajectory of COVID-19
in the coming months. We show our current projection (what we think is most likely to happen) as well
as two alternative scenarios. Here is more information on how we estimate each of the three trends
shown in our visualization tool.

To construct our “Current projection” (the line that shows what we think will most likely happen), we
assume that in each location the trend of easing mandates will continue at its current trajectory until
the daily death rate reaches a threshold of 8 deaths per million. If the daily death rate in a location
exceeds that threshold, we are assuming that mandates will be reintroduced for a six-week period. The
choice of threshold (of a rate of daily deaths of 8 per million) represents the 90th percentile of the
distribution of daily death rate at which locations implemented their mandates during the first months
of the COVID-19 pandemic. In other words, we use the observed experience from the first phase of the
pandemic to predict the likely response of governments during the second phase. We selected the 90th
percentile rather than the 50th percentile to capture the increased reluctance most governments will
have to re-impose mandates because of the economic effects of the first set of mandates. In locations
that do not exceed the threshold of a daily death rate of 8 per million, the projection is based on our
covariates and their forecasts to October 1. In locations were the daily death rate currently exceeds 8
per million, we are assuming that mandates will be introduced in a week’s time.

The first alternative scenario, referred to as “Mandates easing” in our visualization tool, shows what
would happen in each location if the current pattern of easing social distancing mandates continues and
new mandates are not imposed. In other words, this can be thought of as a worst-case scenario, where
regardless of how high the daily death rate gets, social mandates will not be re-introduced before
October 1. In locations where the number of cases is rising, this leads to very high predictions by
October 1.
The second scenario, referred to as “Universal masks” in our visualization tool, shows what would
happen if 95% of the population in each country always wore a mask when they were in public. This
value was chosen to represent the highest observed rate of mask use in the world during the COVID-19
pandemic. In this scenario, if the daily death rate in a location exceeds 8 deaths per million, we are
assuming that social mandates will be reintroduced for a six-week period, just like in our “Current
prediction” model.

We have not introduced any major updates to our modeling framework or our covariates since our last
release. We anticipate more data will become available on reopening plans, as well as the potential for
locations to reinstate prior distancing policies or implement new ones (such as mask mandates) amid
shifting COVID-19 trends. We will continue to update model inputs and parameters as new information
emerges, and we will communicate these changes accordingly.

Our results below can be explored online: https://covid19.healthdata.org.

A few key findings from today’s release (June 25)
Here are some key results for the three countries with the highest cumulative deaths to date.

    •   Increasing mask use to rates of 95% could reduce the number of estimated deaths due to
        COVID-19 substantially around the world. We estimate that increasing mask use could lead to
        reductions in the number of deaths by greater than 50% in many locations around the world,
        including countries in Africa (such as the Democratic Republic of the Congo, Sudan, Kenya, and
        Ghana), Europe (Albania, Croatia, Poland, and Bulgaria) as well as in some US states.
    •   In terms of absolute numbers, increasing mask use to 95% is estimated to avert the largest
        number of deaths due to COVID-19 in Pakistan (25,194 deaths), Egypt (20,930 deaths), and
        Bangladesh (20,344 deaths).
    •   Predictions for the three countries with the largest death tolls due to COVID-19 to date:
             o The US has had over 120,000 deaths so far. By October 1, 2020, cumulative COVID-19
                deaths could reach 179,106 deaths (with an estimated range of 159,497 to 213,715). In
                terms of the mean projection, this represents approximately 60,000 additional
                cumulative COVID-19 deaths between today and October 1, 2020. That number drops to
                146,047 (with a range of 140,849 to 153,438) if at least 95% of people wear masks in
                public. In other words, if 95% of the US population always wore masks in public, more
                than half the deaths that are predicted between now and October 1 would be avoided.
             o In Brazil, the cumulative death number has reached 54,289 (with an estimated range of
                53,808 to 54,816) and is predicted to increase to 166,362 (with an estimated range of
                135,538 to 208,079) by October 1. If use of masks in public were to exceed 95%, this
                number would reduce to 147,431 (with an estimated range of 121,048 to 186,281). The
                reduction in Brazil is relatively smaller in the scenario of universal masks because mask
                use in Brazil is already at high levels (over 75% self-reported use). The “Easing
                mandates” scenario shows that if Brazil were to continue with mandate easing and not
                re-impose mandates when daily deaths exceed the threshold of 8 deaths per million,
                the total death count by October 1 could reach 340,476 (with an estimated range of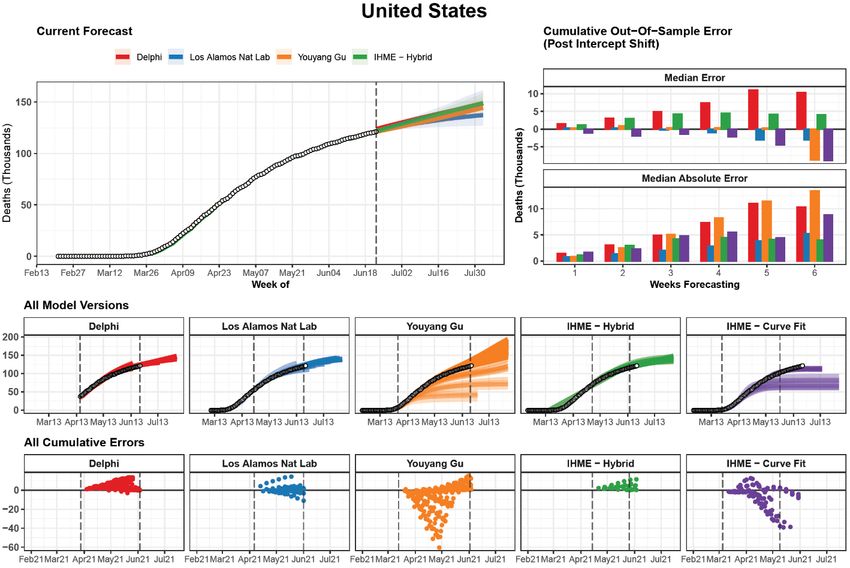
232,929 to 479,668). This estimate of a worst-case scenario highlights the importance of
                re-imposing mandates when the daily death rate increases.
            o   The UK has seen 42,976 deaths as of June 25 (with an estimated range of 42,904 to
                43,054). Our predictions suggest that an additional 4,948 deaths will occur between
                now and October 1. However, if use of masks were to reach 95% or higher, 2,528 of
                these deaths would be avoided.

Why masks? How effective are masks?
Building on recently published meta-analyses and incorporating 41 papers, IHME researchers performed
a meta-analysis of peer-reviewed scientific studies and medRxiv pre-prints in an assessment of mask
effectiveness for preventing respiratory viral infections. The studies were extracted from a medRxiv
publication by Liang, M., Gao, L., Cheng, C., Zhou, Q., Uy, J.P., Heiner, K., & Sun, C. (May 5, 2020) titled
“Efficacy of face mask in preventing respiratory virus transmission: a systematic review and meta-
analysis.” In addition, we considered all articles from a second meta-analysis by Chu, D.K., Akl, E.A.,
Duda, S. et. al., published June 1, 2020, in The Lancet, titled “Physical distancing, face masks, and eye
protection to prevent person-to-person transmission of SARS-CoV-2 and COVID-19: a systematic review
and meta-analysis.” Lastly, we added one supplementary publication by Wang, Y., Tian, H., Zhang, L. et.
al., published May 11, 2020, in BMJ Global Health, titled “Reduction of secondary transmission of SARS-
CoV-2 in households by face mask use, disinfection and social distancing: a cohort study in Beijing,
China.”

We extracted all relevant outcomes per study. Additionally, we extracted and included additional
covariates and explored various model specifications.

 Category                              Covariates
 Type of population using mask         General population versus health care population
 Country of study                      Asian countries versus non-Asian countries
 Type of mask                          Paper/cloth or nondescript versus medical masks and N95
                                       masks
 Type of control group                 No use versus infrequent use
 Type of disease                       SARS-CoV 1 or 2 versus H1N1/influenza/other respiratory
                                       pathogens
 Type of diagnosis                     Clinical versus laboratory

We used IHME’s customized meta-regression tool (“meta-regression—Bayesian, regularized, trimmed,”
or MR-BRT) to perform a meta-analysis that takes into account the various characteristics of each study
(shown in the table above) and captures between-study heterogeneity. We also explored various
sensitivity analyses to verify the robustness of the modeled estimates and found that the estimate of
the effectiveness of mask use did not change significantly when we explored four alternative analyses,
including changing the continuity correction assumption, using odds ratio (OR) versus relative risk (RR)
from published studies, using a fixed effects versus a mixed effects model, and including studies without
covariate information.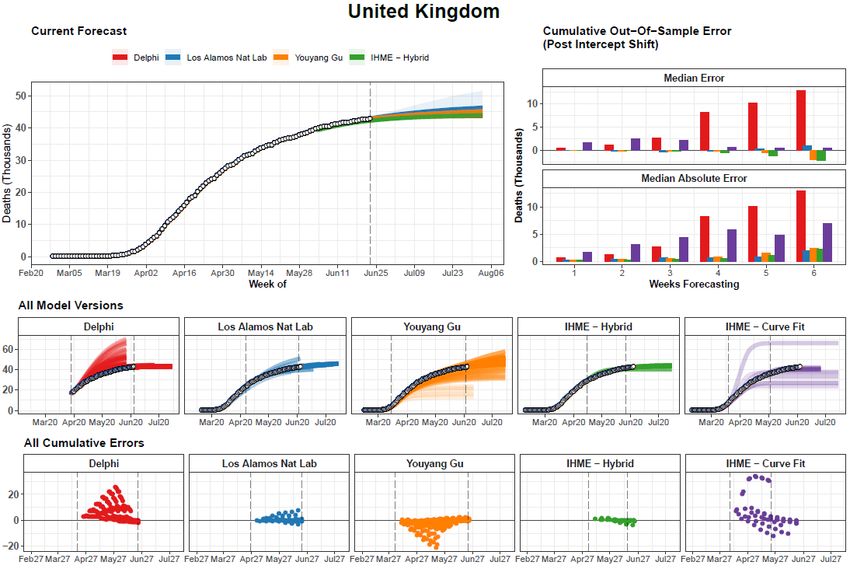
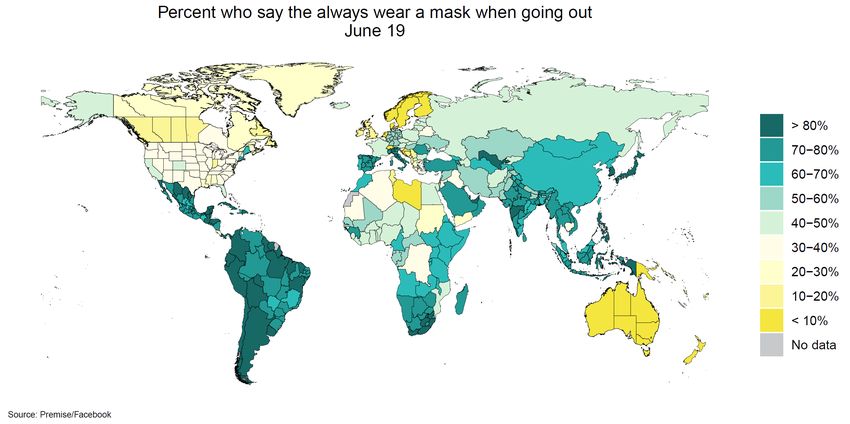
Our analysis of all respiratory infections and mask effectiveness suggests a reduction in infection for
mask-wearers by at least one-third compared to control groups. This work supports the growing
scientific consensus that cloth masks, whether homemade or commercial, can reduce respiratory virus
infections by 33% and slow community spread of COVID-19.

How many people are wearing masks around the world?
Mask-use data analyzed by IHME come from two sources. For the US, IHME analyzed survey data
provided by Premise, a crowd-sourcing data collection company. Covering all 50 states and Washington,
DC, Premise data range from the week of April 21, 2020, to the present, with a new data file provided to
IHME on a weekly basis. For all other countries, we use survey data collected by the Facebook Global
symptom survey (this research is based on survey results from University of Maryland Social Data
Science Center). Data collection started on April 23, 2020, and continues to the present. IHME receives
the data with a two- to three-day lag. Data are collected in 101 countries and are available for the
states/provinces within the countries where we provide model estimates at the subnational level.

The map below shows the proportion of people reporting always wearing a mask when outside their
home on June 19, which represents the date of the most recent data that contributed to our model
predictions published today.
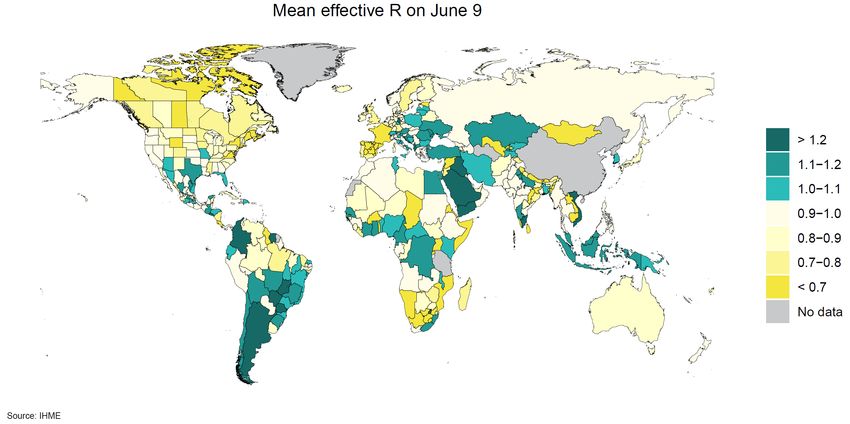
Globally, mask use has increased dramatically since March. However, reported mask use remains
relatively low in North America and Northern Europe. In North America, rates are relatively low in both
the US and Canada. Across US states, we see a range of 15% in Tennessee to 62% in Massachusetts.
Mask use rates in Northern Europe are markedly lower. Only 11.5% of people in the UK report wearing a
mask. Lowest reported use is found in Nordic countries, with only 1% of the population in Denmark,
Norway, and Sweden answering in the affirmative. Low mask use rates are also observed in Australia
and New Zealand, a phenomenon likely explained by near-zero case rates in both countries. Reported
mask use is high across Latin America, where Chile has the highest reported use (93%), followed by
Guatemala (92%), Peru (90%), and Bolivia (90%). In South and Southeast Asia, high rates of mask use are
reported. In Africa, there is wider variation across countries, with rates as low as 21% in Sudan and as
high as 85% in Gauteng province in South Africa.

Given the effectiveness of masks to reduce transmission, widespread use of masks has the potential to
change the course of the pandemic and, in many locations around the world, prevent a second wave
from happening. So, please, wear a mask. Always wear a mask.

Where are the number of infections increasing right now?
The map below shows the mean value (across the 1,000 regressions that we run in our SEIR model) of
effective reproductive number, R, on June 9. Infections on June 9 roughly correspond to cases of COVID-
19 on June 20 given the average duration of 11 days between infection and being reported as a case.
Where this value is greater than 1, it means that every person infected with COVID-19 will produce more
than one additional infected person. To successfully eliminate a disease from a population, R needs to
be less than 1.
The map shows that on June 9 in many parts of the world, R was lower than 1, including many parts of
North America, Europe, Africa, India, Australia, and New Zealand. Locations that are showing effective R
values greater than 1, which means that the number of cases of COVID-19 in the population is growing,
include several states in India, the US, Mexico, and Brazil, as well as many countries in the Southern
Hemisphere, such as Argentina, Chile, and Indonesia. Several countries in the Middle East, including
Egypt, Saudi Arabia, Iraq, and Yemen, as well as Turkey and Iran, also had R values greater than 1 as
recently as two weeks ago.

How well is our model performing? Introducing a global framework for COVID-19 mortality
forecast comparisons
Forecasting models have provided critical information about the course of the COVID-19 pandemic. In
attempting to predict both the timing of peak deaths and the total magnitude of mortality, these models
have played an influential role in driving the responses of policymakers and health systems alike.
Although a number of groups have provided comparisons of out-of-sample predictive validity – checking
how well past versions of forecasting models predict subsequently observed trends – these have been
predominantly focused on the United States. Similar systematic comparisons have not been undertaken
globally, despite the growing number of countries being affected by COVID-19. We therefore undertook
a review of each model, its assumptions, and its out-of-sample predictive performance. This is of
particular importance as forecasting models increasingly seek to leverage observed trends in places with
established or concluded epidemics, such as the United States or Europe, to predict future trends for the
emerging epidemics in other locations, such as Brazil and India, as well as countries in Africa.

As data and models are updated regularly, a publicly available, transparent, and reproducible framework
is required to evaluate them in an ongoing manner. We are excited to share preliminary work on the
creation of such a framework as a public good to aid researchers and policymakers in critically and
systematically assessing model performance. It is our hope that this spurs conversation and cooperation
among researchers, which might lead to more accurate predictions and ultimately aid in the collective
response to COVID-19.
Creation of the framework
To create this framework, we have reviewed 93 published and unpublished COVID-19 forecasting
models and have comprehensively evaluated six models for which publicly available, multinational, and
date-versioned mortality estimates could be downloaded (see table below). These included those
models by DELPHI-MIT (Delphi), Youyang Gu (YYG), the Los Alamos National Laboratory (LANL), Imperial
College London (Imperial), and two models produced here at IHME, the Curvefit model (IHME-CF) that
was used between March 26 and end of April, and the hybrid epidemiological compartment model
(IHME-HSEIR), which we have used since early May. Collectively, these models cover 164 countries, as
well as the 50 US states and Washington, DC, and accounted for >99% of all reported COVID-19 deaths
on June 23, 2020.
Model Data Access Model Type Geographies Range
1 IHME – CurveFit http://www.healthdata.org/covid/data- Statistical Curve fit 73 Countries* August 4
2 IHME – Hybrid SEIR http://www.healthdata.org/covid/data- Hybrid SEIR + Curve fit 73 Countries* October 1
3 Youyang Gu https://github.com/youyanggu/covid19_projec SEIR 76 Countries* October 1
4 MIT – DELPHI https://github.com/COVIDAnalytics/DELPHI SEIR 151 Countries* 6 weeks
5 Imperial–LMIC https://github.com/mrc-ide/global-lmic-reports SEIR 109 Countries 12 weeks
6 LANL–Growthrate https://covid-19.bsvgateway.org/ Dynamic Growth 121 Countries* 6 weeks
These models differ across a number of dimensions, including which sources of input data they draw
upon, how often they are updated, how far they extrapolate in time, and for which locations, as well as
the specific outcome metrics predicted. Differences in each of these areas must be taken into account to
provide a fair and relevant comparison between the models.
Reference data comparison: We chose to use mortality data collected by the Johns Hopkins University
Coronavirus Resource Center (JHU), used widely across models as input data, as the reference data
against which forecasts were compared. These data have been similarly used in validation exercises for
US-based predictions. It is worth noting that IHME does use JHU data for many of our locations, but not
all. We assess the quality of JHU data, and for locations where we find a more reliable or valid source of
information, we use that alternative source.
Frequency of publication: Most forecasting models are updated regularly, but at different intervals, and
on different days. Given that specific days of the week have been associated with a greater number of
reported deaths on average, previous model comparison efforts in the United States – such as those
collected by the CDC – have required modelers to produce estimates using input data cutoffs from a
specific day of the week. For the sake of including all publicly available modeled estimates, we took an
inclusive approach, considering each iteration of each model, and focusing on errors in cumulative and
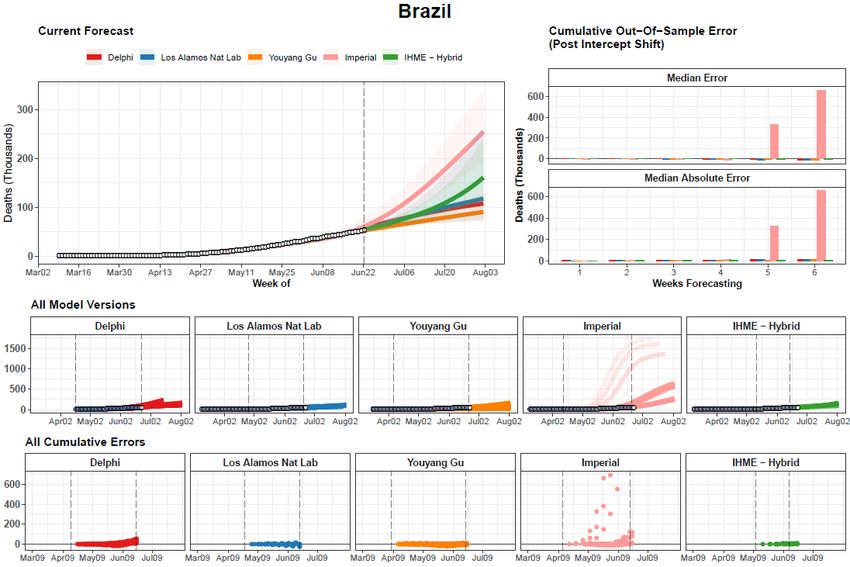
weekly mortality, which are less sensitive to day-to-day fluctuations in reported mortality magnitude.Locations and forecast duration: Each model produces estimates for a different set of national and subnational locations, and extrapolates a variable amount of time from the present. Each was also first released on a different date, and so reflects a different overall window of the COVID-19 pandemic. We included estimates from all possible locations and time periods, although we stratified by region and weeks of extrapolation, and masked summary error statistics reflecting small numbers of locations or time points. Quantities compared: Each model includes different estimated quantities, including daily and cumulative mortality, number of observed cases, number of true underlying cases, and various dimensions of hospital resource utilization. We focus on mortality, as it was the only universally reported outcome. Cumulative mortality forecasts and prediction errors by model – example for United States The most recent version of each model is shown on the top left. The middle row shows all iterations of each model as separate lines, with the intensity of color indicating model date (darker models are more recent). The vertical dashed lines indicate the first and last model release date for each model. The bottom row shows all errors calculated at weekly intervals from one to six weeks. The top right panel summarizes all observed errors, using median error and median absolute error, by weeks of forecasting. Errors incorporate an intercept shift to account for differences in each model’s input data.
Below are the same graphs for the UK and Brazil, the two countries with the highest numbers of total
deaths to date after the US. Similar graphs for all other locations will be available in a forthcoming
preprint manuscript.
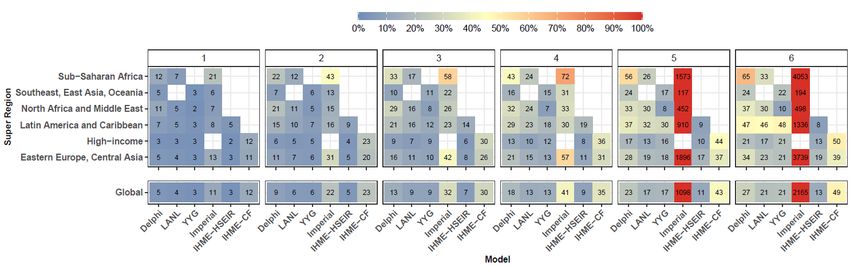
Assessing the magnitude of mortality
The evaluation framework we developed for evaluating the magnitude of mortality is shown for three
example countries – the United States, the United Kingdom, and Brazil. We retrospectively calculated
the error in cumulative mortality compared to subsequently observed trends by number of weeks of
model extrapolation up to six weeks. We used the median absolute percent error (MAPE) as a measure
of accuracy.

Predictive validity of cumulative mortality – median absolute percent error
Median absolute percent error values were calculated across all observed errors at weekly intervals for
each model. Results are shown separately by super-regional grouping used in the Global Burden of
Disease study (top) as well as globally (bottom). Results are also shown separately by weeks of
forecasting, seen at the top of each box. Values that represent fewer than five locations for a given
super-region grouping are not shown.

As we would expect, the magnitude of errors increased with longer durations of extrapolation. At two
weeks, the best-performing model was the IHME-HSEIR model, with a MAPE of 4.5%, followed by YYG
(5.7%) and LANL (6.1%). At six weeks, the IHME-HSEIR model had a MAPE for cumulative deaths of
12.8%, followed by LANL (20.6%), YYG (21.6%), and Delphi (27.5%). Comparing between geographies,
errors in cumulative mortality predictions were consistently highest in sub-Saharan Africa. In contrast,
MAPE values were lowest among high-income countries, at 5.9% and 22.6% at two and six weeks,
respectively. These systematic regional differences reflect both differences in underlying data
availability and also a different level of prediction difficulty in earlier versus later stages of the epidemic.

Sharing the framework
Transparency and reproducibility of this framework will be key for researchers and policymakers to
systematically compare and improve on existing predictions. Stay tuned for a preprint manuscript that
will be available soon and will offer additional comparisons, such as how each of these models has
performed in predicting the timing of peak mortality in addition to the magnitude of mortality. We will
also release a publicly available codebase that will allow other researchers to recreate, update, and
adapt upon our framework.
Data updates since our last release on June 8, 2020
Data and locations
   •   Reported data on COVID-19 deaths, cases, hospitalization, testing, and mobility, as well as
       available information on social distancing policies, have been added through at least June 20.

   •   We have provided estimates and alternative scenarios for all countries in the world, except the
       following: American Samoa, Bermuda, Bhutan, Burundi, Cambodia, Cook Islands, Dominica,
       Ethiopia, Fiji, Greenland, Grenada, India, Indonesia, Kiribati, Laos, Lesotho, Marshall Islands,
       Micronesia, Mongolia, Namibia, Nauru, Nigeria, Niue, North Korea, North Mariana Islands,
       Palau, Saint Kitts and Nevis, Saint Vincent and the Grenadines, Samoa, Saint Lucia, Seychelles,
       Solomon Islands, South Africa, Tanzania, Timor-Leste, Tokelau, Tonga, Turkmenistan, Tuvalu,
       and Vanuatu. Estimates for Ethiopia, India, Indonesia, Nigeria, and South Africa will be released
       in the next few days.

Covariate updates
   •   Mobility predictions and reopening of educational facilities. As mentioned above, a key aspect
       of making COVID-19 projections to October 2020 involves capturing potential effects of
       reopening educational facilities for the 2020–2021 academic year, particularly in the Northern
       Hemisphere. Start dates for schools are extremely variable: they differ by education level
       (primary, secondary, and higher education), school type (public versus non-public), and even by
       school district. For our current model, we have decided to use August 15 to reflect a time when
       many schools might otherwise resume instruction, or at least many educational facilities may be
       actively preparing for the new school year and thus some combination of staff and students may
       be interacting with each other again. At this date, we assume locations that have not already
       eased or ended school closures will do so. This distancing policy status update is then
       propagated through mobility predictions and thus informs the transmission dynamics
       component of our broader modeling platform. The May 4 estimation update provides additional
       detail on this process to date.
   •   In addition to mobility, covariates currently in our model include COVID-19 testing rates, mask
       use, pneumonia mortality rate, air pollution, altitude (proportion of the population that live in
       locations that are under 100 m above sea level), smoking prevalence, and population density.

What’s in the development pipeline for IHME COVID-19 predictions
Before we introduce new model components or improvements to our current analytical platform for
predictions, IHME’s COVID-19 development team members test these additions or changes.

Based on currently available data and model testing progress, our immediate- and medium-term
priorities are as follows:
• Additional scenarios for COVID-19 projections for the world. We are preparing the machinery
to be able to estimate the trends for additional scenarios, including introducing intermittent
mandates in the future. We are receiving many requests for additional scenarios from
policymakers at the national and local level in many countries, and we hope to be able to
produce the scenarios that are most relevant to them and that will provide useful input in their
decision-making process in the near future.
• Additional potential epidemic drivers. In addition to the covariates now incorporated into our
models, we are exploring the inclusion of indicators such as human contact rates, use of public
transit, household size, and humidity, among others.
• Additional analysis for the US. We are hoping to soon be able to release estimates and
predictions by race/ethnicity and by sex in the US. We are also working on making predictions at
the county level in the US.
A note of thanks
We would like to extend a special thanks to the Pan American Health Organization (PAHO) for key data
sources; our partners and collaborators in Argentina, Brazil, Bolivia, Chile, Colombia, Cuba, the
Dominican Republic, Ecuador, Egypt, Honduras, Israel, Japan, Malaysia, Mexico, Moldova, Panama, Peru,
the Philippines, Russia, Serbia, South Korea, Turkey, and Ukraine for their support and expert advice;
and to the tireless data collection and collation efforts of individuals and institutions throughout the
world.
In addition, we wish to express our gratitude for efforts to collect social distancing policy information in
Latin America to University of Miami Institute for Advanced Study of the Americas (Felicia Knaul,
Michael Touchton), with data published here: http://observcovid.miami.edu/; Fundación Mexicana para
la Salud (Héctor Arreola-Ornelas) with support from the GDS Services International: Tómatelo a Pecho
A.C.; and Centro de Investigaciones en Ciencias de la Salud, Universidad Anáhuac (Héctor Arreola-
Ornelas); Lab on Research, Ethics, Aging and Community-Health at Tufts University (REACH Lab) and the
University of Miami Institute for Advanced Study of the Americas (Thalia Porteny).
Further, IHME is grateful to the Microsoft AI for Health program for their support in hosting our COVID-
19 data visualizations on the Azure Cloud. We would like to also extend a warm thank you to the many
others who have made our COVID-19 estimation efforts possible.
For all COVID-19 resources at IHME, visit http://www.healthdata.org/covid.
Questions? Requests? Feedback? Please contact us here.You can also read


