Comment on "Analysis of hospital traffic and search engine data in Wuhan China indicates early disease activity in the Fall of 2019" - Institut ...
←
→
Page content transcription
If your browser does not render page correctly, please read the page content below
Comment on
“Analysis of hospital traffic and search engine data in Wuhan
  China indicates early disease activity in the Fall of 2019”
                                    by Nsoesie et al.
                                           Hao Chen∗
                      Institut für Numerische und Angewandte Mathematik,
                          Georg-August-Universität Göttingen, Germany.

                                           Ziming Du
                       Department of Stem Cell and Regenerative Biology,
                             Harvard University, Cambridge, USA.

                                            Yu Kang
                               College of Pharmaceutical Sciences,
                         Zhejiang University, Hangzhou, Zhejiang, China.

                                          Zhenyu Lin
                    Cancer Center, Union Hospital, Tongji Medical College,
                 Huazhong University of Science and Technology, Wuhan, China.

                                          William Ma∗
                      Department of Statistics, University of Virginia, USA

                                             Abstract
           In a recent manuscript, Nsoesie et al. analysed vehicle counts in hospital parking
       lots and internet search trends, and suggested that the COVID-19 outbreak might
       have started in Wuhan, China as early as August 2019. This claim received widespread
       media coverage despite the lack of validation from peers. This review serves as a pre-
       publication evaluation of the study. We identify several problems, even questionable
       research practices, including but not limited to: inappropriate and insufficient data,
       misuse and misinterpretation of statistical methods, and cherry-picking internet search
       terms. We also reflect on scientific publishing in a time of public emergency.
 ∗
     Corresponding authors: H. Chen hao.chen.math@gmail.com, W. Ma zm9d@virginia.edu

                                                 1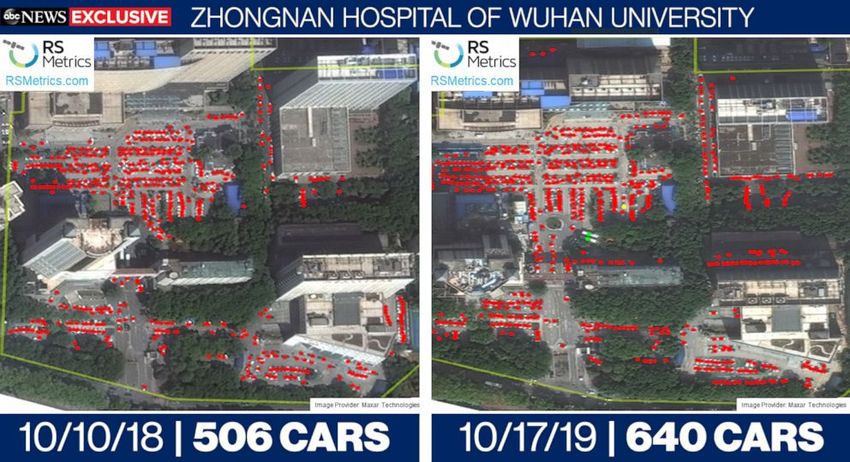
If you torture the data long enough, it
                                                             will confess to anything.

                                                                                    Ronald H. Coase

1       Background
The manuscript under review [1] applies digital epidemiology to determine the time of
the initial outbreak of the ongoing COVID-19 pandemic caused by a novel coronavirus,
SARS-CoV-2. The authors obtained vehicle counts extracted from satellite images of
hospital parking lots and Baidu search trends of two symptoms related to COVID-19. In
both datasets, they observe an increase in August 2019, leading the authors to suggest an
outbreak of COVID-19 much earlier than the first documented case on 1 December 2019 [2].
    The study is posted to DASH, a repository for researchers related to Harvard Univer-
sity.1 At the time of preparing this review, this manuscript is featured at the top of “trending
works” of DASH. Indeed, the study attracted widespread media coverage (e.g. [3]), even
political attention, partly thanks to the self-promotion of some of the authors through
social media.
    There is no doubt that the manuscript has gained its popularity, and its authority might
never be questioned outside the academic community. However, the merit of an academic
paper can only be established through peer reviews, that is, careful evaluations by people
with related expertise.
    With our expertise in mathematics, statistics, and medical sciences, we consider it
our duty to prepare the following review for the methods and results of the manuscript.
This would hardly affect the popularity of the study, but we seek to leave a record in the
literature for future reference.
    Our review may overlap with some remarks made in social media and mainstream media
(e.g. [4]). We did consult the media and participated in discussions on social media. But in
this review, we only include arguments that can be solidified to meet the academic standard.
On the other hand, our original analysis involves advanced statistics. We make effort to
simplify our explanation to reach a broader audience.
    1
   The full record once contained the entry “dc.description.version: Accepted Manuscript”. It is later
updated to “Author’s original”.

                                                  2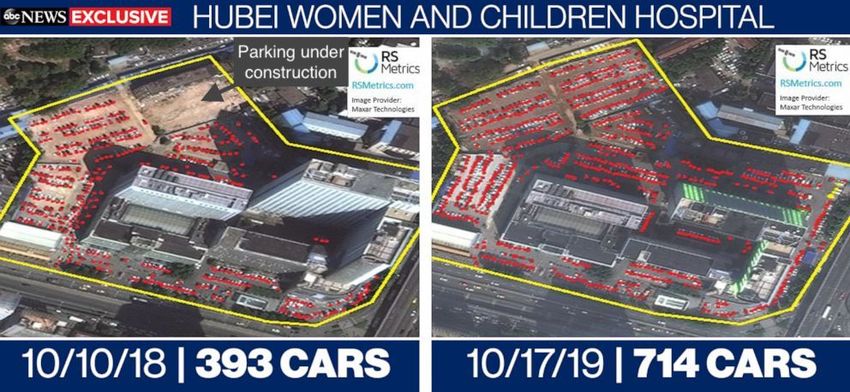
2 Satellite imagery
The authors selected six hospitals for their study. They claim to have excluded “sub-specialty
hospitals” such as Wuhan Asias Heart. But they curiously included “Hubei Women and
Children’s Hospital” (湖北省妇女儿童医院), better known as “Hubei Maternity and Child
Health Care Hospital” (湖北省妇幼保健院). This hospital is specialized in gynecology,
obstetrics, and pediatrics, but has no pneumology for adults. It is not a logical choice for
patients who develop COVID-19 related symptoms. The traffic volume at its parking lot
might be more sensitive to seasonal children diseases, such as children diarrhea caused by
rotavirus in the peak seasons of autumn and winter [5].
Satellite images of the hospitals were obtained from the company Remote Sensing
Metrics (RS Metrics). The company also delineated parking lots and streets by automated
feature extraction, then identified and counted the cars. The authors claim that (word by
word)
“Images with tree cover, building shadow, construction and other factors that
present difficulties in defining the contours were excluded since this could lead
to over- or under-counting of the number of vehicles.”
The authors did not publish the original images and data, apart from five figures as examples.
This makes it impossible to check their counts. But this is understandable, as the amount
of data could be very large.
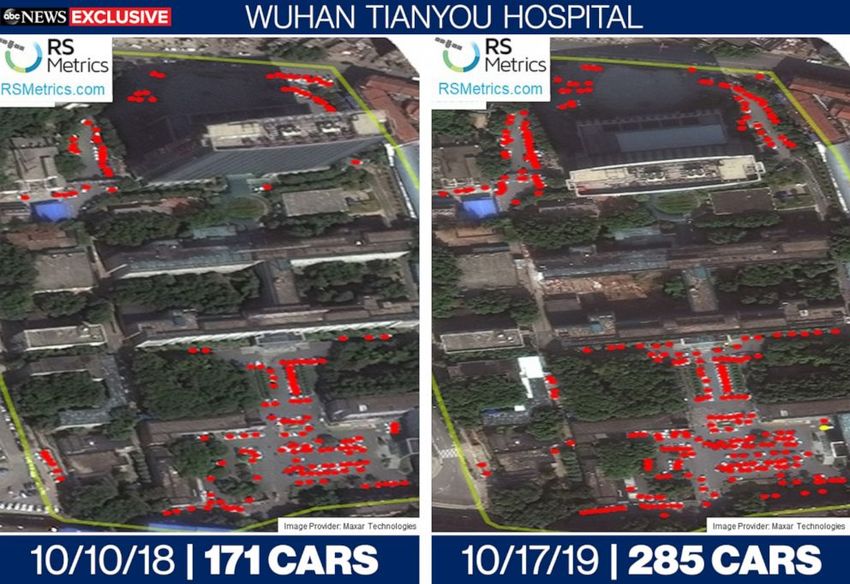
A problem arises, however, from the media coverage of the study. The news report
of the American Broadcasting Company (ABC) [3] uses several images with tree covers,
building shadows, and constructions; see Figure 1. These images, also bearing the logo of
RS Metrics, should have been excluded by the authors. In fact, the flawed images only
exemplify how these elements could lead to extremely inaccurate counts, as the authors
warn in the manuscript. Even worse, the photos are clearly taken from different angles.
Some invisible areas in the 2018 photos become visible in the 2019 photos, making the
count even more misleading. The captions of the flawed images make it clear that they were
“provided to ABC”. It is not clear if they were provided by the authors or by RS Metric.
We suggest the authors clarify that the images were not provided by them and are not
used in their analysis. In particular, they need to explain how they handled the parking lot
of “Hubei Women and Children’s Hospital” that was under construction near the end of
2018, as annotated on the left of the top panel of Figure 1.
For the sake of this review, we assume no wrongdoing on the part of the authors.
3
Figure 1: Images used in the ABC coverage of the study [3]. One clearly sees tree covers, building shadows,
and even a construction site (annotated on the left of the top panel). They should have been excluded
from the study, as the authors claim. Many areas covered by obstacles in the 2018 photos become visible in
the 2019 photos, leading to inaccurate and misleading counts.

                                                    4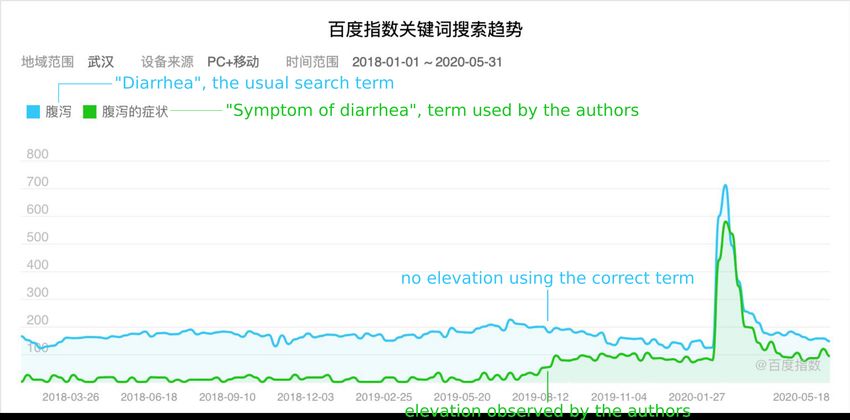
3    Analysis of vehicle count
The dataset of vehicle counts is of very poor quality. In a period of more than two years,
from January 2018 to early April 2020, we count 7, 8, 10, 23, 24, and 37 data points,
respectively, for the six hospitals from Figure 2(a) of the paper. Note that “Hubei Women
and Children’s Hospital”, a specialty hospital not quite related to COVID-19, contributes
24 data points. The data points are not uniformly distributed, not only among the hospitals,
but also in time. About 30 data points accumulate after April 2020, as shown in Figure 2a.
    Nevertheless, the authors decide to draw a smooth curve from the scatterplot using
a local regression (LOESS), which usually requires a large, densely sampled dataset to
produce good results. They then observe “a steep increase in volume starting in August
2019 and culminating with a peak in December 2019” from the LOESS curve.
    Validation and tests are essential for statistical analysis, as should have been taught
to everyone who deals with data. The authors claim to have used “high traffic areas
including the Huanan Seafood Market and two railway stations (Wuchang and Hankou) for
validation”, but did not give any detail.
    To illustrate the problem of the authors’ practice, let us make the following observation
on the LOESS curve: There is a very steep decrease in volume starting in December 2019
and culminating with a valley in February 2020. Following the analysis of the authors,
we may suggest that there has been a trend of social distancing starting as early as 1st
December 2019. See Figure 2a.
    This, however, does not match reality. The outbreak went unnoticed until the end of
December 2019 [6], and a new coronavirus was identified as the cause only in early January
2020 [7]. The local government did not implement the public health lockdown until 23
January 2020 [8]. In fact, before smoothing, the data points clearly show a sudden drop in
traffic volume on this date; see Figure 2a.
     The problem here is the use of the smoothing method and the interpretation of the
smoothed curve.
     LOESS [9] is one of many methods that generate a smooth curve from scattered data.
It is a non-parametric regression, as one does not need to specify a function of any form to
fit the data. This is both an advantage and a disadvantage, depending on the situation. On
the bright side, LOESS is very flexible when there is no theoretical model. However, LOESS
may distort the data in several ways. In the case of a peak or valley, for example, a LOESS
smoothing will decrease its height or depth but increase its width. This phenomenon is

                                             5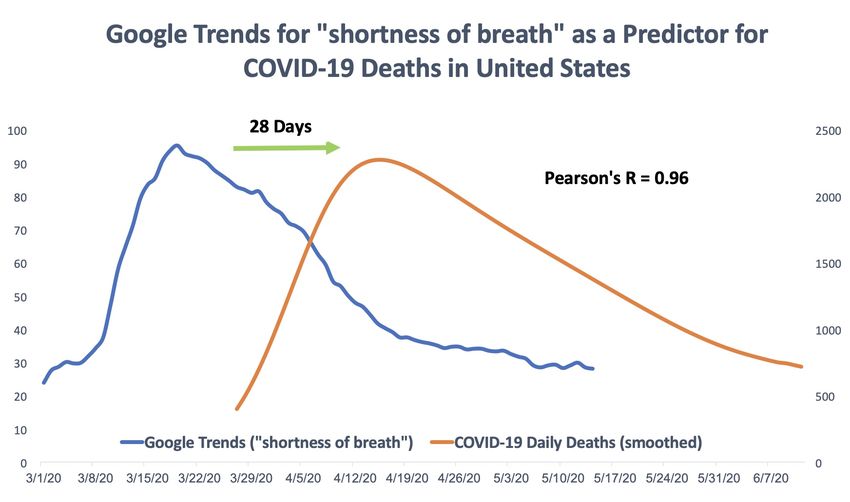
Figure 2: LOESS smoothing results. a. The LOESS curve (α = 40%) given in the manuscript. We point
out that the data is not uniform in time, that the LOESS curve suggests an earlier decrease of volume that
does not match reality, and that there are outliers to which the LOESS method is sensible. b. Reproduction
of the curve using extracted data points. c. LOESS curve with α = 30% reveals two more peaks. d. LOESS
curve with α = 80%, default value for the geom smooth function in the ggplot2 package, has no peak at
the end of 2019.

                                                    6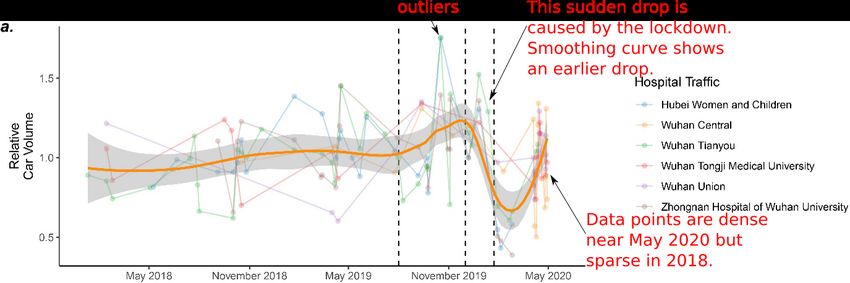
demonstrated above by the lockdown valley. Moreover, the LOESS curve is very sensitive
to outliers. This is the case in the dataset under discussion (see Figure 2a). Note that one
outlier is contributed by “Hubei Women and Children’s Hospital”, possibly caused by a
seasonal children disease. Thus, the LOESS smoothed curve is merely an indicator of a
trend, but never a measurement of the starting point of a peak or valley, as the authors
seem to believe.
     The LOESS method has two parameters: The degree of the polynomial used to locally
fit the data, and the span parameter α, which can be understood as the size of the window
within which the curve is locally estimated. Tuning these parameters is crucial for the
quality of analysis: If the degree is small or the span parameter is too big, the data will
be over-smoothed and important features will be erased. If the degree is too big or the
span parameter is too small, the curve will not be smooth enough to reveal any trend. The
authors used a span parameter α = 40% and appear to have used degree 1.
     To check the authors’ analysis, we use WebPlotDigitizer [10], a tool also used by the
authors, to extract data from Figure 2a of the manuscript. The extraction is successful for
data until early April 2020; data points afterward are too dense to distinguish from each
other. The extracted data allow us to reproduce Figure 2a of the manuscript using the
geom smooth function in the ggplot2 package of R [11]; see Figure 2b. We conjecture that
the authors used the same function in the same package.
     However, if we change the span parameter, the smoothing curve becomes very different.
With α = 30% (see Figure 2c), we observe two new peaks, one at the end of 2018, the other
in the middle of 2019. They make the peak at the end of 2019 much less significant. These
two peaks were not present in the LOESS curve with α = 40%, as the window is just large
enough to smooth them out. With α = 80% (see Figure 2d), apparently the default span
value of geom smooth, the peak at the end of 2019 is also smoothed out. We thus think
that the authors are obliged to justify their choice of 40% span over other values, if not for
their convenience.
   In conclusion, the authors chose a smoothing method without justification, selected
smoothing parameters without justification, misused the method on data of insufficient
quantity and quality, and then over-interpreted the smoothing curve without any validation.

                                              7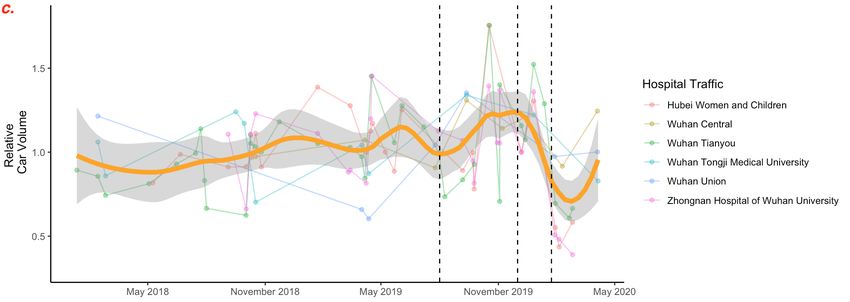
4     Baidu search trends
The authors obtained search volumes of the terms “cough” and “diarrhea” from the database
of Baidu (http://index.baidu.com), the primary search engine in China, and observed
“elevated levels of Baidu search queries” for these keywords. The search trend for the
keyword “cough” coincides with yearly influenza seasons; hence the authors emphasize
the keyword “diarrhea” which, according to the authors, is “a more COVID-19 specific
symptom”. The plot shows that the search trend for “diarrhea” is elevated since August
2019.
   We failed to reproduce these data from Baidu’s database using the Chinese words 腹泻
or 拉肚子, both translate to “diarrhea”. In response to our inquiry, the authors revealed
that the actual Chinese term they used was 腹泻的症状, which translates to “symptom of
diarrhea”.
    This should raise an alarm for several reasons.

    • The authors did not report the exact Chinese keywords they used for the search trend.
      As a search term, “symptom of diarrhea” sounds strange to the ear of native Chinese
      speakers. Baidu’s search trends also confirm that “diarrhea” is usually a much more
      used keyword; see Figure 3 (top).

    • The most common symptoms of COVID-19 reported from China were fever (88.7%
      during hospitalization) and cough (67.8%), while diarrhea was uncommon (3.8%) [12].
      According to a large-scale study in the UK [13], diarrhea is only the 7th most common
      symptom of COVID-19, behind cough, fever, shortness of breath, fatigue, confusion
      and cough (sputum).

    • The observation of the authors cannot be reproduced by usual Chinese words for
     “diarrhea” (see Figure 3 top), nor by other terms such as “short of breath” or “difficulty
      breathing” (see Figure 3 middle, also [4]).

    • Unfortunately, even the search term “symptom of diarrhea” does not support the
      authors’ claim. The elevation in August 2019 is not unique for Wuhan but nationwide
      observed in China. See Figure 3 (bottom).

   In conclusion, the authors failed to justify their choice of the keyword “diarrhea”, did not
use the correct Chinese translation, and did not check more keywords, nor the nationwide
trend, to validate their claim. This can only be described as cherry-picking.

                                               8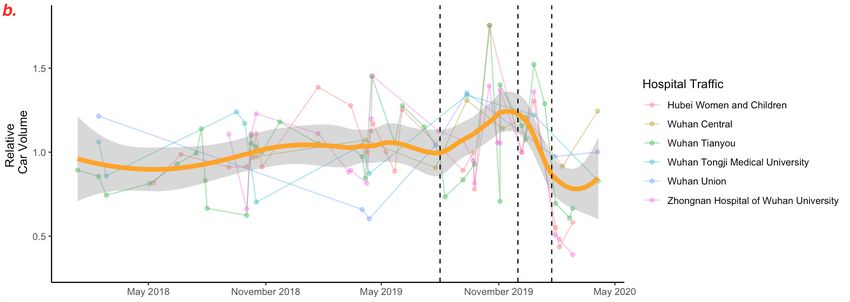
Figure 3: Baidu search trends. Top: The usual translation for “diarrhea”, 腹泻, shows no elevation as
claimed by the authors. It turns out that the authors used the keyword 腹泻的症状, which translates to
“symptom of diarrhea”. Middle: No elevation is observed before January 2020 in the trend of 呼吸困难
(difficulty breathing) or 气短 (shortness of breath). Bottom: The elevation in the trend of 腹泻的症状
(symptom of diarrhea) is more visible in the nationwide trend, showing that the trend is not Wuhan-specific.

                                                     9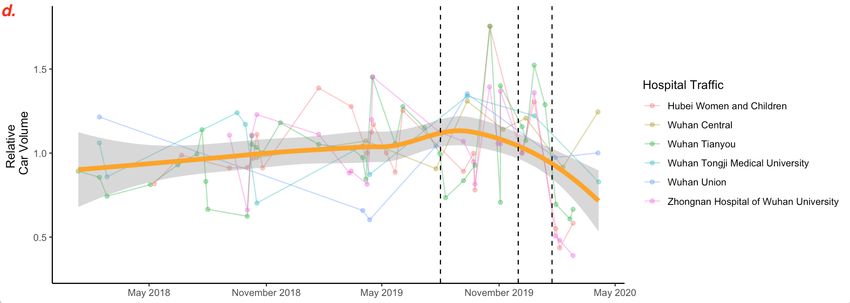
5     Internet epidemiology done right
The idea of using internet search trends to monitor infectious diseases is certainly interesting
and deserves more attention. In fact, there has been a successful application of digital
epidemiology in the COVID-19 pandemic [14]: A recent study by Wang et al. used WeChat,
the largest social media in China, to detect and track the COVID-19 outbreak in China.
Instead of a few cherry-picked terms, Wang et al. made an extensive list of keywords related
to the COVID-19 disease, including “SARS”, “Feidian” (非典, abbreviated Chinese word
for SARS), “novel coronavirus”, “coronavirus”, “fever”, “cough”, “shortness of breath”,
“fatigue”, “diarrhea”, “runny nose”, “infection”. For each of these terms, the trends were
obtained from an index of posts from the platform of WeChat, as well as an index of
searches of Baidu. The data were then analyzed and reported.
    Wang et al. crosschecked their findings with the earliest reported dates of symptom
onset and confirmed cases of COVID-19 in December 2019. It was found that the spikes in
WeChat Index closely followed the symptom onset dates for confirmed cases. In particular,
the WeChat trend for “SARS”, typically used by physicians more alerted to the situation,
spiked in the first three days of December, in coincidence with the symptom onset of the
first confirmed COVID-19 cases [2]. The trend of “Feidian”, typically used by the public,
began to rise on December 15 and stayed at a relatively high level until December 29, in
coincidence with 33 cases confirmed from 15 to 27 December 2019. These terms are more
sensitive than the symptoms of COVID-19 used in the Harvard study because, in the very
early stage of the outbreak, people did not understand the disease beyond the fact that it
is similar to SARS. There is no noticeable spike in the trend of COVID-19 related terms in
November.
     In the manuscript under review, the authors argue that “diarrhea” is a “more COVID-19
 specific symptom” as its trend “was neither seen in previous flu seasons (n)or mirrored in
 the cough search data”. This is a very weak justification for their choice of the search term.
     We now hypothesize that “shortness of breath” is a much better predictor for COVID-
19 deaths. First of all, “shortness of breath” is a much more common symptom than
“diarrhea” [13]. We obtain Google Trends for “shortness of breath” from 1 March to 15 May
2020, and observe a unique trend that was neither seen in previous flu seasons nor mirrored
 in the “cough” or “diarrhea” search data.
     To further test our hypothesis, we obtain the smoothed COVID-19 deaths data from the
 Institute for Health Metrics and Evaluation (IHME), a research institute at the University

                                              10
of Washington working in the area of global health statistics and impact evaluation. It was
found that Google Trends for “shortness of breath”, when adjusted for the 28-day time lag,
was highly correlated with the daily COVID-19 deaths in the United States, with Pearson’s
R=0.96; see Figure 4. This significant association may help guide clinical management
decisions.
We might have convinced many readers that our hypothesis sounds reasonable. However,
careful statistical analysis and validation are necessary to ensure academic rigour. As we
have no intention to extend our argument any longer in this review, we stop here and
refrain from making any premature claim.
Figure 4
6 Reflections
The ongoing COVID-19 pandemic caused by the SARS-CoV-2 virus is presenting an
unprecedented challenge to the scientific community. While researchers around the world
strive to analyze and understand the disease, fast dissemination and circulation of research
results become critical to an effective response to the public health emergency.
Many scientific journals have expedited publications of coronavirus-related submissions,
but can hardly accommodate the demand. As a consequence, many scientific manuscripts
11are made public as “preprints” without formal peer reviews [15]. This practice certainly
accelerates the exchange of knowledge among researchers, as has been observed in disciplines
that are long accustomed to preprints (e.g. mathematics and physics).
However, insufficient quality control facilitates studies of poor quality to sneak into the
public sphere [16]. At the time of preparing this review, Retraction Watch records more
than 20 retracted papers about COVID-19 [17]. These studies, intentionally or not, often
become the source of misinformation and conspiracies that harm the global effort to battle
the pandemic.
Authors of the manuscript include renowned pioneers in the new field of digital epidemi-
ology, the use of “non-traditional” data streams such as satellite images and internet search
trends for early detection of epidemics. They cited some previous works, including two
perspectives [18, 19] and a feasibility study [20], to support the validity of their method.
The study under review is a bold move to use digital epidemiology to claim an event
undetected by traditional surveillance. Unfortunately, it fails to maintain academic rigour
nor academic integrity. The authors misused statistical tools on insufficient data and
misinterpreted the result, leading to premature claims that only bring media popularity
but harm academic reputation. It is a pity that a field at such an early stage already
gets plagued by statistical fallacies. Moreover, the cherry-picking of search keywords for
internet trends is a very questionable research practice [21]. We understand that digital
epidemiology suffers from insufficient data, as the authors admit in the manuscript. This
does not justify the abuse of statistical methods and the suppression of evidence.
Before ending this review, we would like to express the following opinions in view of the
current crisis of scientific publishing:
• Preprint repositories should all implement basic moderation.
Either before or in the early stage of the COVID-19 outbreak, many repositories
(arXiv, medRxiv, ChemRxiv, etc.) implemented basic screening for plagiarisms, non-
scientific contents, and papers that potentially endangers public health [15]. ArXiv
also removes “papers in need of significant review and revision”. But this does not
seem to be the case for DASH, an institutional repository of Harvard that hosts the
manuscript under review.
• Peer-review should be possible to all manuscripts at every stage of publishing.
Traditionally, peer reviews are organized by journal editors after receiving the sub-
mission. This begins to change in recent years; services like PubPeer (https:
12//pubpeer.com/) enable peer reviews before submission or after publication. How-
ever, the manuscript under review does not have a DOI nor an arXiv ID, hence not
indexed by PubPeer. This leaves us with no other option but to write a separate
paper. It would be nice if PubPeer and similar services could cover more manuscripts,
including those posted to institutional repositories or personal websites.
• News media should stop reporting preprints as established studies.
The purpose of preprint is to gather opinions from peers, not to draw attention
from new media. Nevertheless, more and more studies are prematurely made public
through media coverage. Many preprint repositories warn that preprints “should not
be reported in news media as established information”. We think that news media
should follow this warning instead of ignore it. Moreover, media have the duty to
pass on this warning to their readers when reporting preprints.
Acknowledgement
We are grateful to the following people for reading a preliminary version of our review and
providing valuable feedback: Dr. Chenyu Jin from the University of Bayreuth, Dr. Housen
Li from the University of Göttingen, Yan Wen from the University of Chicago, Prof. Feifang
Hu from the George Washington University, Dr. Juan Qin from the University of California,
Los Angeles, Dr. Qin Li and Dr. Xiao Tong from Harvard University, Dr. Tuotuo Yu from
Central University of Finance and Economics, Dr. Qu Chen from Zhejiang University of
Science and Technology, Sha Hua from the Wall Street Journal, Juan Chen from Yicai
Global, Yanzi Deng from the South China Morning Post, Michael Anti from Caixin Globus,
Muyi Xiao from the New York Times, Wanyuan Song from BBC News, and Jennifer Zhu
Scott from Radian Partners.
References
[1] E. O. Nsoesie et al. “Analysis of hospital traffic and search engine data in Wuhan
China indicates early disease activity in the Fall of 2019” (June 2020). Available at
http://nrs.harvard.edu/urn-3:HUL.InstRepos:42669767.
[2] C. Huang et al. “Clinical features of patients infected with 2019 novel coronavirus in
Wuhan, China”. The lancet 395.10223 (2020), pp. 497–506.
13[3] K. Folmer and J. Margolin. Satellite data suggests coronavirus may have hit China
earlier: Researchers. News report, archived at http://archive.vn/yCqtr. American
Broadcasting Company (ABC). June 8, 2020.
[4] C. Giles, B. Strick, and W. Song. Coronavirus: Fact-checking claims it might have
started in August 2019. News report, archived at http://archive.vn/JyW3f. British
Broadcasting Corporation (BBC). June 15, 2020.
[5] M. Zeng et al. “Epidemiological surveillance of norovirus and rotavirus diarrhea
among outpatient children in five metropolitan cities”. Zhonghua er ke za zhi=
Chinese journal of pediatrics 48.8 (2010), pp. 564–570.
[6] Pneumonia of unknown cause – China. Archived at http://archive.vn/E67Z7.
World Health Organization (WHO). Jan. 5, 2020.
[7] F. Wu et al. “Severe acute respiratory syndrome coronavirus 2 isolate Wuhan-Hu-1,
complete genome”. Nature 579.7798 (2020), pp. 265–269.
[8] 武汉市新型冠状病毒感染的肺炎疫情防控指挥部. 武汉市新型冠状病毒感染的肺炎
疫情防控指挥部通告(第1号). Chinese. Archived at http://archive.vn/adCPm.
Jan. 23, 2020.
[9] C. Loader. Local regression and likelihood. Springer Science & Business Media, 2006.
[10] A. Rohatgi. WebPlotDigitizer. Version 4.2. Apr. 2019. url: https://automeris.
io/WebPlotDigitizer.
[11] H. Wickham. ggplot2: Elegant Graphics for Data Analysis. Springer-Verlag New York,
2016. isbn: 978-3-319-24277-4. url: https://ggplot2.tidyverse.org.
[12] W.-J. Guan et al. “Clinical characteristics of coronavirus disease 2019 in China”.
New England journal of medicine 382.18 (2020), pp. 1708–1720.
[13] A. B. Docherty et al. “Features of 16,749 hospitalised UK patients with COVID-19
using the ISARIC WHO Clinical Characterisation Protocol”. medRxiv (2020). doi:
10.1101/2020.04.23.20076042. eprint: https://www.medrxiv.org/content/
early/2020/04/28/2020.04.23.20076042.full.pdf.
[14] W. Wang et al. “WeChat, a Chinese social media, may early detect the SARS-CoV-2
outbreak in 2019”. medRxiv (2020). doi: 10.1101/2020.02.24.20026682. eprint:
https://www.medrxiv.org/content/early/2020/02/26/2020.02.24.20026682.
full.pdf.
14[15] D. Kwon. “How swamped preprint servers are blocking bad coronavirus research.”
Nature (2020).
[16] R. J. Dinis-Oliveira. “COVID-19 research: pandemic versus “paperdemic”, integrity,
values and risks of the “speed science””. Forensic Sciences Research (2020), pp. 1–14.
[17] Retracted coronavirus (COVID-19) papers. Retraction Watch. url: https : / /
retractionwatch.com/retracted-coronavirus-covid-19-papers/.
[18] M. Salathé et al. “Influenza A (H7N9) and the importance of digital epidemiology”.
The New England Journal of Medicine 369.5 (2013), p. 401.
[19] J. S. Brownstein, C. C. Freifeld, and L. C. Madoff. “Digital disease detection–
harnessing the Web for public health surveillance”. The New England Journal of
Medicine 360.21 (2009), p. 2153.
[20] E. O. Nsoesie et al. “Monitoring disease trends using hospital traffic data from high
resolution satellite imagery: a feasibility study”. Scientific reports 5 (2015), p. 9112.
[21] V. Gewin. “Uncovering misconduct”. Nature 485.7396 (2012), pp. 137–139.
15You can also read