Argo Lite: Open-Source Interactive Graph Exploration and Visualization in Browsers - Scott Freitas
←
→
Page content transcription
If your browser does not render page correctly, please read the page content below
Argo Lite: Open-Source Interactive Graph Exploration and
                        Visualization in Browsers
     Siwei Li, Zhiyan Zhou, Anish Upadhayay, Omar Shaikh, Scott Freitas, Haekyu Park, Zijie J. Wang,
                            Susanta Routray, Matthew Hull, Duen Horng Chau
                                                Georgia Institute of Technology
                                                Atlanta, Georgia, United States
           {robertsiweili,zzhou406,aupadhayay3,oshaikh,safreita,haekyu,jayw,sroutray3,matthewhull,polo}@gatech.edu

Figure 1: Argo Lite visualizing a citation network of recent COVID-19 publications [14]. Argo Lite users can explore graphs
incrementally by adding more related papers (e.g., highly cited papers cited by or citing a paper of interest) to the visualization
[3]. Using WebGL for high-performance cross-platform graph rendering [4], Argo Lite runs in all modern web browsers
without requiring any installation.
                                                                                              ABSTRACT
                                                                                              Graph data have become increasingly common. Visualizing them
                                                                                              helps people better understand relations among entities. Unfortu-
                                                                                              nately, existing graph visualization tools are primarily designed for
Permission to make digital or hard copies of all or part of this work for personal or         single-person desktop use, offering limited support for interactive
classroom use is granted without fee provided that copies are not made or distributed
for profit or commercial advantage and that copies bear this notice and the full citation     web-based exploration and online collaborative analysis. To ad-
on the first page. Copyrights for components of this work owned by others than ACM            dress these issues, we have developed Argo Lite, a new in-browser
must be honored. Abstracting with credit is permitted. To copy otherwise, or republish,       interactive graph exploration and visualization tool. Argo Lite
to post on servers or to redistribute to lists, requires prior specific permission and/or a
fee. Request permissions from permissions@acm.org.                                            enables users to publish and share interactive graph visualizations
CIKM ’20, October 19–23, 2020, Virtual Event, Ireland                                         as URLs and embedded web widgets. Users can explore graphs
© 2020 Association for Computing Machinery.                                                   incrementally by adding more related nodes, such as highly cited
ACM ISBN 978-1-4503-6859-9/20/10. . . $15.00
https://doi.org/10.1145/3340531.3412877                                                       papers cited by or citing a paper of interest in a citation network.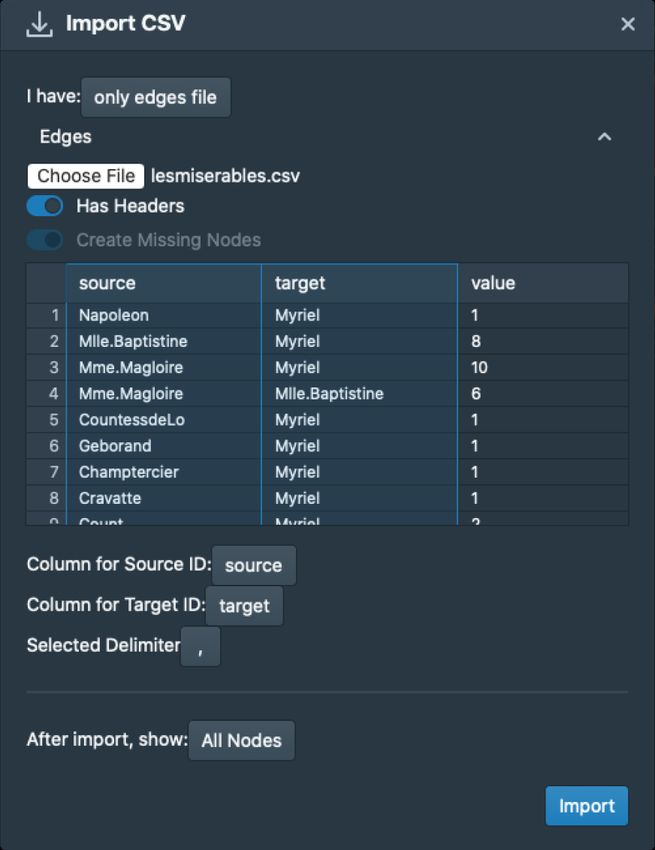
Argo Lite works across devices and platforms, leveraging WebGL                    via URL links and as embedded web widgets. Instead, tradi-
for high-performance rendering. Argo Lite has been used by over                   tional tools rely on saving files onto local file systems; users
1,000 students at Georgia Tech’s Data and Visual Analytics class.                 would need to manually pass these files back and forth among
Argo Lite may serve as a valuable open-source tool for advancing                  collaborators. Furthermore, people who wish to publish their
multiple CIKM research areas, from data presentation, to interfaces               data and visualizations need to figure out where and how to
for information systems and more.                                                 host their files; and the recipients need to download all the
                                                                                  required files and software before they can see the visualiza-
CCS CONCEPTS                                                                      tions. Such user experience is a departure from what many
• Human-centered computing → Visualization systems and                            people are now accustomed to when using modern applica-
tools.                                                                            tions like Google Docs, where users can share their documents
                                                                                  through URLs and no installation or file download is required
KEYWORDS                                                                          for viewing.
Interactive graph visualization; user interface design; network anal-
ysis                                                                        1.2     Argo Lite Novel Contributions
                                                                            We introduce Argo Lite (Figure 1), an open-source in-browser
ACM Reference Format:
Siwei Li, Zhiyan Zhou, Anish Upadhayay, Omar Shaikh, Scott Freitas,         interactive graph visualization and exploration system developed
Haekyu Park, Zijie J. Wang, Susanta Routray, Matthew Hull, Duen Horng       using the latest web technologies. Our main contributions are:
Chau. 2020. Argo Lite: Open-Source Interactive Graph Exploration and        1. Easy-to-access platform-agnostic web application. Argo
Visualization in Browsers. In Proceedings of the 29th ACM International
                                                                               Lite is a web application that runs on all modern browsers
Conference on Information and Knowledge Management (CIKM ’20), Octo-
ber 19–23, 2020, Virtual Event, Ireland. ACM, New York, NY, USA, 6 pages.
                                                                               (Chrome, Firefox, Safari, Edge, etc.). Users can access Argo Lite
https://doi.org/10.1145/3340531.3412877                                        on a wide range of devices, from desktop computers, Chrome-
                                                                               books, to tablets, regardless of the operating system (C1). Argo
1     INTRODUCTION                                                             Lite is freely accessible at https://poloclub.github.io/argo-graph-
                                                                               lite. Argo Lite’s code repository and documentation are avail-
As network data become increasingly common, many software
                                                                               able at https://github.com/poloclub/argo-graph-lite.
tools have been developed to help researchers better understand
them and uncover insights. Tools such as Gephi [1] and Cytoscape            2. Fast graph rendering via WebGL. Argo Lite takes advan-
[13] use visualizations to help reveal the relationship among entities.        tage of the WebGL technology to drastically improve graph
However, existing graph visualization and exploration tools face a             rendering performance in web browsers (C2). Prior systems
variety of challenges that limit their availability, interactivity and         such as Cytoscape Web [10] use Adobe Flash, now a deprecated
collaboration productivity.                                                    technology for interactive content for the Web. Most web-based
                                                                               visualization libraries today use D3 [2] and render graph using
1.1    Challenges of Existing Systems                                          either Scalable Vector Graphics (SVG) or HTML Canvas Elements.
C1. Availability Device, platform and OS constraints. Existing                 The rendering performance, measured by frame rate per second
    graph visualization tools are typically built for desktop use              (FPS), starts to deteriorate significantly at a low hundreds of
    only [1, 3, 13], making them difficult to access via the Web or on         nodes and edges [4]. Argo Lite uses WebGL to render graphs,
    mobile devices, such as tablets and Chromebooks. They require              which leverages hardware acceleration and is supported by all
    heavyweight installation processes and are only available on               modern web browsers. Argo Lite smoothly renders hundreds
    certain operating systems.                                                 of nodes and edges with interactive force-directed layout on
                                                                               commodity devices (e.g., laptops, tablets).
C2. Interactivity Lack of fast interactive web visualization.
    While research has shown that interactive visualizations can            3. Sharing interactive graph visualizations via links and em-
    help users more easily and rapidly make sense of graph data [3],           bedded widgets. Argo Lite allows users to share interactive
    it has been challenging to support interactive explorable graph            graph visualizations as a URL or embedded web widget based on
    visualizations on the Web. Currently, people who wish to pub-              iframe. Users can publish their interactive graph visualizations
    lish graph visualizations in digital formats—such as in online             on their web articles, blog posts or even interactive notebooks
    articles, blog posts, or via Jupyter Notebooks—are often limited           (such as a Jupyter Notebook). Readers can explore the same
    to using static images. To provide interactivity, researchers              interactive visualization directly through the embedded web
    often resort to writing custom JavaScript-based visualizations             widget, without the need to install any software or to download
    using libraries such as D3 [2], which requires complex engi-               any file (C1, C3). Researchers can easily generate a link1 for
    neering efforts; furthermore, the resulting visualizations may             their new visualization or exploration “snapshot.” Sharing the
    not scale beyond a few hundred nodes [4].                                  link with collaborators would allow them to access, modify, and
                                                                               continue their explorations on this graph data. This greatly facil-
C3. Collaboration Productivity Difficulty to share and collab-                 itates collaboration within teams and among graph and network
    orate. Graph visualization tools have traditionally been built             researchers (C3).
    as single-user software [5, 7, 12]. They lack modern collabora-
    tion features, such as saving progress “in the cloud,” or sharing       1 https://poloclub.github.io/argo-graph-lite/#6c0d8aaa-5320-4c81-9618-11ea5e0524f4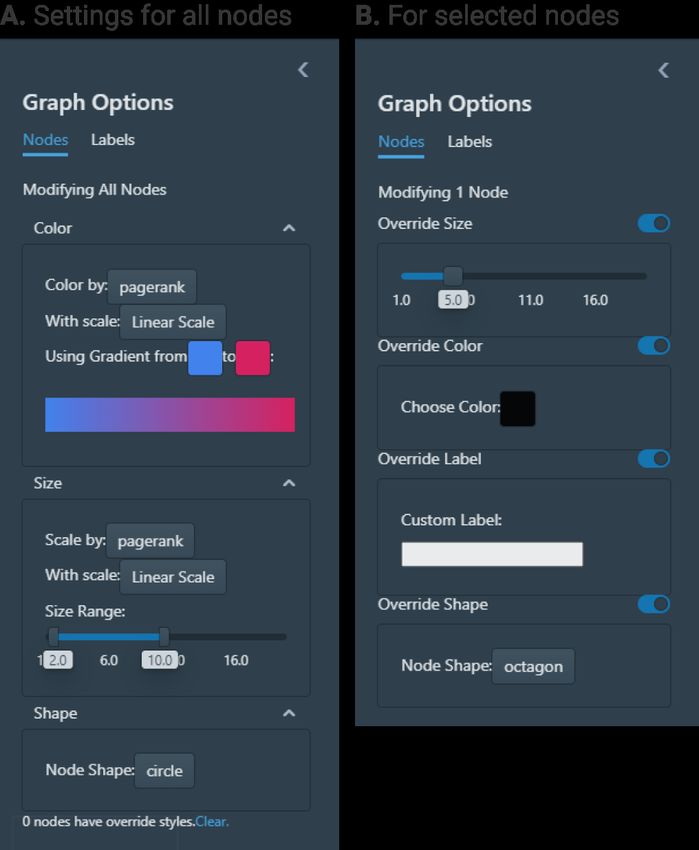
4. Broadening impact of graph analysis. Argo Lite provides
an easy-to-use experience that helps make the study of graph
data more impactful. It is designed not just for experts, but brings
interactive graph visualization to a wider audience.
Argo Lite has been successfully used by over 1,000 students at
Georgia Tech’s Data and Visual Analytics class, where students
have used the force-directed layout, sizing, coloring and labeling
features to produce different visualizations and then shared them
as URLs using the snapshot sharing feature.
To help researchers get started, we have provided several sample
graph datasets, including the real-world citation graph of recent
COVID-19 publications (Figure 1) derived from the CORD-19
Open Research Dataset [14]. Because the dataset includes papers
from many disciplines (e.g., biomedical, mathematical modeling,
machine learning), not all papers are strongly related to every
user’s research interest. To support more personalized use of
the dataset, Argo Lite allows users to easily hide papers less
relevant to their interests, and enables them to incrementally
add more related papers as they expand their exploration (e.g.,
add highly cited papers of a paper of interest). Users can also
easily share the exploration subgraph results as a graph snapshot
URL. We believe the impact of Argo Lite will grow all the
more, and empower more users to benefit from interactive graph
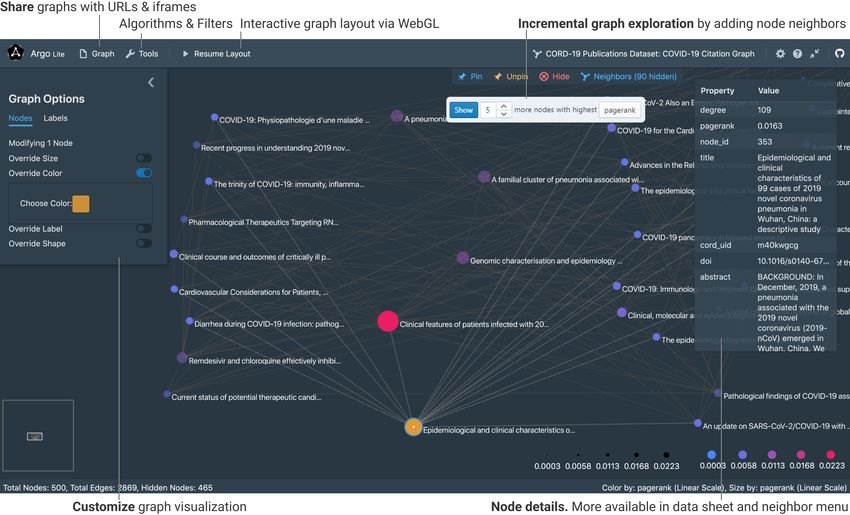
visualization. Figure 2: Argo Lite helps user import graph from CSV/TSV
and GEXF formats. Users can upload and preview the con-
2 ARGO LITE: FEATURE HIGHLIGHT tents of CSV/TSV files in tabular format, select columns to
2.1 In-browser and Cross-platform import (e.g., as node IDs) and set additional import options,
making it easy to work on graph data from different sources.
Argo Lite is a web application that runs on modern browsers
and operating systems. It runs on popular web browsers such as
Chrome, Firefox, Safari, and Edge, which are available on Windows,
Mac OSX, Linux, Android and iOS devices. Since it does not require specific nodes they choose by overriding the nodes’ size, color and
OS-level installation, users can also run Argo Lite on tablets and labels (Figure 3B).
Chromebooks. Argo Lite has complete support for both mouse and
touchscreen interactions, with optional keyboard shortcuts. 2.4 Incremental Exploration
For larger graphs with more than a few thousands of nodes and
2.2 Importing Graphs edges, visualizing the full graph all at once can result in a mas-
Argo Lite allows user to import graph data from CSV (comma- sive “hair ball” with numerous edge crossings that would visually
separated values) and TSV (tab-separated values) files, as well as the overwhelm the users and make it hard for them to begin their analy-
popular GEXF format [1]. It provides a convenient dialog for users sis [3]. To reduce such visual complexity, Argo Lite allows users to
to specify import options and preview the imported data in a tabular incrementally explore the graph by starting with a small number of
format (Figure 2). Users only need to import the data once. From high-PageRank or high-degree nodes [3]. Users are able to use the
then on, they can work on the data, save graph visualization results Neighbor menu or right-click menu to incrementally add neighbor
and share them as Argo Lite graph snapshots (Section 2.6) without nodes to the graph. The Neighbor menu helps users to identify and
the need to re-import the data. Argo Lite provides the option for add important neighbor nodes, either by PageRank scores or other
displaying the whole graph after the import, which is appropriate node attributes (Figure 4).
for smaller graphs. For larger graphs, Argo Lite provides an option In addition to the Neighbor menu, Argo Lite also provides a Data
for showing the subgraph with the highest PageRank [11] scores; Sheet (via Tools menu) that displays all the nodes in the imported
this serves as a good starting point, as the visual complexity created data, giving users the options to inspect and sort them by node
by the many overlapping edges may overwhelm users [3]. attributes, and to start their exploration from specific nodes of
interest.
2.3 Visualization
Argo Lite provides a variety of built-in helpful features for graph 2.5 Graph Statistics and Algorithms
visualization, including force-directed graph layout [6], sizing and Argo Lite not only computes PageRank scores [11] and degrees
coloring by PageRank [11], degree and other user-specified proper- for visualization, but also provides easy access to many other com-
ties (Figure 3A). Users can also customize the visualization of any mon graph algorithms that help summarize graphs [9], including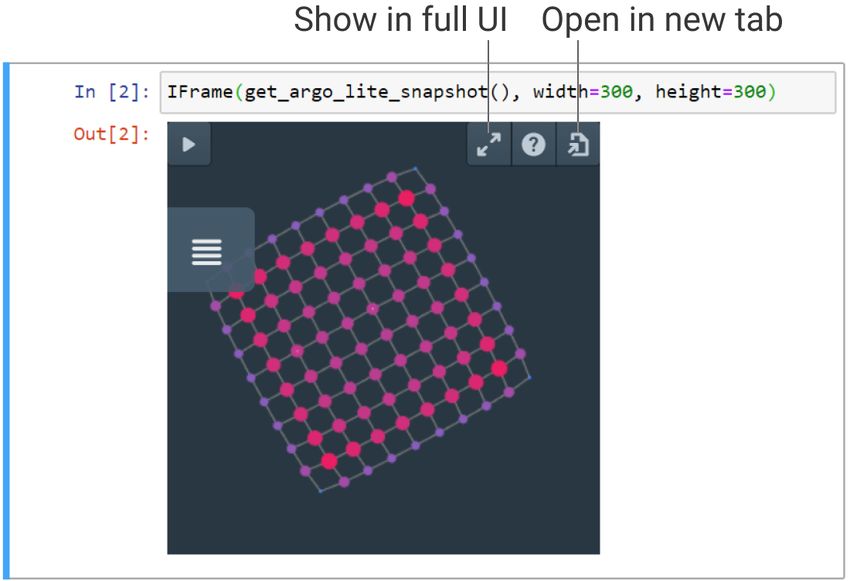
Figure 4: The Neighbor Menu helps user to identify impor-
                                                                         tant neighboring nodes of any node selected by the user,
                                                                         and incrementally add them to the visualization. Users can
                                                                         choose to add a set number of neighboring nodes with top
                                                                         PageRank or degree values to quickly navigate the graph, or
                                                                         they can browse the sortable neighbor table to individually
                                                                         pick nodes of interest.
Figure 3: Users have full control over node colors, sizes,
shapes and labels. Users can use the global settings to color
and size all the nodes by their attributes such as degree and
PageRank, or use individual settings to override the style of            up their own preferred backend server for sharing sensitive data
a node. The diverse options help users more easily create                and exploration results. As part of Argo Lite’s documentation,
meaningful and informative visualizations.                               we have provided a guide for users to optionally set up their own
                                                                         sharing servers and configure access control mechanisms.
graph density, graph diameter, clustering coefficient and connected
components (all available through the Tools menu).                       2.8    Embedding into Web Pages
                                                                         When writing a blog post, sharing a graph dataset online, or work-
2.6    Saving graph visualization as snapshots                           ing on an interactive notebook such as a Jupyter Notebook, it is
Users can save their work as graph snapshots, which are JSON             useful to embed a graph in an interactive graph visualization viewer,
documents that store the full original graph data (e.g., nodes, edges,   such that the audience may easily engage in exploring the data
attributes) along with the Argo Lite visualization and exploration       themselves. Argo Lite provides an embedded widget based on
state (e.g., node visibility, positions, colors). Users can save such    HTML iframe that allows users to easily embed any shared graph
graph snapshots as files locally, or use the sharing function to save    snapshots (Figure 6) onto HTML-based documents. Users can view
the snapshot “on the cloud” which will be described next.                and interact with the shared graphs within a webpage or (Jupyter)

2.7    Saving & sharing graph snapshots as URLs
When using a web application, it is useful for users to store their
data “on the cloud,” and to share them with collaborators as URL
links, eliminating the need to download or upload files from local
file systems, similar to what many users may be accustomed to
when using modern collaboration tools like Google Docs. Argo
Lite supports such convenient usage and sharing experiences. It
allows users to save graph snapshots (as described in Section 2.6)
containing both graph data and visualization states on a backend
server and share them as URLs (Figure 5). Users can continue their
exploration from a graph snapshot URL, without having to save
the snapshot on local disk. We have set up a public server that          Figure 5: Argo Lite allows user to save and share graph
everyone can use for free for public data. Users can also easily set     snapshots via URL links, simplifying collaboration.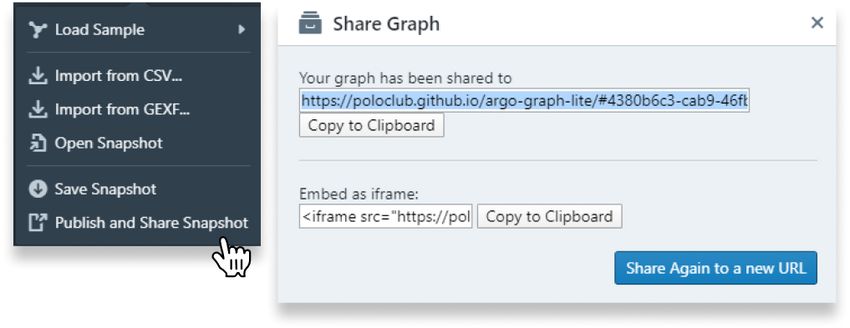
the users who need to deploy their servers and implement custom
                                                                      access control policies.

                                                                      4 AVAILABILITY AND UTILITY
                                                                      4.1 Open Source Code and License
                                                                      Argo Lite is completely open source, with source code and docu-
                                                                      mentation available at the Github repository https://github.com/
                                                                      poloclub/argo-graph-lite. The code is licensed under the permissive
                                                                      MIT license, freely available to everyone.

                                                                      4.2    Documentation
                                                                      We have provided extensive documentation for using, developing
                                                                      and customizing the software. Documentation and tutorials are
                                                                      available at the GitHub repository https://github.com/poloclub/
                                                                      argo-graph-lite.
Figure 6: A Jupyter Notebook embedding an Argo Lite wid-
get. Argo Lite makes publishing interactive graph visual-             4.3    Real-world Example Graph: Citation Graph
ization on the web much easier by offering an embeddable
web widget based on iframe.
                                                                             of COVID-19 Research Publications
                                                                      Argo Lite comes with multiple example graphs available under the
                                                                      Graph menu. In addition to the classic example Les Misérables char-
notebook. Users can expand the embedded widget into the full-         acter graph [8], which visualizes the interactions between major
featured Argo Lite interface within the iframe, or open the graph     characters in the Les Misérables novel, Argo Lite also provides the
snapshot in a new browser window or tab.                              real-world citation graph of recent COVID-19 publications derived
                                                                      from the CORD-19 Open Research Dataset [14]. In this citation
3 SYSTEM DESIGN                                                       graph (Figure 1), each node represents a published paper related to
                                                                      COVID-19, and each edge represents a citation relationship between
3.1 Web Client and User Interface                                     two papers. As our world is going through the COVID-19 health
The web UI of Argo Lite is written completely in modern JavaScript    crisis, there is a surge of research publications on this matter, with
(ES6+), using the mainstream React framework (https://reactjs.org)    researchers from diverse fields working to investigate it. Since the
and the MobX state management library (https://mobx.js.org), mak-     papers included in this dataset come from many different fields of
ing it easy to develop and maintain. On top of React, we use a        study, researchers might be interested in finding publications more
combination of Blueprint.js and custom CSS to style and animate       relevant to their interests. Argo Lite is capable of hiding irrelevant
our UI, bringing a familiar interface that new users can quickly      papers. Researchers are able to start exploration from highly cited
get used to and to ensure that our interface is reactive and mobile   papers in their specific fields of interest, and incrementally add
friendly.                                                             neighbor nodes of these publications. This helps researchers build
                                                                      subgraphs of publications tailored to their own research interests.
3.2   Efficient Rendering via WebGL
Traditional browser rendering techniques using HTML canvas or         4.4    In-class Usage at Georgia Tech
SVG do not scale well with graphs larger than a few hundred nodes     Argo Lite may be used by people without prior experience or ex-
[4]. We use WebGL, a powerful rendering solution that can take        pertise in graph visualization. It has been successfully used by more
advantage of hardware acceleration and many other optimizations.      than 1,000 students in Georgia Tech’s Data and Visual Analytics
   Argo Lite has a dedicated WebGL renderer written in vanilla        class for learning graph visualizations. Students have learned to
JavaScript with minimal dependencies. It interacts with WebGL         use force-directed layout and different sizing, coloring and label-
through the Three.js library. The renderer provides a complete set    ing options to visualize their graphs. Additionally, students shared
of APIs that work with the rest of the React application. It can be   their graph visualizations as URLs using Argo Lite’s link sharing
easily isolated and used within another application.                  functionality. Thus, we expect Argo Lite to be a resource not only
                                                                      useful for experienced researchers, but also valuable for students
3.3   Sharing Server                                                  learning about graph analysis and visualization techniques.
Argo Lite provides and hosts a free sharing server on Heroku
implemented using Node.js and the open source Strapi content          5 PREDICTED IMPACT
management system. The free sharing server allows anyone to
share their data and visualization to the public world.
                                                                      5.1 CIKM Research Activities Enabled and
   For researchers who may be working on sensitive or propri-             Enhanced
etary data, Argo Lite also works wth their own preferred backend      Argo Lite has strong potential to help advance multiple CIKM
servers. We have provided the documentation and source code for       research areas, as highlighted on CIKM’s website. Argo Lite is a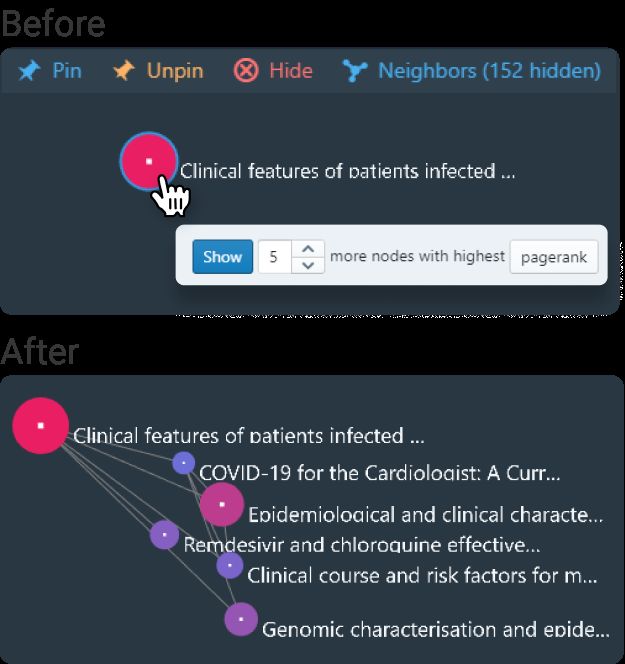
modern tool for data presentation, particularly for visualizing and      REFERENCES
exploring graphs. Argo Lite provides an easy-to-use user interface        [1] Mathieu Bastian, Sebastien Heymann, and Mathieu Jacomy. 2009. Gephi: an open
for interactive analysis, and could help users more easily explore            source software for exploring and manipulating networks. In Third international
                                                                              AAAI conference on weblogs and social media.
knowledge graphs. As demonstrated through the example citation            [2] Michael Bostock, Vadim Ogievetsky, and Jeffrey Heer. 2011. D3 Data-Driven
graph of COVID-19 publications in Section 4.3, Argo Lite may also             Documents. IEEE Transactions on Visualization and Computer Graphics 17, 12
                                                                              (Dec. 2011), 2301–2309. https://doi.org/10.1109/TVCG.2011.185
help with data integration and aggregation, assisting researchers         [3] Duen Horng Chau, Aniket Kittur, Jason I Hong, and Christos Faloutsos. 2011.
and practitioners who develop and share knowledge graphs.                     Apolo: making sense of large network data by combining rich user interaction
                                                                              and machine learning. In Proceedings of the SIGCHI conference on human factors
                                                                              in computing systems. 167–176.
                                                                          [4] Dezhi Fang, Matthew Keezer, Jacob Williams, Kshitij Kulkarni, Robert Pienta, and
5.2    Advancing Graph Visualization and                                      Duen Horng Chau. 2017. Carina: Interactive Million-Node Graph Visualization
       Exploration                                                            Using Web Browser Technologies. In Proceedings of the 26th International Confer-
                                                                              ence on World Wide Web Companion (Perth, Australia) (WWW ’17 Companion).
Graph visualization has been a well-established field growing in              International World Wide Web Conferences Steering Committee, Republic and
importance, and popular tools such as Gephi [1] and Cytoscape                 Canton of Geneva, CHE, 775–776. https://doi.org/10.1145/3041021.3054234
                                                                          [5] Scott Freitas, Hanghang Tong, Nan Cao, and Yinglong Xia. 2017. Rapid analysis of
[13] have already existed for many years. Argo Lite seeks to ad-              network connectivity. In Proceedings of the 2017 ACM on Conference on Information
vance graph visualization and exploration by bringing the power               and Knowledge Management. 2463–2466.
                                                                          [6] Thomas MJ Fruchterman and Edward M Reingold. 1991. Graph drawing by force-
of graph visualization into a modern in-browser web app available             directed placement. Software: Practice and experience 21, 11 (1991), 1129–1164.
on both desktop and mobile devices, equipped with both the clas-          [7] Jian Kang, Scott Freitas, Haichao Yu, Yinglong Xia, Nan Cao, and Hanghang
sic visualization features as well as new sharing and collaboration           Tong. 2018. X-rank: Explainable ranking in complex multi-layered networks.
                                                                              In Proceedings of the 27th ACM International Conference on Information and
features. Argo Lite addresses the challenges of existing tools in             Knowledge Management. 1959–1962.
terms of availability and interactivity, and offers a modern easy-        [8] Donald Ervin Knuth. 1993. The Stanford GraphBase: A Platform for Combinatorial
to-use experience. It is a valuable addition not only to the graph            Computing. Vol. 37. Addison-Wesley Reading.
                                                                          [9] Jure Leskovec and Rok Sosič. 2016. Snap: A general-purpose network analysis and
visualization field, but also other research areas that benefit from          graph-mining library. ACM Transactions on Intelligent Systems and Technology
graph visualizations.                                                         (TIST) 8, 1 (2016), 1–20.
                                                                         [10] Christian T Lopes, Max Franz, Farzana Kazi, Sylva L Donaldson, Quaid Morris,
                                                                              and Gary D Bader. 2010. Cytoscape Web: an interactive web-based network
                                                                              browser. Bioinformatics 26, 18 (2010), 2347–2348.
5.3    Timeline                                                          [11] Lawrence Page, Sergey Brin, Rajeev Motwani, and Terry Winograd. 1999. The
                                                                              pagerank citation ranking: Bringing order to the web. Technical Report. Stanford
We expect Argo Lite to be useful for a long time and remain                   InfoLab.
updated as an evolving open source project. We will continuously         [12] Robert Pienta, James Abello, Minsuk Kahng, and Duen Horng Chau. 2015. Scalable
maintain and improve Argo Lite and will leverage GitHub’s issue               graph exploration and visualization: Sensemaking challenges and opportunities.
                                                                              In 2015 International Conference on Big Data and Smart Computing (BIGCOMP).
board to respond to user feedback. Meanwhile, Argo Lite will also             IEEE, 271–278.
continue to be used in Georgia Tech’s Data and Visual Analytics          [13] Paul Shannon, Andrew Markiel, Owen Ozier, Nitin S Baliga, Jonathan T Wang,
class, for use by over 2,000 students every year (1,000 per semester).        Daniel Ramage, Nada Amin, Benno Schwikowski, and Trey Ideker. 2003. Cy-
                                                                              toscape: a software environment for integrated models of biomolecular interac-
   As more and more graph data are collected and made available,              tion networks. Genome research 13, 11 (2003), 2498–2504.
there’s a growing interest to visualize, explore and understand          [14] Lucy Lu Wang, Kyle Lo, Yoganand Chandrasekhar, Russell Reas, Jiangjiang Yang,
                                                                              Darrin Eide, Kathryn Funk, Rodney Michael Kinney, Ziyang Liu, William. Merrill,
graph data. We anticipate that more researchers and students will             Paul Mooney, Dewey A. Murdick, Devvret Rishi, Jerry Sheehan, Zhihong Shen,
be using Argo Lite as a convenient graph visualization and explo-             Brandon Stilson, Alex D. Wade, Kuansan Wang, Christopher Wilhelm, Boya Xie,
ration tool in the coming years.                                              Douglas M. Raymond, Daniel S. Weld, Oren Etzioni, and Sebastian Kohlmeier.
                                                                              2020. CORD-19: The Covid-19 Open Research Dataset. ArXiv abs/2004.10706
                                                                              (2020).

6     CONCLUSION AND DISCUSSION
Argo Lite is a novel open-source in-browser interactive graph
exploration and visualization tool. It enables researchers to incre-
mentally explore graph data in browser and conveniently share
their interactive visualizations via URLs and embedded widgets.
    Since Argo Lite is an in-browser tool, it does have limitations,
since browser web apps have limited memory and cannot access
file systems directly. In order for Argo Lite to be useful for even
larger graphs, such as those with millions of edges, we anticipate
future development of backend web services responsible for storing
and processing large graph files uploaded by users. These services
may be paired with a dedicated frontend based on Argo Lite for
interactive visualization and exploration. It would also be useful to
see Argo Lite being used as a common frontend integrated into
popular graph databases.
    We believe that Argo Lite is a valuable tool for both researchers
and students alike, and will continue to maintain and improve this
open-source project.
You can also read