The Virtual Exploratorium: Foundational Research and Theory on the Integration of 5-D Modeling and Visualization in Undergraduate Geoscience Education
←
→
Page content transcription
If your browser does not render page correctly, please read the page content below
Hay, K.E., Marlino, M., & Holschuh, D.R. (2000). The Virtual Exploratorium: Foundational Research and Theory on the Integration
of 5-D Modeling and Visualization in Undergraduate Geoscience Education. In B. Fishman & S. O'Connor-Divelbiss (Eds.),
Fourth International Conference of the Learning Sciences (pp. 214-220). Mahwah, NJ: Erlbaum.

                                        The Virtual Exploratorium:
                   Foundational Research and Theory on the Integration of 5-D Modeling
                        and Visualization in Undergraduate Geoscience Education
                                                 Kenneth E. Hay, Mary Marlino, Douglas R. Holschuh
                     The University of Georgia, Learning & Performance Support Laboratory, 611 Aderhold Hall, Athens, GA 30606
                                                        Tel: 706-542-4371, Fax: 706-542-4321
                                       Email: khay@coe.uga.edu, marlino@page.ucar.edu, dholschu@coe.uga.edu

                             Abstract: The Virtual Exploratorium is a collaborative development project funded by the
                             National Science Foundation to develop a theoretical and operational framework to promote high-
                             end visualization, modeling, and data in the support of education. This paper reports on the
                             theoretical framework and three research studies that have been conducted to support the
                             development of the Virtual Exploratorium.

                             Keywords: virtual reality, visualization, and science education

                   Introduction
                             Over the past decade, the challenges facing undergraduate science education have been well articulated in a
                   number of national documents (e.g., Scrutiny of Undergraduate Geoscience Education, Shaping the Future, and
                   Geoscience Education: A Recommended Strategy). These reports were prompted by the national crisis of a
                   scientifically illiterate citizenry, the rising concern about inadequate science preparation of preservice teachers, and
                   the expanding expectations of an increasingly technologically literate student population. These reports
                   recommended adopting an Earth System Science (ESS) approach for teaching the geosciences, integrating research
                   experiences into curricula, employing contemporary pedagogies, and appropriately using educational technologies.
                   Shaping the Future also called for an inquiry-based approach to science education, an emphasis on basic scientific
                   principles and their applicability to everyday life, and the experience of “doing science.”

                             We are beginning to develop a Virtual Exploratorium, an environment that promotes deeper understanding
                   through scientific exploration by exploiting recent advances in information technology. The Virtual Exploratorium
                   represents a dramatic departure from the way introductory science courses are traditionally taught. Among the
                   unique features of this approach is a learning model that reflects contemporary notions of cognition and students’
                   use of interactive models and advanced visualizations to explore and understand geoscience principles, building
                   blocks, processes, and phenomena. Through the development of curricular elements and activities, software, data
                   sets, and scientific models, we will achieve the following learning objectives:

                        1.   Provide learners with a set of inquiry-based projects and curricular elements that will enable them to
                             develop deeper contextualized understandings of the geosciences.
                        2.   Provide learners with a well-supported inquiry environment in which they can explore phenomena, develop
                             and test hypotheses, run scientific models, visualize results, and draw conclusions.
                        3.   Provide learners with opportunities to engage the “tools of practice” of scientific inquiry, which will enable
                             them to understand the roles and processes of scientific modeling and visualization in the geosciences.

                           In this paper, we will present a series of studies that form the foundation of our development efforts. These
                   include a study the specific needs of undergraduate geoscience faculty with respect to teaching, learning, and
                   technology; a study of students’ inert knowledge and alternative conceptions of El Niño and its prerequisite
                   knowledge; and a study of students’ interaction with a prototype 5-D visualization tool.

                   Community Research
                            Over the past decade, the paradigm for undergraduate teaching has shifted in focus from teacher-centered
                   to student-centered learning, with an increased emphasis on new educational technologies. Faculty interest in these
                   new learning environments has been heightened by several well-documented studies regarding their efficacy and
                   efficiency. Advances in the field of cognitive science, the subsequent implications for learning technologies, and the

                   ICLS 2000                                                          214
increased power and availability of multimedia computers have enabled the creation of fundamentally different
educational applications that embody the characteristics of natural learning.
The issues of effective educational technology integration are especially critical to the geosciences. The
technical nature of the disciplines, the unique demands of advanced scientific data, and the growing expectations of
a more technologically sophisticated student population have made it imperative that faculty employ new learning
technologies and the accompanying pedagogies.
Mounting imperatives regarding the use of technology for research and teaching have led many of the
institutions served by the University Corporation for Atmospheric Research (UCAR) to request that UCAR examine
the issues of technology integration in undergraduate education. One of the primary goals of UCAR is to support the
scientific community by creating, conducting, and coordinating projects that strengthen education and research in
the atmospheric, oceanic, and earth sciences. UCAR accomplishes this mission by building partnerships that may be
national or global in scope; the organization takes on issues and activities that require the combined and
collaborative capabilities of a broadly engaged scientific community. The Program for the Advancement of
Geosciences Education was founded in 1998 to harness these collaborative capabilities to enhance undergraduate
geoscience teaching and learning.
The development of the Virtual Exploratorium is a direct response to a series of calls by the PAGE
community to incorporate the research and technology developments of UCAR into the undergraduate arena. PAGE
has refined the community calls through the conduct of six focus groups to examine the specific needs of
undergraduate geoscience faculty with respect to teaching, learning, and technology. These focus groups, with
representatives from 38 institutions, concluded that PAGE should aim to achieve two primary goals:
1. Create an environment that nurtures development, testing, refinement, and on-line dissemination of
selected, integrative, discovery- and inquiry-based educational materials, and assessment instruments in
ESS.
2. Build a community of educators empowered – through electronic and traditional communications – to find,
use, critique, and add to these materials to advance their skills in conducting student-centered learning and
assessment, and to refine and implement the evolving ESS agenda.
Learner Research: Inert and Alternative Conceptions
Background
Introductory geoscience education can be characterized by a lecture format, which many educators have
argued concentrates on memorization of factual information and promotes the development of superficial
understandings (Roth, 1996; Roupp, Gal, Drayton, & Pfister, 1993), inert knowledge (Cognition and Technology
Group at Vanderbilt, 1993; Whitehead, 1929), and does little to correct the many alternative conceptions that
students have regarding the foundational concepts of science (Pfundt & Duit, 1998).
Method
In the fall of 1999, we conducted the second study involving semi-structured interviews consisting of 27
questions that covered a wide range of meteorology concepts typically covered in traditional introduction to climate
and meteorology courses. These questions were developed from the alternative conception research and a systematic
content analysis of El Niño, and in consultation with the atmospheric scientists on the project. There were three
categories of questions: El Niño questions, enabling questions, and intervention questions. The procedure was to
have the students answer the El Niño questions and enabling questions, work through a 10-minute tutorial, and then
answer the intervention questions.
The 19 students were recruited from an introductory course on computers in education (n = 5) and a
weather-and-climate course (n = 14). The weather-and-climate students had just completed an examination in their
course on the content of the enabling questions.
We assessed student conceptual growth by extensive viewing of the videotapes, analysis and coding of the
interviews, and scoring the student responses by a rubric. The rubric was based on the categorization scheme used
215 ICLS 2000by Simpson and Marek (1988) and Muthukrishna, Carnine, Grossen, and Miller (1993) and was modified slightly to
reflect a hierarchical developmental sequence. The rubric had five categories: (0) no conception, (1) confused, (2)
incomplete/inaccurate understanding, (3) partial understanding, and (4) complete understanding.
Findings
We are currently in the middle of our data analysis, and here in Table 1 we report means scores on tentative
analysis at this juncture.
Table 1. Tentative Analysis of Student Answers
El-Niño Qs Enabling Qs Intervention Composite
Means Means Qs Means Mean
All students (n = 19) 0.71 0.87 1.55 1.00
Education students (n = 5) 0.48 0.64 1.11 0.73
Weather students (n = 14) 0.80 0.94 1.72 1.10
We can make some general, albeit tentative, observations on the means. First and most obvious is the
observation that on average this group has a confused understanding of El Niño and the enabling weather concepts.
This would be surprising to the weather-and-climate professor we are sure, but based on the literature, it would not
be unusual. The second observation is the bump that even the 10-minute tutorial had on mean scores for the
intervention questions. A tentative explanation could be that these students are adept at taking information from an
authoritative source and incorporating it into their answers, one of the hallmarks at the lower levels of
understanding. However, the concepts presented are not part of an integrated understanding. The third observation is
the difference between the education students and the weather students. We would expect to see a more dramatic
difference on the enabling questions, because these concepts are the ones that the weather students have been
studying for 6 weeks, but we do not. This obviously paints a bleak picture of both the general nature of
undergraduate understanding of the weather and their ability to learn deep understanding from lecture formats.
We now turn to a more detailed look at two of the enabling questions: (a) what happens to hot air? and (b)
where is it hottest and coldest in the atmosphere? These were chosen because they represent the highest and lowest
mean scores of the 15 enabling questions. The hot-air question represents both the lowest score (M = 0.29) and the
most consistent response. On hearing the question, students uniformly responded, “It rises.” However, following up
the response with “Then what happens?” they uniformly answered, “I don’t know.” A relatively deep understanding
of the process of “hot air rising,” that is of adiabatic motion, is a central concept in the understanding of El Niño and
indeed a large number of weather phenomena. However, it was completely outside of these students’ understanding,
even through a question on adiabatic motion was on the examination the 14 weather students had just taken.
Finally, the question of “Where is it hottest and coldest in the atmosphere?” was interesting in terms of the
analysis of the misconceptions that interfered with students’ complete understanding of the concept. This question
was rated the highest of all the questions (M = 2.06) for the rating of incomplete/inaccurate understanding. At this
level, students’ misconceptions become a significant impediment to further, more complete understanding. Here we
report on the range of misconceptions these students had. Students effectively traversed the separation of latitude
and altitude in this question, and we report on the misconceptions in answering where it is hottest and coldest in the
atmosphere in terms of latitude. The answer to the question is that the equator is hottest and the poles are coldest,
because the earth is a sphere and the sun’s rays are less concentrated (indirect) at the poles and more concentrated
(direct) at the equator. Students most often had an understanding of indirect versus direct lighting; however, they
could not articulate why there was indirect and direct lighting. Their misconceptions focused on their personal
experience with heat:
“less daylight hours, so it is colder” [at the poles]
“closer to the sun?” [equator]
“because the earth is tilted”
“tilts toward or away from the earth”
[there is] “more of a reflection … some of light is missing the earth at poles”
“at the poles, colder because sun has to pass through more atmosphere”
ICLS 2000 216“rotation of the earth”
The students demonstrated a wide range of misconceptions that are built from personal experience (e.g.,
daylight equals warmth, closer to heat source, and heat passing through a medium) and an attempt to integrate
factual knowledge that they have acquired in previous instruction (e.g., tilt of earth, rotation, and reflection). All of
these misconceptions play an important role in the development of effective instruction on El Niño.
Modeling and Visualization Research Visualization Tools
as Learning Technologies
Clearly, the leader in the creation of visualization tools for learners has been the groundbreaking work of
the CoVis project (Pea & Gomez, 1992). The CoVis project developed both the tools and the educational framework
to take advantage of the power of visualization. In addition, they developed a strong argument of the use of
visualization tools in education. The case starts with the arguments for the benefits of scientific visualizations
themselves:
1. Making a scientific view of the world more accessible,
2. Providing a means for authentic scientific inquiry,
3. Empowering students with tools they can use in a wide variety of fields,
4. Laying groundwork to enable students to understand and critique scientific policy (Gordin & Pea, 1995).
The technology is impotent without an educational context for taking advantage of the power of the
technology. Edelson and Gordin (1998) laid out the entire context for the implementation of visualization tools.
They argued that it is essential to include the following:
1. Motivating context: Investigations that are personally meaningful.
2. Activities: The activities available to learners must be active and constructive.
3. Data selection: The data available to learners must connect to their interests.
4. Interface: The tools must be appropriate to their level of understanding.
5. Support for learning: Rich physical and computational environment.
CoVis broke the ground for the use of visualization in the education, the creation of powerful tools, and the
development of educational frameworks to take advantage of visualization for learning.
5-D Visualization Tools
Tools of practice, especially visualization tools have an exciting future in terms of supporting deep
understanding of scientific domains where there is a need for understanding of large systems, invisible phenomena,
and the ability to see interrelationships. The next step in the development of visualization is the jump into the fifth
dimension. Here we explore the rationale for the creation of 5-D visualization tools for learners. First, we will
address the case for making 5-D tools available to learners and then address the case for making 5-D visualizations
available to learners. The power of tools for learners has been around at least as long as Taylor’s (1980) famous triad
of computer uses in education: “tutor, tutee, and tool.” However, the concept of tool is often used interchangeably
with the other two terms, tutor and tutee. The concept of tool has been in the literature for some time (Hawkins &
Pea, 1987; Pea, 1985). The tool can be a powerful connection between the student the community of science. For
example, the tools of visualization give students powerful ways to look at the world in a scientific manner. Placing
powerful visualization tools in the hands of students was started with the creation of visualization databases that are
put on the Internet and incorporated into science instruction has been leading the way for visualization in science
education (CoVis, BlueSkies, etc.). Indeed much science is conducted in similar fashion – a centralized resource
generates standardized visualizations for the community at regular intervals (e.g., hourly pressure maps of U.S.
weather). This process implies that the user can interpret these standardized representations in terms of their own
questions and investigations; something that practicing scientists are facile with, whereas novices typically are not.
The opportunity to give learners a tool to engage in the practice of visualizing is a powerful idea. Empowered with a
visualization tool, learners can be embedded within the practices of scientific visualization. Learning how to use the
tools, but more importantly how to use visualizations to explore, interrogate, and think about data is central to the
opportunity that visualization tools can provide learners.
217 ICLS 2000The answer to the question of why use 5-D visualizations in education first begins with the case made on
behalf of all scientific visualizations by Gordin and Pea (1995): accessibility, inquiry, generalized tools,
understanding. Second is the argument that the weather is a 5-D phenomenon (x, y, z, time, and data set), and our
traditional paper representations require learners to fuse multiple representations into one understanding of the
atmosphere. When we give students a 5-D data set, it establishes a unified conceptual identity for the weather event,
and powerful, yet easy-to-use tools allow students to create different ways at look at the weather event. Learners
smoothly and quickly move from visualizing different variables using different visualization techniques, viewing
different angles, and viewing times. All this can be done seamlessly, that is, there are no conceptual ruptures
between perspectives that learners have to fuse together mentally; rather the tool provides for simple integrated
movements between perspectives. Third, 5-D visualizations provide the learner with a holistic view of the weather
system, so learners can see the relationships among variables that are otherwise invisible to the learners. Through
advanced display technologies, this holistic perspective can even be introduced through immersion into the data set.
For example, this allows unprecedented opportunities to “stand” in Georgia and visually experience a passing cold
front by looking at humidity and temperature.
Method
In a third study, we engaged in a study involving nine 15- and 16-year-olds and six university freshman and
sophomores enrolled in an introductory course on computers in the classroom selected through a convenience
sampling. They worked with a researcher for 50 to 70 minutes through interviews, free explorations, conducting 11
visualization tasks using a think-aloud protocol, and a debriefing interview. The sessions were videotaped and
coded. This study utilized an inductive methodology (Guba & Lincoln, 1985; Strauss & Corbin, 1990) to analyze
and code the emergent themes within learners’ think alouds around the 11 visualization tasks. To accomplish this
analysis task, we developed a research database in which we recorded (a) whether they successfully accomplished
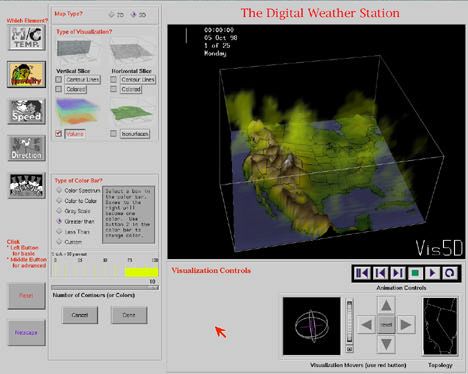
the tasks and (b) important dialogue that gave us insight into how they were using the Digital Weather Station (3) in
their thinking about the weather (see Figure 1).
Figure 1. Digital Weather Station Interface.
Findings
The full set of findings for this study was reported elsewhere (Hay, 1999). The findings included
exploration of students’ misconceptions based on 3-D visualization (white volumetric visualization are clouds, or
blue is cold and red is hot), students’ models that interfered with or supported effective visualizing, students’ ability
ICLS 2000 218to explore relationships between variables, students’ ability to decode 3-D visualizations, the types of explorations
students engaged in, and students’ insights into the value of 3-D over 2-D visualizations in understanding the
weather. Here, we report of the most exciting findings of this study: learners’ ability to engage in exploration
activities. These first-time 5-D visualizers were all able to engage in these processes without hesitation. In the
exploration activity, learners were given a 2-page printout of a WWW instructional page on hurricanes. They were
then asked to explore the data set to see if there was a hurricane. We will observe Darby as she finished reading.
Darby: OK so I am ready to start. It says that hurricanes exceed 74 KPH winds so … OK so, first
you find out how fast the wind is blowing. First, go to wind speed. [She turns off the
topography, creates a horizontal contour slice of wind speed, turns it off, creates a
horizontal colored slice of wind speed and moves it up and down through the data set.]
Darby: OK higher up in the atmosphere, there are higher winds and they look kinda … I don’t
know. OK there are really not high winds lower. [She moves the slice.]
Darby: They are really mild ones. As you get higher, there are higher ones. So, I am going to go
to another thing. I am going to go to wind direction. [She clears the visualization]
Interviewer: What do you plan to check there?
Darby: It says that in the Northern Hemisphere they [hurricanes] blow counter-clockwise. So I
am going to find out which way they are blowing. [She creates a horizontal stream slice
of the wind direction.]
Darby: This is the Northern Hemisphere. OK right here [points to a spot] the winds are blowing
clockwise, so that would not work. And then, OK right here [another spot] the winds are
blowing clockwise so that is not right either. They are all blowing clockwise. All right,
right here [points to third spot] they are blowing counter-clockwise … And so there could
be a hurricane right there … But no it couldn’t because it is a tropical storm. I don’t
know.
Interviewer: Anything else?
Darby: I don’t know enough yet. OK it says the temps have to be 80 degrees … [She clears the
visualization, creates a vertical colored slice for temperature, turns it off, and then creates
a horizontal colored slice for temperature.]
Darby: I am going to find out what the temp is. [She moves the slice.]
Darby: OK, right over here the temperature is 80. Actually slightly over 80. There is a possibility
that there could be one over here. In the gulf. I am going to look for more clues. [She
clears the visualization.]
Darby: OK I am going to check the speed again. [She clears the visualization, turns off
topography, and creates a horizontal colored slice for wind speed.]
Darby: It says that the WS [wind speed] needs to be over 75 KPH. It doesn’t look like there are.
Interviewer: What is your judgment?
Darby: I don’t think there is one because it does not have all the speeds.
This is exciting, because it shows that a 15-year-old beginner to 5-D visualizations and atmospheric science
can read and interpret textual descriptions of a phenomenon and translate those facts into operational visualization
strategy to interrogate a data set. This software empowers learners and affords them enormous opportunity to hurdle
the traditional learning curve associated with visualizing and engage in inquiry and the process of scientific
visualization.
Conclusion
The Virtual Exploratorium is a unique collaboration that couples a diverse team developing a learning
model with a strong theoretical base to take advantage of advance technologies of 5-D visualization and modeling
for the betterment of geoscience education. This paper reports on three research efforts in the areas of community
research, learning research, and 5-D visualization research that have been conducted in the developing model,
pedagogy, and technology architecture that will become the Virtual Exploratorium.
219 ICLS 2000Endnotes
(1) We would like to acknowledge our team (Robert Wilhelmson, Mohan Ramamurthy, Daniel Bramer, Don
Middleton, Rajul E. Pandya, and Tim Scheitlin) and the support of the National Science Foundation and the
Center for Innovative Learning and Technology Seed Grant that supported the 3-D visualization study.
References
Cognition and Technology Group at Vanderbilt. (1993). Anchored instruction and situated cognition revisited.
Educational Technology, 33, 52–70.
Edelson, D. C., & Gordin, D. (1998). Visualization for learners: A framework for adapting scientists’ tools.
Computers and Geosciences, 24, 607–616.
Gordin, D. N., & Pea, R. D. (1995) Prospects for scientific visualization as an educational technology. Journal of the
Learning Sciences, 4, 249–279.
Hawkins, J., & Pea, R. (1987). Tools for bridging the cultures of everyday thinking and scientific reasoning. Journal
of Research in Science Teaching, 24, 291–307.
Hay, K. E. (1999, May). The digital weather station: A study of learning with 5-D visualization. Presented at the
meeting of the American Educational Research Association, Montreal, Canada.
Lincoln, Y. S., & Guba, E. G. (1985). Naturalistic inquiry. Beverly Hills, CA: SAGE.
Muthukrishna, N., Carnine, D., Grossen, B., & Miller, S. (1993). Children’s alternative frameworks: Should they be
directly addressed in science education? Journal of Research in Science Teaching, 30, 233–248.
Pea, R. D. (1985). Integrating human and computer intelligence. In E. Klein (Ed.), Children and computers: New
directions for child development. San Francisco: Jossey-Bass.
Pea, R. D., & Gomez, L. (1992). Learning through collaborative visualization: Shared technology learning
environments for science. In Proceedings of SPIE ‘92 (International Society of Photo-Optical
Instrumentation Engineers): Enabling Technologies for High-Bandwidth Applications, 1785, 253–264.
Pfundt, H., & Duit, R. (1998). Students’ alternative frameworks and science education (Bibliography, 5th ed.). Kiel
University, West Germany: Institut fuer die Paedagogik der Naturwissenschaften.
Roth, W.-M. (1996). Knowledge diffusion in a grade 4–5 classroom during a unit of civil engineering: An analysis
of a classroom community in terms of its changing resources and practices. Cognition and Instruction, 14,
170–220.
Roupp, R. R., Gal, S., Drayton, B., & Pfister, M. (Eds.). (1993). Labnet: Toward a community of practice. Hillside,
NJ: Erlbaum.
Simpson, W. D., & Marek, E. A. (1988). Understandings and misconceptions of biology concepts held by students
attending small high schools and students attending large high schools. Journal of Research in Science
Teaching, 25, 361–374.
Strauss, A., & Corbin, J. (1990). Basics of qualitative research: Grounded theory, procedures, and techniques.
Newbury Park, CA: Sage.
Taylor, R. P. (Ed.). (1980). The computer in the school: Tutor, tool, tutee. New York: Teachers College Press.
Whitehead, A. N. (1929). The aims of education and other essays. New York: Macmillan.
ICLS 2000 220You can also read