Investor Presentation - FY 2018 Results - GTT
←
→
Page content transcription
If your browser does not render page correctly, please read the page content below

Investor Presentation

      FY 2018 Results

         27 February 2019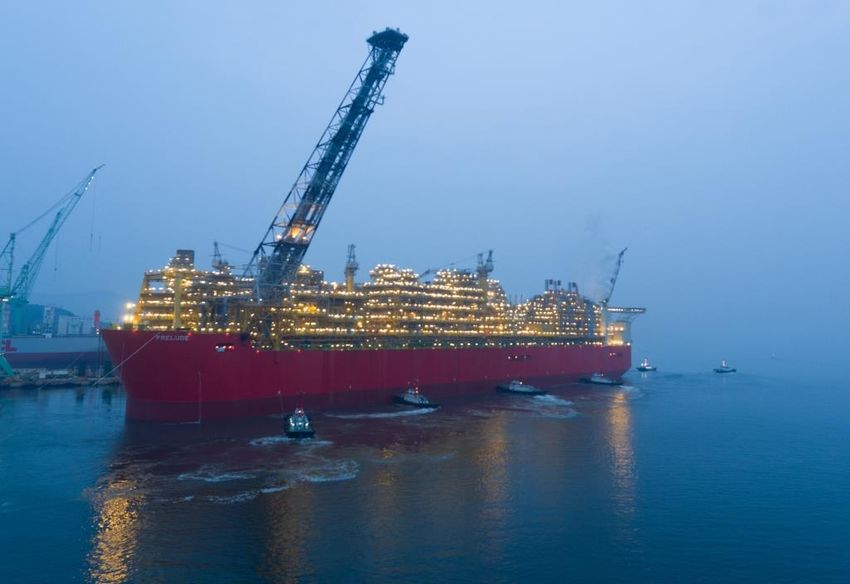
Disclaimer

      This document contains information resulting from testing,
      experience and know-how of GTT, which are protected under the
      legal regime of undisclosed information and trade secret (notably
      TRIPS Art. 39) and under Copyright law. This document is strictly
      confidential and the exclusive property of GTT. It cannot be copied,
      used, modified, adapted, disseminated, published or communicated,
      in whole or in part, by any means, for any purpose, without express
      prior written authorization of GTT. Any violation of this clause may
      give rise to civil or criminal liability - © GTT 2010 - 2019

                                                                             2
Disclaimer

This presentation does not contain or constitute an offer of securities for sale or an invitation or inducement to invest in securities in France, the
United States or any other jurisdiction.
It includes only summary information and does not purport to be comprehensive. No representation, warranty or undertaking, express or
implied, is made as to, and no reliance should be placed on, the accuracy, completeness or correctness of the information or opinions contained
in this presentation. None of GTT or any of its affiliates, directors, officers and employees shall bear any liability (in negligence or otherwise) for
any loss arising from any use of this presentation or its contents.
The market data and certain industry forecasts included in this presentation were obtained from internal surveys, estimates, reports and studies,
where appropriate, as well as external market research, including Poten & Partners, Wood Mackenzie and Clarkson Research Services Limited,
publicly available information and industry publications. GTT, its affiliates, shareholders, directors, officers, advisors and employees have not
independently verified the accuracy of any such market data and industry forecasts and make no representations or warranties in relation
thereto. Such data and forecasts are included herein for information purposes only. Where referenced, as regards the information and data
contained in this presentation provided by Clarksons Research and taken from Clarksons Research’s database and other sources, Clarksons
Research has advised that: (i) some information in the databases is derived from estimates or subjective judgments; (ii) the information in the
databases of other maritime data collection agencies may differ from the information in Clarksons Research database; (iii) while Clarksons
Research has taken reasonable care in the compilation of the statistical and graphical information and believes it to be accurate and correct,
data compilation is subject to limited audit and validation procedures.
Any forward-looking statements contained herein are based on current GTT’s expectations, beliefs, objectives, assumptions and projections
regarding present and future business strategies and the distribution environment in which GTT operates, and any other matters that are not
historical fact. Forward-looking statements are not guarantees of future performances and are subject to various risks, uncertainties and other
factors, many of which are difficult to predict and generally beyond the control of GTT and its shareholders. Actual results, performance or
achievements, or industry results or other events, could materially differ from those expressed in, or implied or projected by, these forward-
looking statements. For a detailed description of these risks and uncertainties, please refer to the section “Risk Factors” of the Document de
Référence (“Registration Document”) registered by GTT with the Autorité des Marchés Financiers (“AMF”) on April 25, 2018 and the half-yearly
financial report released on July 26, 2018, which are available on the AMF’s website at www.amf-france.org and on GTT’s website at www.gtt.fr.
The forward-looking statements contained in this presentation are made as at the date of this presentation, unless another time is specified in
relation to them. GTT disclaims any intent or obligation to update any forward-looking statements contained in this presentation.

                                                                                                                                                          3
Agenda

 1. Company overview & key highlights

 2. Core business: Market & Activity update

 3. New businesses: LNG Fuel developments

 4. Service activity

 5. Stategic roadmap

 6. Financials

 7. Outlook

 Appendices

                                              4
1
Company overview
   & Key highlights

                      5
GTT, a French technology and engineering company,
specialised in liquefied gas containment systems

                                                                                Consolidated key figures
 Profile
           Technology and engineering
                                                                 in € million              2017 (1)         2018
           company
           Expert in liquefied gas containment                   Total Revenues              241            246
           systems                                                Royalties (newbuild)       228            232
                                                                  Services                   13             14
           More than 50-year track record
                                                                 Net Income                  124            143
 Activities
           Designs and licenses membrane
           technologies for containment of
           liquefied gas                                                                   As at December 2018
                    Core business: LNG transportation
                    and storage
                                                                                                342 employees(2)
                    New business: LNG as a fuel for
                    vessel propulsion
           Provides design studies, construction
           assistance and innovative services

              (1)   Proforma IFRS 15
              (2)   GTT SA / Excluding interns and apprentices

                                                                                                                   6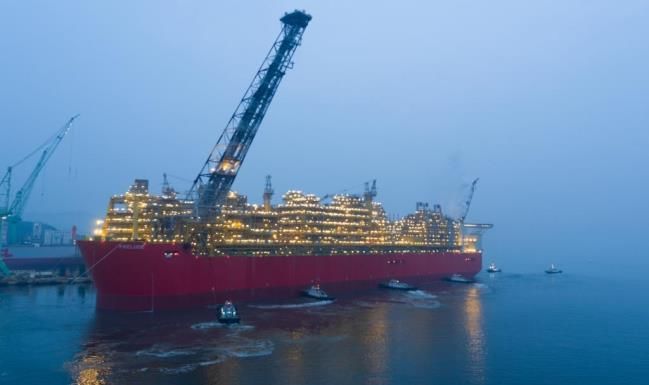
Key Highlights
FY 2018 Consolidated Revenues: €246 million (+6.2%)

Record level of new orders

                                                                 CORE BUSINESS

                Order book: 97 units                                       FY 2018 movements in the order book
 83 LNGC*                              2 FLNG                            New orders: 51 (48 LNGC, 2 FSRU, 1 Onshore storage)
 9 FSRU                                3 Onshore storage                 Deliveries: 42 (36 LNGC, 5 FSRU, 1 barge)

+ Since the beginning of 2019: 11 additional LNGC orders vs 6 deliveries (5 LNGC / 1 FSRU)
                                                           NEW BUSINESS (LNG FUEL)

                  Order book: 11 units                                    FY 2018 New orders
 9 ULCS                                      1 Bunker ship                 1 Bunker ship
 1 Cruise ship                                                             1 Cruise ship

Service activity: FEED studies of Gravity Based Systems (GBS)

3 new TALAs: Sembcorp Marine, Keppel Offshore & Marine, Hyundai Mipo Dockyard

AIP from Bureau Veritas for the development of NO96 Flex in September 2018

                                                                                 Notes: LNGC – Liquefied Natural Gas Carrier, VLEC – Very Large Ethane Carrier,
                                                                                 FSRU – Floating Storage and Regasification Unit, RV – Regasification Vessel,
          * Taking into account one order cancelled in Q4 2018                   FLNG – Floating Liquefied Natural Gas ,ULCS – Ultra Large Container Ships        7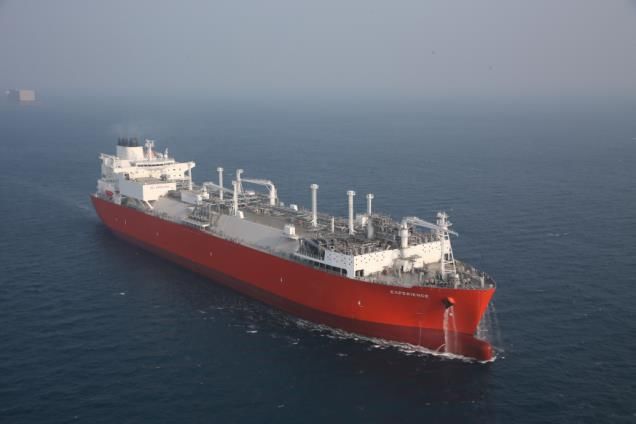
2
          Core business:
Market & activity update

                           8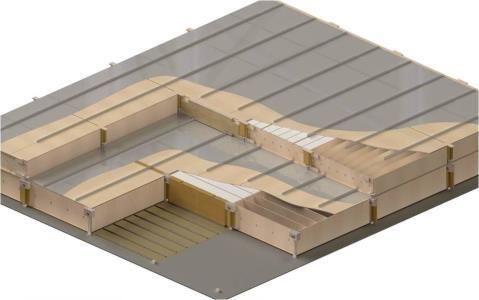
Overall long term outlook bright for gas and LNG

          Gas share in the energy mix                        LNG share in total gas trade

Gas is the only fossil energy to increase share in      Gas is increasingly exported thanks to
the energy mix                                          LNG
    Gas is expected to exceed coal by 2025, and could             LNG to overpass pipeline trade by
    become 1st source of energy in the early 2040’s               2035
    Drivers: environmental properties, price                      Driver: greater flexibility
    and availability

               Source: BP 2018 outlook, GTT                 Source: BP base case 2017 & 2016
                                                                                                      9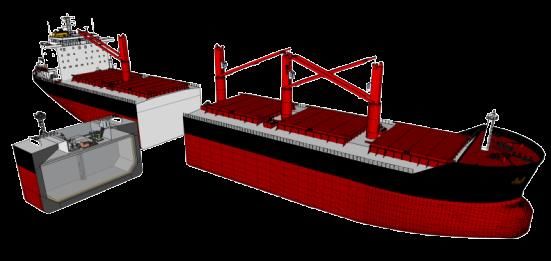
LNG strong demand outlook
                              2035 LNG demand outlook
           700

           600

           500

           400
    Mtpa

           300

           200

           100                                                   Q1 2019 for Shell, BP
                                                                 Q4 18 forecast for WM
                                                                 Q2 18 for IHS

             0
              2015     2020           2025        2030   2035

           LNG demand expected to double between 2018 and 2035
           Growth mainly coming from Asia
           Continuous growth expected

                                                                                         10
LNG demand forecasts keep rising
Evolution of LNG demand forecasts between 2016 and 2018
700
+80 Mtpa
600 +80 Mtpa
+35 Mtpa
500
+30 Mtpa
400
Mtpa
300
200
100
-
2020 2025 2030 2035
Q4-2016 forecast Q4 2017 forecast Q4 2018 forecast Source: Wood Mackenzie
Since 2016, LNG demand outlooks have kept increasing every year
In 2018, they have been reevaluated higher every quarter
This expected increasing demand is mainly driven by Chinese imports
2030 and 2035 demand outlooks have increased by 80 Mtpa in 2 years.
This increase positively impacts our medium-term ship order estimates.
11Asian LNG imports growing in 2018 vs. 2017
Top LNG importers demand comparison 2018 vs. 2017
2017 trends confirmed
250 50%
Demand of top 5 LNG importers
+44%/y increased by +12% in 2017 and
200 40% in 2018
Main drivers
150 30%
Coal to Gas switch, especially in
China due to environmental
mtpa
100 20% considerations.
+15%/y
+12%/y
Coal restrictions and below
+11%/y
expected nuclear performance in
50 10%
+6%/y Korea
Nuclear restart in Japan slightly
0 0% 0% reduced LNG consumption.
Japan China Korea India Taiwan TOTAL
Coal progressive slowdown in
-50 -10%
China and South Korea expected
2016 2017 2018 CAGR 2016-2018 to strengthen in the mid term
China #2 LNG importer,
expected to become #1 by 2022
Main sources : National Custody Agencies and Ministries ; Wood Mackenzie
12LNG Supply & Demand: new capacity needed
LNG Supply & Demand balance forecast
600
500 250 Mtpa
400
Mtpa
300
200
100
0
2007
2021
2026
2000
2001
2002
2003
2004
2005
2006
2008
2009
2010
2011
2012
2013
2014
2015
2016
2017
2018
2019
2020
2022
2023
2024
2025
2027
2028
2029
2030
2031
2032
2033
2034
2035
Supply - Operationnal Supply - Under Construction Demand
Sources: Wood Mackenzie
Q4 2018 ; GTT Analysis
New FIDs expected in the coming years in order to bridge the widening
supply & demand gap
NB: Under construction supply takes into account Golden Pass (FID in February 2019)
13Liquefaction projects: more FIDs expected
Volume
Project Country Operator (Mtpa) Comment
Corpus Christi T3 US Cheniere 4.5 Production expected in 2022/2023
FID taken LNG Canada Canada Shell 14 Production expected in 2025
in 2018-
2019 Tortue FLNG Senegal/Mauritania BP 2.4 Golar FLNG under conversion. Prod expected in 2021/2022
Golden Pass US Exxon, QP 15.6 Production expected in 2024
Arctic LNG-2 Russia Novatek 18 14 booked slots at Zvezda by Novatek for future shipping orders
Qatar LNG expansion Qatar QP 11 11 Mtpa debottlenecking + 22 Mtpa extension project
Most likely Calcasieu Pass US Venture Global 10 80% capacity sold - FID expexpected in Q1 2019
FIDs by
2020 Sabine Pass T6 US Cheniere 4.5 Active marketing by Cheniere
Mozambique LNG-4 Mozambique Exxon, ENI 15.2 Equity project with strong backing from Exxon
Mozambique LNG-1 Mozambique Anadarko 12 7,1 Mtpa SPAs signed as at February 2019
FID at Golden Pass in February 2019
36.5 Mtpa FID since May 2018
More FIDs expected in 2019-2020
14Volatility in charter rates leads to a healthier LNG shipping
market
Spot Charter rates have soared in Q3 2018, reaching up to $200k/d before returning to more
acceptable levels for ship-owners
1 year charter rates have also soared in 2018
Many companies have seen the risk of a tighter shipping market and have booked short term
vessels (3,6,12 months).
15Ageing LNGCs represent an additional market potential
for GTT
LNGC fleet by date of delivery
700
1. Future Orders associated
600 to new LNG projects
500
Nb of sips
400
300
200
100 2. Future Orders associated
to replacement of old vessels
0 Source : Clarksons
1970 1980 1990 2000 2010 2020 Vessels >30kcbm
Vessels built before 2000’s are becoming less and less economically adapted
Reduced size
Inefficient motorization: Old ST can consume twice more fuel than modern MEGI/XDF
High Boil Off
55 ageing vessels with charter contract ending by 2022
Replacement of old vessels will represent an increasing share of orders
16Core business: upgrade of long term estimates
GTT 2018 Sales GTT order estimates over 2019-2028
Services LNGC: between 280 and 310 units
Other
FLNG 2% 6%
1%
FSRU FSRU: between 30 and 40 units
10%
FLNG: Up to 5 units
LNGC
Onshore and GBS tanks: between 10 and
81% 15 units
Courtesy of Shell Courtesy of Excelerate Energy
173.2 3
New businesses:
LNG Fuel developments
18IMO 2020: LNG is the only solution allowing
comprehensive environmental compliance
Comparison of emissions by fuel type
1
0,75
HFO
Base 1
0,5 HFO+ Scrubber
LSHFO
LNG
0,25
0
SOX NOX CO2 Particulates Source : DNV
LNG is the only solution directly compliant with all environmental regulations;
also “future ready”
No Sox, no particulates, low Nox, reduced CO2 emissions
Implementation of NOx reduction in Northern Europe will further degrade oil
fuel’s and Scrubber’s competitiveness
19Open loop scrubbers banned in more areas
Map of open loop scrubbers ban areas
Norway
Ireland Lithuania, Latvia
Belgium
California
Connecticut
China
UAE
India
Singapore
Source : GTT, Lloyd’s list
NB: Not exhaustive list - Other ports in
Ireland and the US ban open loop scrubbers
3 major announcements on open loop scrubbers ban over the last 2 months:
China, Singapore and Fujairah (UAE)
Singapore and Fujairah are 2 of the 3 biggest bunker ports in the world
Alternative: closed loop scrubber are more expensive and logistically more
complicated (washed waters to discharge in ports).
Room for LNG as fuel to speed up development 20LNG as fuel: Bunkering network expands
Numerous LNG bunker vessels orders in 2018, improving the availability of LNG as fuel
ENN for China Eesti Gas for Estonia
MOL for Europe (GTT) GazpromNeft for Russia Baltic
Central LNG for Japan FueLNG for Singapore
Many more under discussion and expected for 2019
Map of LNG Bunker vessels
Source: DNV GL
21LNG Fuel focus: entry into 2 new market segments
July 2018 January 2018
Ponant ice-breaker with LNG propulsion 1 bunker ship
Contract with the Norwegian shipyard VARD in charge 18,600 cbm capacity
of the vessel’s construction Mark III Flex technology
Vessel’s delivery planned in 2021 Owned by MOL, chartered by
Two tanks of a total capacity of 4,500 cbm equipped Total, to supply the 9 CMA
with GTT’s Mark III membrane technology CGM ULCSs
GTT offering a turnkey solution:
The Group will conduct the construction of the tanks
Will be in charge of selecting and coordinating its
subcontractors
22LNG Fuel market potential for GTT
Relevant Market Segments Historical 10y
Shipping Markets Fleet at end 2018
for GTT annual orders
MAIN TARGETS
Container Ships 3-20+ kTEU
Bulkers 100+ kdwt ~260 ~5,400
Oil Tankers 125+ kdwt
Cruise Ships
All size ~40 ~1,200
Car & Truck Carriers
TOTAL SHIPPING MARKET
All vessels
100 GT+ 2,600 ~95,000
(excl. LNGC, FSRU…)
Source: GTT analysis, Clarksons
Global market represents a pool of ~2,600 ships per year (newbuilds)
GTT is particularly focusing on a segment of ~ 300 ships per year (newbuilds)
LNG as Fuel penetration will mainly depend on spread between LSHFO and LNG price
GTT is confident in the development of this market and is working hard
to be prepared for its ramp-up
233.3 4
Service activity
24Services to make LNG easy
CONSULTING TRAINING LNG OPERATIONS EMERGENCY
DIGITAL MAINTENANCE TESTS
Extensive range of services to provide assistance all along the vessel life
Originally developed for LNG Shipping, adapted and enhanced for LNG fuel
255
Strategic roadmap
26GTT’s strategic roadmap
Gas handling technologies Growth,
Technology,
Transformation
Fuel Gas handling system for vessels
Superior LNG gas handling systems
Advanced decision support systems
Enlargement
New
Advisory and
applications LNG as fuel Transfer operations optimisation services Framework service and
REACH4
maintenance contract
Enhancement (Shell Prelude, Teekay…)
Smart shipping
New
customers /
© Shell
geographies Gravity Based Intervention services
Offshore Multigas
carriers System
Intensification Improvement
Existing NO96 systems
customers /
geographies Mark systems LNG Brick®
LNG Carriers
Existing Modified / Enhanced New
272019: GTT is investing to prepare the future
GTT is bringing major improvements to its technologies :
To improve thermal and mechanical performances in order to provide
more flexibility in operation
To adapt and optimise insulation systems for new markets
LNG as a fuel
HD Foam
LPG Applications
GBS
While GTT will keep its lean and fit approach,
the LNG market is offering such perspectives
that the Group will strenghen its innovation efforts.GTT innovation for optimised BOR
Thermal performance of GTT technologies developed since 2010
0,16%
0,14%
0,12%
0,15%
0,10%
0,15%
0,08%
0,06%
0,13%
0,110%
0,085%
0,10%
0,07%
0,04%
0,07%
0,02%
0,00%
A significant added-value for operators
Design BOR for a 174,000m3 vessel
Optimized HFC 245-fa foams exhibiting improved thermal conductivity, with repeatable production process 29Why develop a digital strategy?
Monitoring and optimization software developed by GTT since 2013 has set
the ground for the development of its digital roadmap
Advanced digital solutions (automation, optimisation) can make the
transition to LNG as a fuel easy for many clients
Accurate data management is key to improve ship energy performance
and assist clients efficiently, in particular in a context of increasing fuel prices
30Developing synergies between GTT and Ascenz
Ascenz is an experienced Maritime Digitalization company with a global
presence
With LNG as a fuel, GTT technologies are installed in new type of vessels.
Ascenz has experience equipping these vessels with sensors and softwares
The combination of both companies’ experience is an opportunity to create
innovative digital solution for all type of vessels
Industrial quality standards
Digital agility
Capitalise on synergies to support GTT digital strategy
316
Financials
32Order book overview (core business) – IFRS 15
Order book in units Order book by year of delivery (units per year)
In units In units
47
40
120 30 30
(1)
89 97
90 20
20
13
60 5
0
30 2019 2020 2021
As at Dec 31, 2017 As at Dec 31, 2018 As at Dec 31, 2017 As at Dec 31, 2018
Order book in value Revenues expected from current order book (royalties2)
In €M In €M
300
524 251
+31% 224
500
401 200
124
300
100
48 49
6
100 0
As at Dec 31, 2017, As at Dec 31, 2018, 2019 2020 2021
on 2018-2021 on 2019-2021 As at Dec 31, 2017 As at Dec 31, 2018
(1) Delivery dates could move according to the shipyards/EPCs’ building timetables.
(2) Royalties from core business, i.e. excluding LNG as Fuel , services activity. 33FY 2018 financial performance
Summary consolidated accounts Key highlights
In € M
Proforma 2018 Change
Increase in revenues
2017
Revenues newbuilds (royalties): +1.7%
Total Revenues 240.8 246.0 +2.2%
+9.6% increase in Service revenue, mainly due
EBITDA(1) 151.3 168.7 +11.5% to the integration of Ascenz
Margin (%) 62.8% 68.6%
Operating Income 147.5 159.9 +8.4% EBITDA: +11.5%
Margin (%) 61.3% 65.0%
Reversal of fiscal provision (€15.2M)
EBITDA margin excl. one-off items: 62.4%
Net income 124.0 142.8 +15.1%
Margin (%) 51.5% 58.1%
Free Cash Flow(2) 126.6 217.2 +71.6% Free cashflow: +72%
Change in Working Increase in EBITDA: +€17.4M
21.3 -60.3 ns
Capital(3) Change in working capital, mainly due to the
Capex 3.4 11.8 ns increased number of new orders (net impact:
€81.6M)
Dividend paid 98.6 98.5 -1.0%
Capex: -€11.8M, including the acquisition of
Ascenz
in € M 31/12/2017 31/12/2018
Cash Position 99.9 173.2 +73.4%
(1) Defined as EBIT + amortisations and impairments of fixed assets
(2) Defined as EBITDA - capex - change in working capital
(3) Defined as December 31, 2018 working capital – December 31, 2017 working capital
(4) Defined as trade and other receivables + other current assets – trade and other payables – other current liabilities
34FY 2018 Cost base
GTT consolidated operational costs Key highlights
Proforma
in € M 2017 2018 Change (%)
External costs: +11%
Goods purchased (1.8) (3.0) +63.8% Subcontractors +18% (but -17% vs 2016)
% sales -1% -1% Travel costs -7%
Other external costs +22%
Subcontracted Test and
(12.6) (14.9) +18.2%
Studies
Rental and Insurance (5.8) (6.0) +3.5%
Staff costs up 11% mainly due to the increase
in headcount and the integration of Ascenz
Travel Expenditures (8.6) (8.0) -7.0%
Other External Costs (9.9) (12.1) +22.2%
Total External Costs (36.8) (41.0) +11.3%
% sales -16% -17% GTT 2018 costs(1) by nature
Salaries and Social
(34.3) (38.2) +11.1% Staff costs
Charges
51%
Share-based payments (0.8) (0.6) ns External costs
46%
Profit Sharing (6.1) (6.9) +14.9%
Total Staff Costs (41.2) (45.8) +11.2%
% sales -18% -19%
Other(1) 3.7 0.3 ns
Cost of sales
% sales 2% 0% 3%
(1) Excluding depreciations, amortisations, provisions and impairment of assets
35Dividend
2017 2018
Net income available for distribution
€114.1 M €144.4 M
(French GAAP)
Total dividend
Dividend per share €2.66 €3.12
Total amount paid €98.6 M €115.6 M
Pay out ratio 86% 80%
Dividend
amount 3.12
+17%
€3.00
3,0
2.66 Balance dividend
of €1.79
- Record date:
1.79
€2.00
2,0 May 27, 2019
1.33
- Payment date:
May 29, 2019
€1.00
1,0
1.33 1.33
€0.00
0,0
2017 2018
Interim Final
(1) Dividend payout ratio calculated on profit distributed (and possible distribution of reserves) as % of French GAAP net profit for the financial year.
367
Outlook
372019 Outlook
GTT revenue(1) 2019 consolidated revenue estimated in a range of €255 M to €270 M
EBITDA 2019 consolidated EBITDA estimated in a range of €150 M to €160 M
Dividend
2019 and 2020 payout of at least 80%
Payment(2)
(1) In the absence of any significant delays or cancellations in orders. Variations in order intake between periods could lead to fluctuations in revenues
(2) Subject to approval of Shareholders' meeting. GTT by-laws provide that dividends may be paid in cash or in shares based on each shareholder’s preference
38Thank you for your attention
Image courtesy of STX, Engie, Excelerate, SCF Group, Shell, CMA CGM, Matthieu Pesquet, Conrad
39Appendix
40A streamlined group and organisation
GTT Group
Philippe Berterottière*
Chairman and Chief Executive
Officer
GTT SA organisation
Lélia Ghilini*
General Counsel
Frédérique Marc Haestier* Isabelle Delattre*
Julien Bec David Colson* Karim Chapot*
Coeuille* Finance & Human
LNG as fuel Commercial Technical
Innovation Administration Resources
~15 employees ~32 employees ~152 employees
~90 employees ~37 employees ~10 employees
* Member of the executive committee
41GTT exposure to the liquefied gas shipping and storage
value chain
Exploration Off Take /
Liquefaction Shipping Regasification
& Production Consumption
Liquefied Natural Gas LNG fuelled
Offshore Carrier ship
clients: (LNGC)
shipyards Platform /
Gas-to-wire
Installation Floating LNG Production, Floating Storage and
Storage and Offloading Regasification Unit (FSRU)
unit (FLNG)
Barge
Ethane/ multigas
Carriers
Onshore
clients:
EPC Power plant
contractors Onshore storage Onshore storage re- Tank in
liquefaction plant gasification terminal industrial plant
Source: Company data
42GTT ecosystem
Oil & Gas
Companies Shipowners
End clients and
End clients and prescribers
prescribers
provides services provides services
and maintenance
Classification
Societies
Regulatory oversight
of the industry
Shipyards
Direct clients
receives new
technology
certification and licences its membrane
approval technology and receives
royalties
provides engineering
studies, on-site technical
and maintenance
assistance
43GTT membrane technologies
Primary
General principle: membrane
Two membranes
Primary insulation
Two layers of insulations Secondary
membrane
Containment system Secondary insulation
anchored to the inner hull Hull
Mark III system NO96 system
44NO96 Flex: a low boil-off system at a reasonable
incremental cost
September 2018: AiP from Bureau Veritas for the development of NO96 Flex
This new version benefits from the NO96 proven technology as well as the use of an
efficient foam panel insulation
Guaranted boil-off rate at 0.07%V per day
45Focus on China set to become #1 in 2022
China LNG demand outlook by 2035
120
China expected to become #1 LNG
100 consumer around 2022
Over 100 Mtpa expected by 2035
80
Mtpa
60
China future LNG demand is robust
40 Strong coal to gas policy
20
Numerous plans to improve air
quality
0
2005 2010 2015 2020 2025 2030 2035
Source : WoodMackenzie Q4 2018
LNG demand further strengthened by lack of pipeline connection
Pipeline: LNG consuming areas are far away from exporting countries (Turkmenistan, Russia,…),
and pipeline network is not well interconnected, limiting expansion.
Production: limited local upstream production + producing regions not well linked to LNG consuming
areas.
LNG demand secured by improving LNG infrastructure
Terminals: 7 new LNG importing terminals easing tension on capacity of terminals.
Trucks: strong development of truck LNG transportation, supporting demand by bringing LNG inland.
25% of imported LNG has been trucked in 2018.
46
NB: Future Russian imports from Power of Siberia pipeline are taken into account in LNG forecastsUS LNG is competitive in Asia
US LNG vs. Asian LNG price depending on Henry Hub and Oil prices
Asian oil indexed LNG competitive Asian LNG
11
US LNG competitive
10
LNG price ($/Mmbtu)
9
Spread
8
HH : $3,5/Mmbtu
US LNG
HH : $3/Mmbtu
7
2017 avg. 2018 avg.
HH : $2,5/Mmbtu
2016 avg.
6
Main sources:
5 GTT analysis, EIA, Wood Mackenzie
40 45 50 55 60 65 70 75
Oil price ($/bl) Hypothesis
US LNG: Asian LNG:
• HH+15% • Slope: 14% of JCC price
2018 has been very competitive for US LNG vs Asian LNG • Tolling Fee: 2.25$ • Constant: 0.5$
• Shipping: 1.43$ (US East ->Japan,
High oil prices ($70/bl) vs low Henry Hub prices ($3,1/Mmbtu) 174k cbm Me-GI or X-DF)
US LNG ≈ $7.2/Mmbtu
Despite 10% tariff, US LNG remains largely economic in China
Asian LNG ≈ $10,4/Mmbtu
(US LNG+tariff =$7,9/Mmbtu)
Despite early 2019 oil fall to ≈$60/bl, US LNG remains competitive in Asia
4755 ageing vessels with charter contract ending by 2022
LNGCs carriers* with charter contract ending by 2022
80 LNGC chart contract to end by 2022
30
Of which 55 equipped with steam turbine
propulsion; also smaller vessels ( expensive to charter!
20
Charterers and shipowners to prepare the
# LNGCs
shift to more modern vessels 15
2018/2019 expiring vessels could be
replaced by ships currently on order 10
18
2020/2022 expiring vessels could require
5 10 11 10
newbuilding to be ordered from now
6
0
Some Majors already considering selling 2018 2019 2020 2021 2022
and replacing part of their ageing fleet (e.g. Steam Turbine DFDE X-DF/ME-GI
Shell, NWS project) * Above 100k cbm Source: Wood Mackenzie
48LNGCs – Our main business
Vessels equipped for transporting LNG
Existing GTT fleet: 370 units1
In order: 83 units1
24 construction shipyards under license1
Our strengths
Technological leadership, boil-off divided by 2 in the last 5 years
Long term industrial partnerships with major shipyards
A unique position in the LNG ecosystem, nurtured by 50 years of
experience, expertise and customer orientation
1 As at 31 Dec 2018
49FSRUs – The game changer for new importing countries
Major competitive advantage vs. land-based terminals:
Quick to build/deploy & mobile
Better local acceptability & easier permitting
Affordable / no upfront CapEx
Adapted to more volatile LNG prices
Quality controlled construction in shipyards with available
and skilled workforce Courtesy of Excelerate Energy
FSRUs market outlook
Around 30 FSRUs
currently in service or
under construction
Worldwide development
Asia (India, China, …)
Europe
(Turkey, Croatia, …)
South & West Africa
LatAm & Carribeans
Source: Poten
50FLNGs – the new frontier of the LNG world
Floating units which ensure
treatment of gas, liquefy and store it
Existing GTT fleet: 2 units1
In order: 2 units1
Courtesy of Shell
Main drivers GTT key advantages
Monetisation of stranded Extended amortization
offshore gas reserves perspectives
Better acceptability (no NIMBY Deck space available for
syndrom) liquefaction equipment
More affordable cost
1 As at 30 Dec 2018
51LNG Fuel focus – order of a bunker ship to supply the
9CMA CGM ULCSs
December 2017
9 Ultra Large Container Ships
LNG integrated membrane tanks of 18,600 cbm each
Space optimization
Designed for one bunkering operation per round trip (once every 4 to 5 months)
Mark III technology for the fuel storage system
Sea proven technology
Guaranteed Boil Off Gas
Flexibility to handle and store Boil Off Gas (maximal pressure of 700 mbarg)
Positive impact on global LNG demand
LNG Consumption of 300,000 tons per year for the 9 vessels, i.e. eq. 0.1% of LNG global production
52Current LNG Fuel tank market situation
Total LNG fuel tank by ship type (in service & on order)
20 000
Max
Total LNG
tanks capacity Avg.
15 000
Min
cbm
10 000
5 000
Market avg ~1,500 cbm
0
Notes: Data available for ~80% of the 305 vessels in service and Source: DNV GL
on order
Recent market that started with small ships and where Type C tanks has been preferred (tugs, ferries, PSV, … with
LNG tanks up to several hundreds of cbm)
Large vessel segment, where GTT technologies are the most relevant, is now emerging (container ships, bulkers, …
with several thousands of cbm and more)
Recent order of 9 Very Large Container Ships with 18,600 cbm membrane LNG tank propelled the market to a new
level
53GTT’s LNG Fuel solutions offering
GTT has developed solutions for the main applications of LNG Fuel
Solutions for Container Vessels new build and retrofit Cruise Ship – optimizing the space for additional
passengers
Lean bunker barge to
Cost effective solution for bulk carriers standardize the market
New LNG Brick®
dedicated to medium-sized merchant vessels
test phase completed
54Wide network of partnerships
Shipyards Industrial and commercial partnerships
Outfitters Ship owners
55Focus on GTT’s competitive advantages
GTT’s technology positioning (1)
GTT Moss SPB KC-1
Technology ▶ Membrane ▶ Spherical tank ▶ Tank ▶ Membrane
▶ Requires less steel and
Construction ▶ Slightly higher costs
aluminum than tanks for ▶ Higher costs ▶ Higher costs
costs than GTT
a given LNG capacity
▶ More efficient use of
Operating space ▶ Higher opex due to
▶ Higher fuel / fee costs ▶ Higher fuel / fee costs
costs BOR (0.16%)
▶ Limited BOR (0.07%)
LNGCs in
▶ 83 ▶ 4 ▶ 3 ▶ 0
construction
LNGCs in
▶ 370 ▶ 126 ▶ 1 (+2 small) ▶ 2 (on repair)
operation
▶ Huge losses and delays on
▶ Higher centre of gravity; ▶ Korean technology with
Other ▶ Value added services vessels in orderbook.
harder to navigate little experience at sea
No significant experience
GTT technologies : cost effective, volume optimisation and high return of experience
Source: Company data and comment (December 31, 2018), Clarksons
(1) Other technologies are being developed, however are not known to have obtained final certification or orders to date (e.g. DSME’s Solidus). Excludes vessel orders below 30,000 m3
56An attractive business model supporting high cash
generation
Invoicing and revenue recognition Business model supports high cash generation
% of contract (1)
c. 9 to12 months c. 18 months Delivery Revenue is recognized pro-rata
10000 studies royalties temporis between construction
milestones
8000
Ship
launching Initial payment collected from
shipyards at the effective date of
6000
Keel laying order of a particular vessel (10%)
Steel cutting (20%)
4000 Keel laying (20%)
Steel cutting
Ship launching (20%)
Delivery (30%)
2000
Months from receipt of order
0
0 5 10 15 20 25
Cash collection Revenue IFRS 15
Source: Company
(1) Illustrative cycle for the first LNGC ordered by a particular customer, including engineering studies completed by GTT
57Appendix: track record of high margin and strong backlog
2008 2011
Economic crisis Fukushima
US shale gas boom
120 112 66 30 18 52 77 99 114 118 96 89 94
47 2
44
37
34 35
Evolution of new
26
21
19
GTT orders (1)(2)
7
4 5
1
2006 2007 2008 2009 2010 2011 2012 2013 2014 2015 2016 2017 2018
LNGC/VLEC FSRU/FLNG Onshore storage Backlog (# of orders)
65% 64%
57% 58%
55%
51% 52% 51% 50%
42% 44%
31% 33%
Evolution of
251 246
revenue (in € M) 222 218 227 226 237 232
and net margin (4) 163
142
75 89
56
2006 2007 2008 2009 2010 2011 2012 2013 2014 2015 2016 2017 2018
Revenue Net Margin
Source: Company
(1) Orders received by period / Core business
(2) Excl. vessel conversions
(3) Represents order position as at December based on company data, including LNGC, VLEC, FLNG, FSRU and on-shore storage units
(4) Figures presented in IFRS consolidated from 2016 to 2018, IFRS from 2010 to 2015, French GAAP from 2006 to 2009
58Contact: information-financiere@gtt.fr / +33 1 30 23 20 87
You can also read