Investor Presentation - 2017 Full Year Results - GTT
←
→
Page content transcription
If your browser does not render page correctly, please read the page content below

Investor Presentation

    2017 Full Year Results

          February 19, 2018
Disclaimer

      This document contains information resulting from testing,
      experience and know-how of GTT, which are protected under the
      legal regime of undisclosed information and trade secret (notably
      TRIPS Art. 39) and under Copyright law. This document is strictly
      confidential and the exclusive property of GTT. It cannot be copied,
      used, modified, adapted, disseminated, published or communicated,
      in whole or in part, by any means, for any purpose, without express
      prior written authorization of GTT. Any violation of this clause may
      give rise to civil or criminal liability - © GTT 2010 - 2018

                                                                             2
Disclaimer

This presentation does not contain or constitute an offer of securities for sale or an invitation or inducement to invest in securities in France, the
United States or any other jurisdiction.
It includes only summary information and does not purport to be comprehensive. No representation, warranty or undertaking, express or
implied, is made as to, and no reliance should be placed on, the accuracy, completeness or correctness of the information or opinions contained
in this presentation. None of GTT or any of its affiliates, directors, officers and employees shall bear any liability (in negligence or otherwise) for
any loss arising from any use of this presentation or its contents.
The market data and certain industry forecasts included in this presentation were obtained from internal surveys, estimates, reports and studies,
where appropriate, as well as external market research, including Poten & Partners, Wood Mackenzie and Clarkson Research Services Limited,
publicly available information and industry publications. GTT, its affiliates, shareholders, directors, officers, advisors and employees have not
independently verified the accuracy of any such market data and industry forecasts and make no representations or warranties in relation
thereto. Such data and forecasts are included herein for information purposes only. Where referenced, as regards the information and data
contained in this presentation provided by Clarksons Research and taken from Clarksons Research’s database and other sources, Clarksons
Research has advised that: (i) some information in the databases is derived from estimates or subjective judgments; (ii) the information in the
databases of other maritime data collection agencies may differ from the information in Clarksons Research database; (iii) while Clarksons
Research has taken reasonable care in the compilation of the statistical and graphical information and believes it to be accurate and correct,
data compilation is subject to limited audit and validation procedures.
Any forward-looking statements contained herein are based on current GTT’s expectations, beliefs, objectives, assumptions and projections
regarding present and future business strategies and the distribution environment in which GTT operates, and any other matters that are not
historical fact. Forward-looking statements are not guarantees of future performances and are subject to various risks, uncertainties and other
factors, many of which are difficult to predict and generally beyond the control of GTT and its shareholders. Actual results, performance or
achievements, or industry results or other events, could materially differ from those expressed in, or implied or projected by, these forward-
looking statements. For a detailed description of these risks and uncertainties, please refer to the section “Risk Factors” of the Document de
Référence (“Registration Document”) registered by GTT with the Autorité des Marchés Financiers (“AMF”) under No. R.17-030 on April 27,
2017 and the half-yearly financial report released on July 20, 2017, which are available on the AMF’s website at www.amf-france.org and on
GTT’s website at www.gtt.fr.
The forward-looking statements contained in this presentation are made as at the date of this presentation, unless another time is specified in
relation to them. GTT disclaims any intent or obligation to update any forward-looking statements contained in this presentation.

                                                                                                                                                          3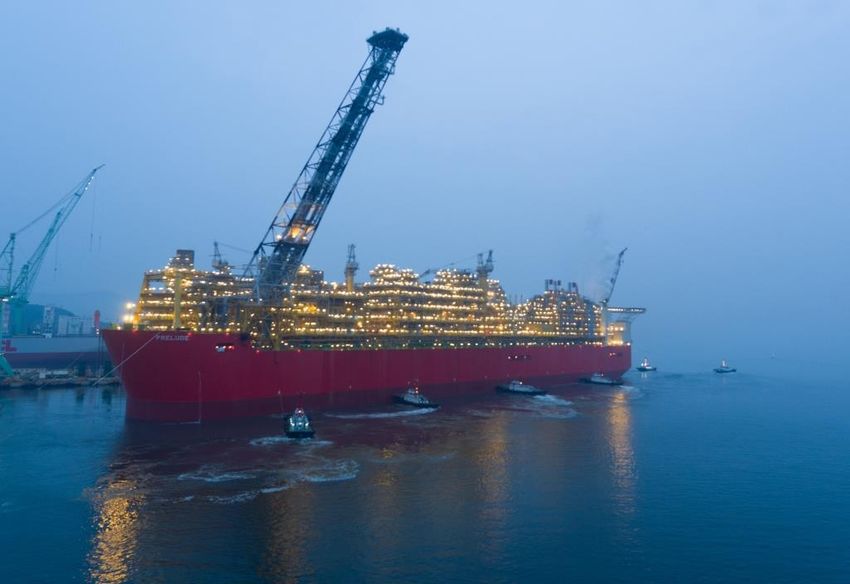
Agenda

 1. Company overview

 2. Market update

 3. Business activity

 4. Financials

 5. Outlook

 Appendices

                        4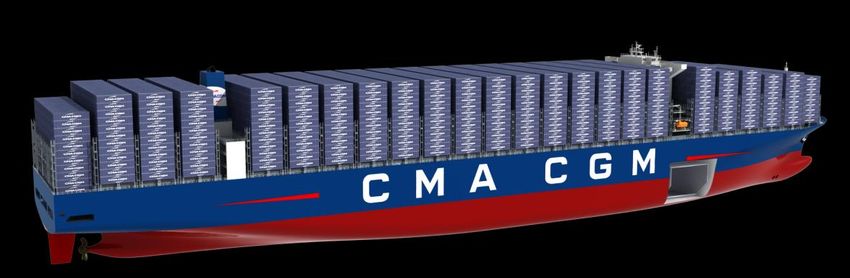
1
Company overview

                   5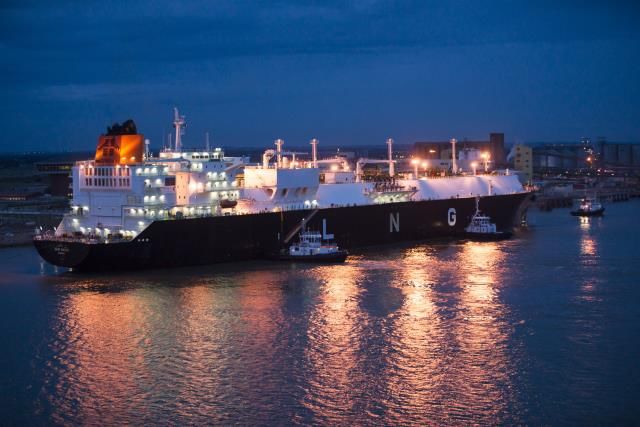
GTT, a French engineering company, global leader in
liquefied gas containment systems

                                                                       Consolidated key figures
 Profile
           Leading engineering company                  in € million               2016           2017

           Expert in liquefied gas containment          Total Revenues             237            232
           systems                                       Royalties (newbuild)      227            218
                                                         Services                  10             14
           More than 50-year track record
                                                        Net Income                 120            116
 Activities
           Designs and licenses membrane
           technologies for containment of
           liquefied gas
                    Core business: LNG transportation
                                                                                  As at December 2017
                    and storage                                                       333 employees(1)
                    New business: LNG as a fuel for
                    vessel propulsion
           Provides design studies, construction
           assistance and innovative services

              (1)   Excluding interns

                                                                                                         6
Key Highlights
Core business: orders upturn in 2017: 21 new orders vs 5 in 2016 / already 4 since beg. 2018

                                                CORE BUSINESS
              Order book: 89 units                         2017 movements in the order book
71 LNGC/VLEC(1)             2 FLNG
                                                        New orders: 21 (12 LNGC, 8 FSRU, 1 FLNG)
13   FSRU/RV(1)             2 Onshore storage
                                                        Deliveries: 28 (24 LNGC/VLEC, 3 FSRU, 1 FLNG)
 1 Barge

Emergence of LNG fuel: CMA CGM 1st ever LNG Fuel order for GTT (Q4)

                                         NEW BUSINESS (LNG FUEL)

Order book: 9 Ultra Large Container Ships (ULCS)         New orders: 9 ULCS
        Partnerships with Wärtsilä (Finland), DSEC (South Korea) and Cosco Heavy Industries (China)

New service offering
        Global service agreement with Teekay (Q1) and Chevron (Q4)
        Service contract for Shell Prelude FLNG (Q4)

Acquisition of Ascenz (Q4)
        Closing of the transaction: 31 January 2018

Dividend maintained(2) at €2.66 per share                       Notes: LNGC – Liquefied Natural Gas Carrier, VLEC – Very Large Ethane Carrier,
                                                                FSRU – Floating Storage and Regasification Unit, RV – Regasification Vessel,
                                                                FLNG – Floating Liquefied Natural Gas ,ULCS – Ultra Large Container Ships
                                                                (1) Including a LNGC order conversion into a FSRU order
                                                                (2) Subject to AGM approval

                                                                                                                                                 7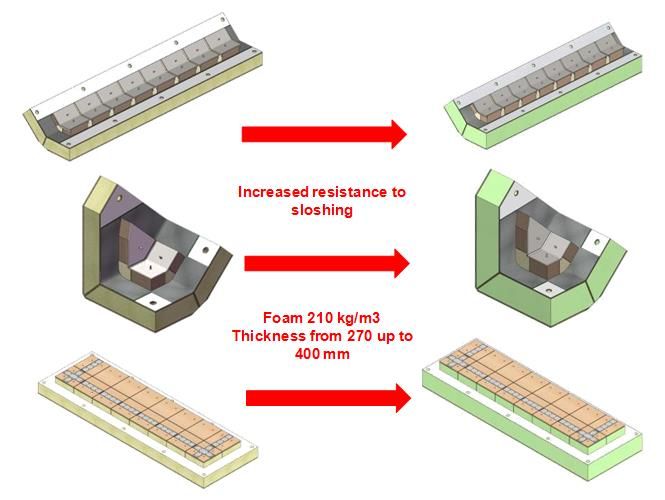
2
Market update

                8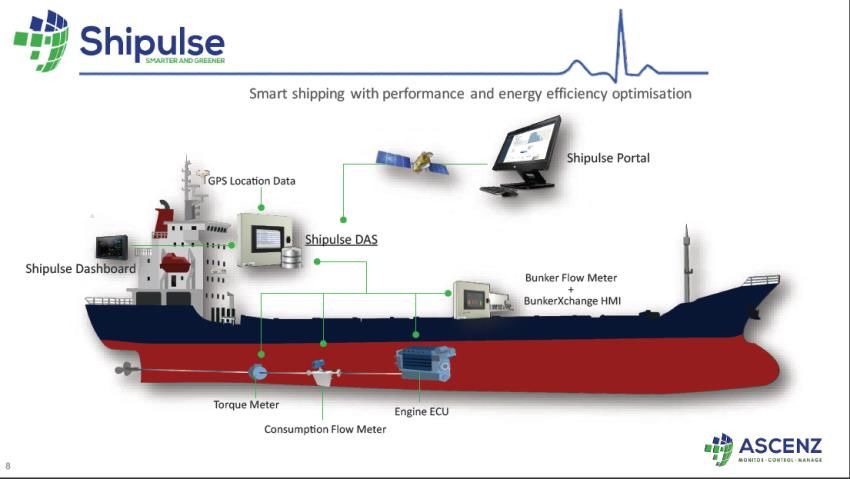
Overall long term outlook bright for gas and LNG

            Gas share in the energy mix                                    LNG share in total gas trade

40%

30%                                                      Oil
                                                          Gas
                                                          Coal
20%

10%                                                     Bioenergy

                                                          Nuclear
                                                       Renewables
                                                         Hydro
0%
  2000 2005 2010 2015 2020 2025 2030 2035

Gas is the only fossil energy to                                    Gas is increasingly exported thanks to
increase share in the energy mix                                    LNG
      Gas is expected to exceed coal by 2035                                    LNG to overpass pipeline trade by
      Drivers: environmental properties, price                                  2035
      and availability                                                           Driver: greater flexibility

              Source: AIE (World energy outlook, GTT                  Source: BP base case 2017 & 2016

                                                                                                                    9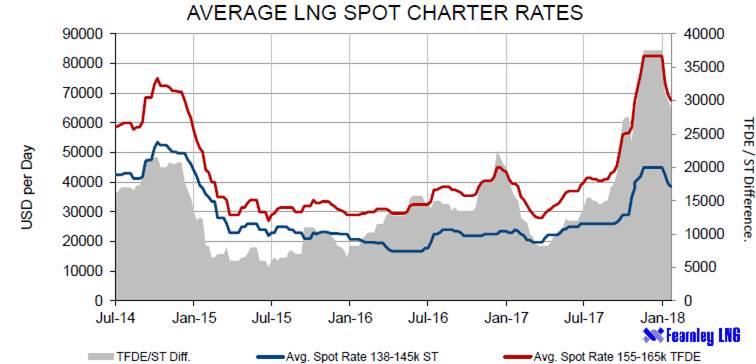
LNG Supply & Demand could balance from early 2021
                                    LNG Supply & Demand balance forecast
        450

        400

        350

        300

        250
 mtpa

        200        Demand adjustment due to low
                    prices and FSRUs availability       Intermediate         No demand adjustment
                                                          scenario
                                                                              S&D balance in 2022
        150          S&D balance in early 2021

        100

         50

          0
           2018   2019          2020             2021          2022        2023          2024       2025         2026             2027

                            Supply - Operationnal               Supply - Under Construction         Demand
                                                                                                             Sources: Wood Mackenzie ; GTT Analysis

          Thanks to a vigorous demand, the expected oversupply by 2021 has reduced vs.
        previous forecasts
          New FIDs are expected in 2018

                                                                                                                                                      10
Asian LNG imports growing in 2017 vs. 2016
due to structural energy mix evolution
Top-5 LNG importers demand comparison 2017 vs. 2016 Demand of top-5 LNG importing
countries (2/3 of imports) grew by
200 47% 50% 11% in 2017 vs. 2016, mainly due
to:
175 Coal to Gas switch, especially in
40% China due to environmental
150
considerations and LNG
competitiveness vs. coal
125
30% Lower nuclear restart, especially in
mtpa
100 Japan due to social and legal
issues
20%
75
12%
50
11% 11% China has over taken South Korea
10% as #2 LNG importer
5%
25New importing countries contribute to demand growth
Incremental LNG demand from new markets
25
+20,7 Mtpa
Colombia
20 Malta Israel Malta
+ 17,9 Mtpa Jamaica Lithuania
Colombia, Poland
Israel
Malta, Lithuania
Malaysia
Jamaica
Poland
15 Malaysia
Singapore
Singapore
Mtpa
Jordan
Jordan
10 + 9,5 Mtpa
Israel
Poland Malaysia Pakistan
Pakistan
Lithuania
Singapore
+ 3,7 Mtpa
5
Jordan
+ 2,6 Mtpa Israel Egypt
Pakistan
Malaysia Lithuania Egypt
Israel
Malaysia Egypt
Singapore
Singapore
0
2013 2014 2015 2016 2017
forecasted
~7% of worldwide demand
40% of the additional demand since 2012
Source : Wood Mackenzie
12US LNG is competitive in Asia
US LNG vs. Asian LNG price depending on Henry Hub and Oil prices
10,0
Asian LNG < US LNG
Asian LNG
9,5
9,0 Asian oil indexed LNG competitive
US LNG competitive
8,5
LNG price - $/Mbtu
HH : $4/Mmbtu
8,0
Spread
HH : $3,5/Mmbtu
7,5
US LNG
HH : $3/Mmbtu
7,0 2017 avg.
2016 avg.
6,5 HH : $2,5/Mmbtu
6,0 HH : $2/Mmbtu
5,5
40 45 50 55 60 65
Main sources: GTT analysis, EIA, Wood Mackenzie Oil price - $/b
2017 avg : JCC = $53/bl and Henry Hub = $3,0/Mmbtu Hypothesis
US LNG ≈ $7.1/Mmbtu US LNG: Asian LNG:
• HH+15% • Slope: 14% of JCC price
Asian LNG ≈ $8.0/Mmbtu • Tolling Fee: 2.25$
• Shipping: 1.43$ (US East ->Japan, 174k
• Constant: 0.5$
cbm Me-GI or X-DF)
13LNG Shipping: spot market recovering trend
Spot chart rates evolution since 2011
Up to $82k/d in end Dec.2017
Estimated breakeven
Recovering trend since 2016
Currently reaching levels not observed for 4 years; above breakeven
14LNG Shipping : c.40 LNGC orders expected from under
construction projects
LNGC requirements for under construction liquefaction projects
Contracted
Forecasted LNGCs
Project Location
Start-Up
Capacity
requirement
12 LNGCs ordered in 2017 confirming
(mtpa)
Cameroon GoFLNG Cameroon Q2-18 1,2 market needs
Wheatstone LNG T2 Australia Q2-18 4,0
Ichthys Australia Q2-18 8,5
Prelude FLNG Australia Q3-18 3,6
Yamal LNG T2 Russia Q4-18 4,9
Still, c.40 LNGCs to secure to lift additional
Elba Island LNG Export USA Q4-18 2,5 volumes
Freeport T1 USA Q1-19 4,6
Corpus Christi LNG T1 USA Q1-19 4,5 Vessels to be ordered mainly by 2018-2019
Cameron LNG Export T1 USA Q2-19 4,0
Cameron LNG Export T2 USA Q3-19 4,0
(2-3 years construction time)
Sabine Pass Export Train 5 USA Q2-19 4,5
Freeport T2 USA Q3-19 4,4
Downside risks:
Corpus Christi LNG T2 USA Q2-19 4,5 Start-up delays and/or slow ramp-up
Yamal LNG T3 Russia Q3-19 4,9
Freeport T3 USA Q1-20 4,4
Additional LNG contracts swapping (shorter
Sengkang LNG Indonesia Q1-20 0,5 routes)
Cameron LNG Export T3 USA Q1-20 4,0 Spot vessels utilization as a bridging solution
PETRONAS FLNG 2 Malaysia Q3-20 -
Tangguh Phase 2 Indonesia Q1-21 3,8
Coral LNG Mozambique Q1-22 3,4
TOTAL 132,4 Wide majority of 2016 and 2017 LNGC
- Current Orderbook*
- Overcapacity**
86,3
9,5
orders were dedicated to projects under
Expected orders 36,7 construction, with some speculative orders
Project ahead of schedule or catching-up
Project in time
reflecting a short/mid term market
Project behind schedule or slowing-down confidence
Projects associated with 2016 – 2017 LNGCs orders
* Vessels on order for currently operational projects not counted
** Recent / Competitive vessels: ≥160k cbm, D/TFDE,Many liquefaction projects ready to be sanctioned soon
in order to accompany demand growth
Several major liquefaction projects in planning phase with a potential FID in 2018
Project Milestones
Capacity Feedgas Concept/
Name Operator Country Environmental Regulatory Participation Marketing Financing
(Mtpa) Availability Engineering
Fortuna FLNG Ophir Eq. Guinea 2.2
Corpus Christi T3 Cheniere USA 4.5
Sabine Pass T6 Cheniere USA 4.5
Golden Pass Golden Pass Prod. USA 15.6
Magnolia LNG LNG Ltd USA 8.0
Cameron Expansion Cameron LNG USA 10.0
Woodfibre LNG Pacific O&G Canada West 2.1
Milestone reached or about to be reached
Progress is being made but details are not finalised
Fortuna FLNG and Corpus Christi T3 are the most likely to be sanctioned in 2018
Note: FID – Final Investment Decision / Main source: Wood Mackenzie
163
Business activity
173.1
Core business
18Core business
GTT 2017 Sales GTT order estimates over 2018-2027
LNGC: 225-240 units
Services 12 orders in 2017
FLNG
6%
1%
FSRU
10%
FSRU: between 30 and 40 units
8 orders in 2017
FLNG: between 5 and 10 units
1 order in 2017
LNGC/VLEC
83%
Onshore tanks: between 5 and 10 units
Courtesy of Shell Courtesy of Excelerate Energy
19LNGCs – Our main business
Vessels equipped for transporting LNG
Existing GTT fleet: 334 units
In order: 71 units
24 construction shipyards under license
Our strengths
Technological leadership, boil-off divided by 2 in the last 5 years
Long term industrial partnerships with major shipyards
A unique position in the LNG ecosystem, nurtured by 50 years of
experience, expertise and customer orientation
20FSRUs – The game changer for new importing countries
Major competitive advantage vs. land-based terminals:
Quick to build/deploy & mobile
Better local acceptability & easier permitting
Affordable / no upfront CapEx
Adapted to more volatile LNG prices
Quality controlled construction in shipyards with available
and skilled workforce Courtesy of Excelerate Energy
FSRUs market outlook
More than 30 FSRUs
currently in service or
under construction
In order: 13 (incl.8 orders
of since January 2017)
Worldwide development
Asia (India, China, …)
Europe (Turkey, Croatia,
…)
South & West Africa
LatAm & Carribeans
Source: GasLog
21FLNGs – the new frontier of the LNG world
Floating units which ensure
treatment of gas, liquefy and store it
Existing GTT fleet: 2 units
In order: 2 units
Courtesy of Shell
Main drivers GTT key advantages
Monetisation of stranded Extended amortization
offshore gas reserves perspectives
Better acceptability (no NIMBY Deck space available for
syndrom) liquefaction equipment
More affordable cost
223.2
New businesses: LNG Fuel
23LNG Fuel focus – CMA CGM order
9 Ultra Large Container Ships with LNG integrated
membrane tanks of 18,600 cbm each
Space optimization
Designed for one bunkering operation per round trip
Mark III Flex technology for the fuel storage system
Sea proven technology
Guaranteed Boil Off Gas
Flexibility to handle and store Boil Off Gas (maximal
pressure of 700 mbarg)
Positive impact on global LNG demand
LNG Consumption of 300,000 tons per year
for the 9 vessels, i.e. eq. 0.1% of LNG global production
24LNG is the only solution allowing comprehensive
environmental compliance
LS HFO ULS HFO MGO /
HFO Scrubber
Pollutant Level (Low Sulfur (Ultra Low Sulfur MDO1 LNG
(Heavy Fuel Oil)
HFO) HFO) (Marine +HFO
Gasoil/Diesel Oil)
3,5%
SOx 0,5%
(Sulfur Oxides)
0,1%
Tier II
NOx2
(Nitrogen Oxides) Except for
Tier III +EGR/SCR3 certain
engines
1) Only DMA and DMB class
2) Depends primarily on engine technology Compliance Yes Under condition No
3) EGR: Exhaust Gas Recirculation ; SCR: Selective Catalytic Reduction
LNG is the only mature solution directly compliant with all environmental regulations
Implementation of NOx reduction in Northern Europe will degrade oil fuel’s and Scrubber’s
competitiveness
25Current LNG Fuel market situation
Total LNG fuel tank by ship type (in service & on order)
4 000
Max
CMA-CGM
3 500 Total LNG
tanks capacity Avg.
3 000 Min
2 500
cbm
2 000
1 500
1 000
Market avg ~750 cbm
500
0
Notes:
• Data available for ~70% of the 237 vessels Source: DNV GL
• CMA-CGM order not counted in
A recent market which has started with small ships and where Type C technology has been preferred
(tugs, ferries, PSV, … with LNG tanks up to several hundreds of m3)
Large vessel segment, where GTT technologies are the most relevant, is just emerging (container
ships, bulkers, … with several thousands of m3 and more)
26LNG Fuel market potential: to be driven by newbuilds
Shipping markets newbuild potential
20 000
Container ships • 3,000+ avg. annual orders (2005-2016)
(ULCS) • Fleet of 90’000+ vessels in 2017
Bulkers
15 000 (VLOC)
Oil Tankers
LNG fuel tanks capacity - cbm
(VLCC)
10 000
PCTC
Cruise ships
5 000 LPG Carriers
Dredgers Ferries
Chemical Tankers
General Cargo Tugs
Plateform Supply Vessels
-
0 100 200 300 400 500 600 700 800 900
Est. maximum LNG fuel tanks capacity – cbm
Historical average annual orders (2005-2016)
Capacity range
Source: GTT analysis, Clarksons
27LNG Fuel market potential for GTT
Historical avg.
Relevant Market Segments
Shipping Markets annual orders Fleet at end 2017
for GTT
(2007-2016)
Tier 1
Container Ships
Bulkers Large to Ultra Large ~320 ~4,700
Oil Tankers
Cruise Ships > 2,000 passengers ~13 ~400
Car & Truck Carriers > 6,000 CEU ~23 ~400
Tier 2
Container Ships
Bulkers Medium to Large ~815 ~13,500
OilTankers
Source: GTT analysis, Clarksons
Global addressable market represents a pool of ~1,170 ships per year (newbuilds)
GTT is particularly focusing on Tier 1 which represents an addressable segment of
~ 360 ships per year
LNG as Fuel penetration will mainly depend on spread between LSHFO and LNG price
28GTT’s LNG Fuel solutions offering
GTT has developed solutions for the main applications of LNG Fuel
Solutions for Container Vessels new build Cruise Ship – optimizing the space for
and retrofit additional passengers
Cost effective solution for bulk carriers Lean bunker barge to
standardize the market
A wide network of partnerships is being set up to benefit from these various opportunities
293.3
Service activity
30Expand innovative services offer: customised services
package fitting industry expectations
© Excelerate Energy
DESIGN CONSTRUCTION OPERATIONS MAINTENANCE UPGRADE
Feasibility studies Materials Training courses Inspections, Engineering
FEED certification and customised maintenance support for retrofit,
On-site technical training simulator and repair conversion, life
assistance assistance extension projects
Gas trials Smart
Smart on-board membrane test
services solutions
Emergency
hotline
On-board
technical
assistance
31Ascenz transaction
Acquisition of 75% of the share capital from founders and several
investment funds
Founders to retain 25% of the share capital and continue to manage the
company
Funded in cash
Transaction closed on 31 January 2018
No significant impact on GTT’s financial structure
Commercial and technical synergies
32Ascenz is a dynamic EMS1 provider
Activities, markets & awards
Based in Singapore, founded in 2008
Provides remote fuel consumption and
bunkering monitoring solutions
Positioned on fast growing markets
Markets : Offshore Supply Vessels (OSV),
container ships, oil and crude carriers,
bulk carriers, bunker ships and gas
carriers (target) – 360+ ships equiped
Recipient of the 2016 Singapore
« Enterprise 50 award » for local
companies excelling in their domain,
Founders nominated as Singapore’s EY
Entrepreneurs of the year 2017
Track record in real time data acquisition
for a fleet of vessels
(1) Energy Management System
33GTT’s strategic roadmap
Gas handling technologies Growth,
Technology,
Superior LNG
Transformation
Fuel Gas handling system for vessels gas handling Advanced decision
systems support systems
Framework service and
maintenance contract
(Shell Prelude)
Courtesy of Shell
Smart shipping
344
Financials
35Order book overview (core business) – IAS 18
Order book in units Order book by year of delivery (units per year)
In units In units
(1)
41
40
120 32 30
96 89
90 21
20 13
60 4 5
0
0
30 2018 2019 2020 2021
As at Dec 31, 2016 As at Dec 31, 2017
As at Dec 31, 2016 As at Dec 31, 2017
Order book in value Revenues expected from current order book (royalties2)
In €M In €M
300
500
426 225
393
200
160
300 124
100
46 38
4 0 6
100 0
As at Dec 31, 2016, As at Dec 31, 2017, 2018 2019 2020 2021
on 2018-2021 on 2018-2021 As at Dec 31, 2016 As at Dec 31, 2017
(1) Delivery dates could move according to the shipyards/EPCs’ building timetables.
(2) Royalties from core business, i.e. excluding LNG as Fuel , services activity.
36Order book overview (core business) – IFRS 15
Order book in units Order book by year of delivery (units per year)
In units In units
(1)
41
40
120 32 30
96 89
90 21
20 13
60 4 5
0
0
30 2018 2019 2020 2021
As at Dec 31, 2016 As at Dec 31, 2017
As at Dec 31, 2016 As at Dec 31, 2017
Order book in value Revenues expected from current order book (royalties2)
In €M In €M
300
500
444
401 223
200
161
300 124
100
47 48
4 0 6
100 0
As at Dec 31, 2016, As at Dec 31, 2017, 2018 2019 2020 2021
on 2018-2021 on 2018-2021 As at Dec 31, 2016 As at Dec 31, 2017
(1) Delivery dates could move according to the shipyards/EPCs’ building timetables.
(2) Royalties from core business, i.e. excluding LNG as Fuel , services activity.
37Consolidated accounts
Consolidated accounts prepared for the first time in 2017
2016 comparatives restated to show consolidated figures
Consolidation perimeter excluding ASCENZ (closing signed on 31 January 2018)
% of interest Consolidation method
Name Activity Country 31-Dec-17 31-Dec-16 31-Dec-17 31-Dec-16
Cryovision Maintenance services France 100,0 100,0 FC FC
Cryometrics On board services France 100,0 100,0 FC FC
GTT Training Training services United Kingdom 100,0 100,0 FC FC
GTT North America Sales office United States of America 100,0 100,0 FC FC
GTT SEA Sales office Singapore 100,0 100,0 FC FC
382017 financial performance
Summary consolidated accounts Key highlights
In € M
Proforma 2017 Change Limited decrease in revenues (-2.3% in FY 2017 vs
2016
-4.7% in H1)
Total Revenues 237.0 231.6 -2,3%
Revenues derived from royalties: -3.9%, still
EBITDA(1) 146.4 142.1 -2.9%
reflecting the difficult market environment in 2016
Margin (%) 61.8% 61.4%
which resulted in a low level of new orders
Operating Income 142.1 138.4 -2.7% +36% increase in Service revenue, mainly thanks
Margin (%) 60.0% 59.7% to good performance of maintenance services
Net income 119.9 116.2 -3.0% Lean cost management
Margin (%) 50.6% 50.2% Reported net margin > 50%
One-off items:
Free Cash Flow(2) 109.0 117.3 +7.6%
CIR claims 2009-11 & 2013: +€3.5 M
Change in Working Provision for tax adjustment: -€15.2 M
32.8 21.3
Capital(3)
Excluding the impact of the tax provision,
Capex 4.5 3.4 -24.0%
increase in net margin ratio from 50.6% to 56.8%
Dividend paid 99.7 98.6 -1.1% (+6pts)
Proforma Low Capex
in € M 31/12/2016 31/12/2017
Change in working capital (+€21.3 M) mainly due to
Cash Position 78.2 99.9 +27,7% cut-off effect (account receivable paid in January)
Working Capital
Cash position up to €100 M despite strong pay-out
-0.5 20.8 (>80%)
Requirement(4)
* 2017 Accounts restated from the impact of provision for tax adjustment
(1) Defined as EBIT + the depreciation charge on assets under IFRS
(2) Defined as EBITDA - capex - change in working capital
(3) Defined as December 31, 2017 working capital – December 31, 2016 working capital
(4) Defined as trade and other receivables + other current assets – trade and other payables – other current liabilities
39Cost base
GTT consolidated operational costs Key highlights
Change
in € M 2016 2017 (%) External costs: -€7.5 M (-17%)
Cost of sales (2.0) (1.8) -10% Subcontractors: -€5.4 M
% sales -1% -1%
Travel costs -€0.8 M
Other external costs -€1.5 M
Subcontracted Test
(18.0) (12.6) -30%
and Studies
Rental and
Insurance
(5.6) (5.8) 4% Staff costs down 5% due to a decrease in
Travel Expenditures (9.4) (8.6) -9% staff count
Other External
(11.3) (9.9) -13%
Costs
Total External
(44.3) (36.8) -17%
Costs GTT 2017 costs(1) by nature
% sales -19% -16%
Staff costs
52%
Salaries and Social
(36.3) (34.3) -6%
Charges External costs
46%
Share-based
(0,9) (0,8) -6%
payments
Profit Sharing (6,0) (6,1) 1%
Total Staff Costs (43.2) (41.2) -5%
% sales -18% -18% Cost of sales
2%
Other(1) 2.4 3.7 nm
% sales 1% 2% (1) Excluding depreciations, amortisations, provisions and impairment of assets
40Dividend
2016 2017
Net income available for distribution
€117.5 M €114.1 M
(French GAAP)
Total dividend
Dividend per share €2.66 €2.66
Total amount paid €99.7 M €98.6 M
90%
€3.00
3,0 Dividend 86% Payout
(1)
amount 84% ratio
60%
€2.00
2,0 1.33 1.33
€1.00
1,0 30%
1.33 1.33
€0.00
0,0 0%
2016 2017
Interim Final Payout
(1) Dividend payout ratio calculated on profit distributed (and possible distribution of reserves) as % of French GAAP net profit for the financial year.
415
Outlook
422018 Outlook
GTT revenue(1) 2018 consolidated revenue estimated in a range of €235 M to €250 M
EBITDA 2018 consolidated EBITDA estimated in a range of €145 M to €155 M
Dividend 2018 dividend amount at least equivalent to 2015 - 2017
Payment(2) 2019 payout of at least 80%
(1) In the absence of any significant delays or cancellations in orders. Variations in order intake between periods could lead to fluctuations in revenues
(2) Subject to approval of Shareholders' meeting. GTT by-laws provide that dividends may be paid in cash or in shares based on each shareholder’s preference
43A wide range of applications integrating GTT technologies
Thank you for your attention
Image courtesy of STX, Engie, Excelerate, SCF Group, Shell, CMA CGM, Matthieu Pesquet, Conrad
44Appendix
45A proactive sustainable development policy
Environmental responsibility Social responsibility
Stakeholders CSR responsibilities form an
Core business integral part of GTT project
Performance of GTT systems Employment
Safety of installations and crew Compensation
New business Training
Development of LNG Fuel
Health and Safety
Services
LNG training sessions for
customers and partners
Societal responsibility
Hotline for shipowners
Continuous and constructive dialogue
GTT with all the LNG stakeholders
Environmental responsibility
at site
46Appendix: a streamlined group and organisation
GTT Group
GTT North America Cryovision GTT Training GTT SEA PTE Ltd Cryometrics
Philippe Berterottière*
Chairman and Chief Executive
Officer
GTT SA organisation
Lélia Ghilini*
General Counsel
Frédérique Marc Haestier* Isabelle Delattre*
Julien Bec David Colson* Karim Chapot*
Coeuille* Finance & Human
LNG as fuel Commercial Technical
Innovation Administration Resources
~16 employees ~24 employees ~172 employees
~93 employees ~30 employees ~10 employees
* Member of the executive committee
47Appendix: GTT exposure to the liquefied gas shipping and
storage value chain
Exploration Off Take /
Liquefaction Shipping Regasification
& Production Consumption
Liquefied Natural Gas LNG fuelled
Offshore Carrier ship
clients: (LNGC)
shipyards Platform /
Gas-to-wire
Installation Floating LNG Production, Floating Storage and
Storage and Offloading Regasification Unit (FSRU)
unit (FLNG)
Barge
Ethane/ multigas
Carriers
Onshore
clients:
EPC Power plant
contractors Onshore storage Onshore storage re- Tank in
liquefaction plant gasification terminal industrial plant
Source: Company data
48Appendix: GTT ecosystem
Oil & Gas
Companies Shipowners
End clients and
End clients and prescribers
prescribers
provides services provides services
and maintenance
Classification
Societies
Regulatory oversight
of the industry
Shipyards
Direct clients
receives new
technology
certification and licences its membrane
approval technology and receives
royalties
provides engineering
studies, on-site technical
and maintenance
assistance
49Important new LNG volumes to hit the market in 2019 and
2020
Contracted supply from liquefaction projects under construction
90
Cameroon GoFLNG
+25
80 mtpa PETRONAS FLNG 2
Elba Island LNG Export
70
Coral FLNG
Prelude FLNG
60
+31 Tangguh Phase 2
mtpa
50 Freeport Train 3
mtpa
Freeport Train 2
40
Sabine Pass Export Train 5
30 Cove Point Export
Freeport Train 1
+12
20 Ichthys
mtpa
Corpus Christi LNG
10
Cameron LNG Export
0 Yamal LNG
2017 2018 2019 2020 2021 2022 2023
Main sources: GTT analysis, Wood Mackenzie
~ +70 Mtpa of contracted supply to come on stream by 2020
New ship orders to be placed from early 2018 to be delivered in late 2019 / early 2020
50GTT membrane technologies
Primary
General principle: membrane
Two membranes
Primary insulation
Two layers of insulations Secondary
membrane
Containment system Secondary insulation
anchored to the inner hull Hull
Mark III system NO96 system
51Focus on GTT’s competitive advantages
GTT’s technology positioning (1)
GTT Moss SPB KC-1
Technology ▶ Membrane ▶ Spherical tank ▶ Tank ▶ Membrane
▶ Requires less steel and
Construction ▶ Slightly higher costs
aluminum than tanks for ▶ Higher costs ▶ Higher costs
costs than GTT
a given LNG capacity
▶ More efficient use of
Operating ▶ Higher opex due to
space ▶ Higher fuel / fee costs ▶ Higher fuel / fee costs
costs BOR (0.16%)
▶ Limited BOR (0.07%)
LNGCs in
▶ 71 ▶ 19 ▶ 4 ▶ 2
construction
LNGCs in
▶ 334 ▶ 111 ▶ 2 small ▶ None
operation
▶ Japanese technology
▶ Higher centre of gravity; ▶ Korean technology with
Other ▶ Value added services developed 25 years ago.
harder to navigate no experience at sea
No significant experience
GTT technologies : cost effective, volume optimisation and high return of experience
Source: Company data and comment (Dec. 31, 2017), Clarksons
(1) Other technologies are being developed, however are not known to have obtained final certification or orders to date (e.g. DSME’s Solidus). Excludes vessel orders below 30,000 m3
52An attractive business model supporting high cash
generation
Invoicing and revenue recognition Business model supports high cash generation
% of contract (1)
c. 18 months c. 18 months Delivery Revenue is recognized pro-rata
studies royalties temporis between milestones
Ship
launching Timing of invoicing and cash
collection according to 5 milestones
Keel laying
Initial payment collected from
Steel cutting
shipyards at the effective date of
order of a particular vessel (10%)
Steel cutting (20%)
Keel laying (20%)
Ship launching (20%)
Months from receipt of order
Delivery (30%)
Cash Negative Working Capital Position
Revenue Positive Working Capital Position
Source: Company
(1) Illustrative cycle for the first LNGC ordered by a particular customer, including engineering studies completed by GTT
53Appendix: track record of high margin and strong increase
in backlog since 2010
2008 2011
Economic crisis Fukushima
US shale gas boom
120 112 66 30 18 52 77 99 114 118 96
47
44
37
34 35
26
Evolution of new 19
GTT orders (1)(2)
7
4 5
1
2006 2007 2008 2009 2010 2011 2012 2013 2014 2015 2016
Backlog (# of orders)
LNGC/VLEC FSRU/FLNG Onshore storage Barge
65% 64%
57%
55%
52% 51%
51%
42% 44%
Evolution of 31% 33%
revenue (in € M) 222
251
218 227 226 236
and net margin (4) 163
142
75 89
56
2006 2007 2008 2009 2010 2011 2012 2013 2014 2015 2016
Revenue Net Margin
Source: Company
(1) Orders received by period
(2) Excl. vessel conversions
(3) Represents order position as at December based on company data, including LNGC, VLEC, FLNG, FSRU and on-shore storage units
(4) Figures presented in IFRS from 2010 to 2015, French GAAP from 2006 to 2009
54Contact: information-financiere@gtt.fr / +33 1 30 23 20 87
You can also read