Evolution and Human Behavior
←
→
Page content transcription
If your browser does not render page correctly, please read the page content below
Evolution and Human Behavior 42 (2021) 104–112
Contents lists available at ScienceDirect
Evolution and Human Behavior
journal homepage: www.elsevier.com/locate/ens
Need-based transfer systems are more vulnerable to cheating when
resources are hidden
Scott Claessens a, *, Jessica D. Ayers b, Lee Cronk c, Athena Aktipis b, d, e, f, g
a
School of Psychology, University of Auckland, New Zealand
b
Department of Psychology, Arizona State University, US
c
Department of Anthropology, Rutgers University, US
d
Center for Evolution and Medicine, Arizona State University, US
e
Arizona Cancer Evolution Center, Arizona State University, US
f
Biodesign Center for Biocomputation, Security and Society, Arizona State University, US
g
Interdisciplinary Cooperation Initiative, Arizona State University, US
A R T I C L E I N F O A B S T R A C T
Keywords: Need-based transfer systems pool risk among interdependent individuals. Such arrangements are bound by two
Need-based transfers simple rules: Ask for help only when in need and, if you are able, give help to others who ask. But there may be a
Cooperation temptation for individuals to break these rules for short-term personal profit. Here, we study one factor that may
Risk pooling
enforce honesty in need-based transfer relationships: the visibility of resources. Across three experiments
Cheating
employing a novel experimental economic game, breaking of both need-based transfer rules increased when
Free-riding
resources were hidden rather than visible (Experiment 1: n = 82, online convenience sample from the US;
Experiment 2: n = 80, student sample from the US; Experiment 3: n = 42, online convenience sample from the
US). Participants with hidden resources were (1) more likely to request help when not actually in need
(greediness), and (2) more likely to not fulfill requests from others for help, even when they had sufficient re
sources available to help (stinginess). These findings highlight the visibility of resources as one potential limi
tation of cooperative risk pooling systems.
1. Introduction 1985; Gurven, Hill, & Jakugi, 2004; Kaplan & Hill, 1985). This risk
pooling is mirrored in modern human societies, with cross-cultural ex
Humans often inhabit unpredictable, volatile environments. In such periments showing that people are more likely to share resources ac
risky environments, people are vulnerable to such unforeseen events as quired with high unpredictability, such as windfall monetary rewards
earthquakes, hurricanes, droughts, and diseases that may drastically (Kameda, Takezawa, & Hastie, 2003; Kameda, Takezawa, Tindale, &
reduce or entirely wipe out accumulated resources. Evolutionary theory Smith, 2002; Kaplan, Schniter, Smith, & Wilson, 2012). Many hunter-
suggests that, under conditions like these, cooperative systems of mutual gatherer groups also have partnership systems that function to pool
aid can evolve between interdependent individuals who rely on one the risks associated with shortages in food or water, such as hxaro
another to survive (Aktipis et al., 2018). sharing relationships among the Ju/’hoansi of Namibia and Botswana
One such cooperative system is risk pooling: taking on some of (Wiessner, 1982). In a hxaro partnership, if one individual experiences a
another party’s risk in exchange for their willingness to take on some of shortage of food or water, they can ask their partners in unaffected areas
one’s own risk (Cashdan, 1985; Dorfman, 2007). Humans across the for help.
world pool risk to deal with unpredictable ecological challenges (Cronk, The current study finds its inspiration in a system of cooperative risk
Berbesque, et al., 2019). For example, hunter-gatherer groups engage in pooling found among the Maasai of East Africa. Maasai pastoralists own
egalitarian food sharing at centralised locations to pool the risk associ large herds of cattle, sheep, and goats, but in the volatile ecology of the
ated with hunting highly variable large-game food items (Cashdan, African savannah these herds may be hit by drought, disease, or theft at
* Corresponding author at: School of Psychology, University of Auckland, Auckland, New Zealand.
E-mail addresses: s.claessens@auckland.ac.nz (S. Claessens), jdayers@asu.edu (J.D. Ayers), lcronk@anthropology.rutgers.edu (L. Cronk), aktipis@asu.edu
(A. Aktipis).
https://doi.org/10.1016/j.evolhumbehav.2020.08.004
Received 20 January 2020; Received in revised form 9 August 2020; Accepted 11 August 2020
Available online 15 August 2020
1090-5138/© 2020 Elsevier Inc. All rights reserved.
S. Claessens et al. Evolution and Human Behavior 42 (2021) 104–112
any time. Osotua, a Maasai gift-giving system, acts to pool these risks 2. Experiment 1
with others. Literally translated as ‘umbilical cord,’ osotua is charac
terised by transfers of livestock between social partners with no expec 2.1. Methods
tation of repayment. Two very simple rules underlie osotua stock
friendships. Rule 1: ask for livestock only if you are in need. Rule 2: give 2.1.1. Participants
livestock if you are asked and able to do so without threatening your We recruited 100 participants on Amazon Mechanical Turk
own survival. Recent agent-based models of these computationally (http://www.mturk.com; henceforth MTurk). This sample size was
simple rules have shown that they lead to successful risk pooling in chosen as the largest feasible sample size for interactive online sessions
volatile environments, increasing average herd survival compared to on MTurk. Eighteen participants dropped out (6 could not be connected
rules involving debts and repayments. The reason for this is simple: to a partner, and 12 abandoned the game due to long wait times),
agents following a debt-based rule end relationships with those to whom leaving a final sample of 82 participants (41 females). All participants
they have given resources if recipients do not repay loans within a fixed were over 18 years old (M = 36 years, SD = 9 years, range = 20–62
number of rounds. As a result, agents following a debt-based strategy years) and from the United States. To qualify for the experiment, par
have fewer other agents from whom they can request help when they are ticipants were required to have had at least 50 HITs (Human Intelligence
at risk of falling below the threshold for survival. In contrast, agents Tasks) approved on MTurk, with a HIT approval rating of 97% and
following a need-based strategy maintain all their relationships because above. Participants did not have prior experience with the game or its
they expect to be repaid only if they themselves are in need (Aktipis purpose prior to participating in the experiment.
et al., 2016; Aktipis, Cronk, & de Aguiar, 2011; Hao, Armbruster, Cronk,
& Aktipis, 2015). 2.1.2. Procedure
Could these principles of need-based transfers be applied outside of Participants played an interactive incentivised economic game in
the Maasai, to resources other than livestock? For example, other small- real-time with one other participant on MTurk, run using the software
scale societies may measure their wealth in cash or small game animals oTree (Chen, Schonger, & Wickens, 2016). Before the game, participants
rather than large herds. However, there is a key difference between first read a consent form, provided some basic demographic information
these different subsistence types. On the one hand, herds of cattle, sheep, (age, gender, and primary language), and read some instructions about
and goats are visible to all risk-pooling partners. This observability the game that included information about their payment. After reading
makes both genuine need and an inability to help difficult to fake, and so about the experimental manipulation, participants completed an
cheating is discouraged. On the other hand, money and small game are example round of the game with the computer and answered several
concealable. With these kinds of resources, need and inability to help comprehension questions about the game to test their understanding.
become fakeable, and so cheating is likely to increase. Cheating can Participants were paid $0.02 for each comprehension question they
undermine the evolution and maintenance of stable cooperative systems correctly answered, but they had unlimited tries to get these questions
(Nowak, 2006). If cheating is frequent enough, the need-based transfer right. Participants were also paid for waiting to be connected to a
system will collapse and fail as a viable risk pooling relationship. partner ($0.05 per minute, maximum 10 min waiting time).
Here, we ask whether the visibility of resources affects the proba In this game, players managed a herd of cattle over time. Each round
bility of cheating in need-based transfer relationships. Lab and field acted as a ‘year’ of time. Both players began the game with 70 cattle.
experiments have previously shown that anonymity increases cheating Each year, their herds grew by a multiplication factor drawn indepen
in public-goods scenarios (Hardy & Van Vugt, 2006; Yoeli, Hoffman, dently from a Gaussian distribution (M = 0.034, SD = 0.0253). From this
Rand, & Nowak, 2013). This is the first empirical exploration of factors distribution, negative growth was possible but rare (9% probability of
that increase cheating in need-based transfer systems. Cheating takes negative growth). Herds were also subject to random disasters that
subtly different forms in public-goods versus need-based transfer sys occurred with 20% probability each year. If a disaster occurred, the
tems. In public-good provisioning or traditional social contract sce player’s herd decreased by a multiplication amount drawn indepen
narios, cheating involves receiving a benefit without paying a required dently from a separate Gaussian distribution (M = 0.15, SD = 0.05).
cost (Cosmides & Tooby, 1992). In need-based transfer systems, how Gaussian distribution parameters for births and deaths replicated those
ever, cheating is more nuanced: individuals can break one or both of the used in previous modelling work (Aktipis et al., 2011), which were
underlying rules by (1) asking for help when not in need (i.e., greedi themselves drawn from real data on East African pastoralists (Dahl &
ness) and/or (2) refusing to give when asked and able (i.e., stinginess). Hjort, 1976).
We hypothesise that both kinds of cheating should increase in frequency After these births and deaths, players had the opportunity to ask their
when resources are concealable. partners for cattle and respond to their partner’s request. If participants
Cronk, Aktipis, et al. (2019) ran an experiment in which participants stated that they would like to ask for help, they then specified how many
were paired with each other and given resources that grew but were also cattle they wanted to ask their partner for (any positive number). Their
occasionally hit by disasters. Participants could see their own resources partner then saw the request and could transfer any cattle amount they
and those of the other player at all times, and they did share resources wanted to (anything from nothing to their current herd size).
with each other in patterns consistent with a need-based transfer system. After cattle transfers were completed, the year ended. Players were
To investigate whether the visibility of resources affects the propensity required to keep their herds above the minimum survival threshold of 64
to cheat in need-based transfer systems, we created a simplified version cattle at the end of every year. If their herd size was beneath this
of that experimental economic game to simulate the lives of Maasai threshold, red warning text appeared notifying the player that they had
pastoralists. In a live interaction, pairs of individuals manage herds of three years to increase their herd size above the threshold or they would
cattle. Their herds grow over time, but are also subject to unpredictable ‘die’ and be removed from the game. A player whose partner died could
disasters, potentially reducing their herd size below a minimum survival continue playing and earning money but could no longer ask anyone for
threshold. Individuals must request help from their partners to survive. cattle. The game lasted for 25 rounds, though to avoid endgame effects
We manipulated whether or not individuals could observe the resource participants were informed only that the game would last somewhere
holdings of their partner during the game. We predicted that the prob between 20 and 30 rounds.
ability of cheating would increase for both need-based transfer rules On average, participants spent 23 min completing the experiment
when resources were hidden as opposed to when they were visible. (SD = 8 min, range = 8–45 min). If a participant’s partner dropped out
during the game (i.e., stopped responding), the game could not proceed,
but participants were given the option to quit the game and skip to the
end if they had to wait too long. Participants were paid a show-up fee of
105
S. Claessens et al. Evolution and Human Behavior 42 (2021) 104–112
USD $1.00 for participating and could earn bonus payments according accordance with our between-subjects design. Intercepts and slopes for
to their performance (total number of cattle at the beginning of each the round number were included as random effects, grouped by partic
year, $0.01 per 10 cattle). On average, participants earned $2.81 in total ipants nested within dyads. Estimated parameters are reported on the
(SD = $0.69, range = $1.39–$4.02). All study materials, including code log odds scale, and 95% CIs are credible intervals for posterior distri
and instructions for the economic game, can be found at https://osf. butions. We report Bayes factors (BFs) for comparisons of posterior
io/wt2mq/. predicted probabilities between conditions, applying conventional cut
offs: below 0.33 (moderate support for the null hypothesis that the
2.1.3. Design probabilities are equal) and above 3 (moderate support for the alter
The experiment consisted of two between-subjects conditions: (a) a native hypothesis that the probabilities differ; Lee & Wagenmakers,
control condition, where resources in the game were visible (n = 42), 2014).
and (b) an experimental condition, where resources in the game were In addition to these main analyses, we also report exploratory ana
hidden (n = 40). Participants learned about their condition before being lyses of additional dependent variables: (1) herd sizes when requesting,
connected to another player. Those in the visible condition were (2) number of cattle requested, (3) differences between amount
informed that their herd size would be visible to their partner at every requested and amount required to reach the minimum survival
stage of the game and, likewise, that they would always be able to see threshold, (4) differences between amount given and amount requested
their partner’s herd size. They were also told that the occurrence of by partner, and (5) survival rate.
disasters would be visible to all players. Conversely, those in the hidden All statistical analyses were conducted in R v3.6.1 (R Core Team,
condition were informed that their herd size would never be visible to 2018) using the brms package (Bürkner, 2017). Hamiltonian Monte
their partner and that they would never be able to see their partner’s Carlo estimation was run with Stan (Stan Development Team, 2018). All
herd size. They were also told that the occurrence of disasters would models converged normally (R-hatS. Claessens et al. Evolution and Human Behavior 42 (2021) 104–112
2.2. Results visible condition would have survived 27 rounds (median) while those
in the hidden condition would have survived 50 rounds (β = 0.60, 95%
2.2.1. Breaking of rule 1: do not ask for cattle unless you are in need CI [− 0.28 1.51], median posterior difference = 19.24 rounds, 95% CI
To determine whether individuals broke the first rule of need-based [− 10.89 138.26]). This is the opposite direction as expected, with in
transfers when resources were hidden as opposed to visible, we esti dividuals surviving for longer when resources can be hidden, although
mated the probability of making a request while above the minimum the 95% credible intervals crossing zero indicates considerable uncer
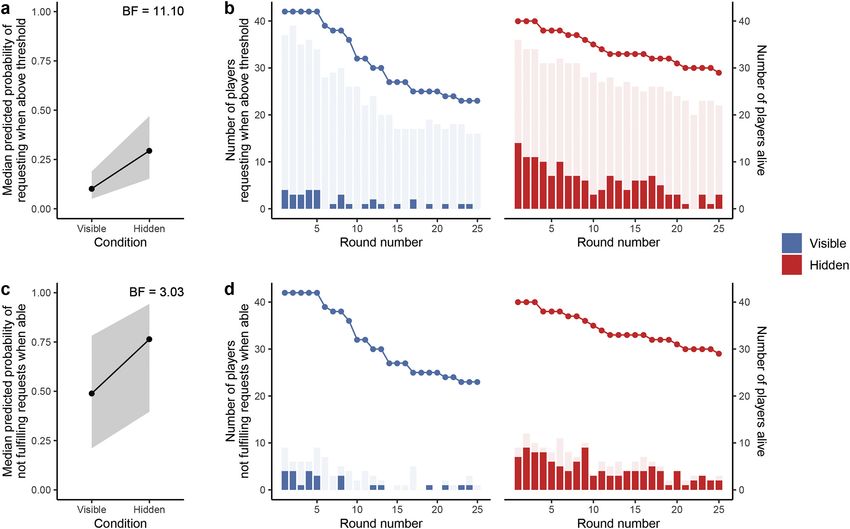
survival threshold (i.e., greediness) in each condition. Logistic regression tainty in this estimate.
revealed that the probability of making a request when above the
threshold was greater in the hidden condition than the visible condition 2.3. Discussion
(β = 1.30, 95% CI [0.37 2.15]). The model predicts that, when above the
minimum threshold, individuals in the visible condition request from These results suggest that individuals are more likely to break the
their partner with median probability 0.10. In the hidden condition, this rules of need-based transfers when resources can be hidden from their
probability increases to 0.29 (median posterior probability difference = partners compared to when resources are visible. Participants in the
0.19, 95% CI [0.05 0.35], BF = 11.10; Fig. 1a and b). Participants in the hidden condition were more likely to request from their partners when
hidden condition were almost three times as likely to request resources they were not in need, had more cattle when requesting, and requested
when they were not in need compared to participants in the visible more cattle. The data also suggest that participants were more likely to
condition. We also found that greediness declined over the rounds (β = not fulfill the requests of their partners (if they could safely do so) in the
− 0.12, 95% CI [− 0.19 –0.05]) likely because participants accumulated hidden condition, but if they did attempt to fulfill the requests they then
cattle as the game progressed and so felt less need to cheat. gave less cattle than was asked of them. In other words, participants
were greedier and stingier in the hidden condition. In order to ensure
2.2.2. Breaking of rule 2: give cattle if you are asked and able that these findings held under more controlled settings, we next
Next, we asked whether individuals broke the second rule of need- attempted to replicate this experiment under laboratory conditions with
based transfers when resources were hidden as opposed to visible. We a within-subjects design.
estimated the probability of not fulfilling a request (i.e., giving less than
what was asked) when the participant was able to do so without going 3. Experiment 2
beneath the minimum survival threshold themselves (i.e., stinginess).
Logistic regression revealed that the probability of not fulfilling a 3.1. Methods
request when able was slightly greater in the hidden condition (β = 1.22,
95% CI [− 0.34 2.76]) and declined over the rounds (β = − 0.10, 95% CI 3.1.1. Participants
[− 0.32 0.06]), though these credible intervals crossed zero. The model 80 Arizona State University students (27 female) were recruited to
predicts that, when individuals are asked for cattle and able to give that participate in the experiment, all of whom were over 18 years old (M =
amount, the median probability of not fulfilling the request is 0.49 in the 21 years, SD = 5 years, range = 18–55 years). This sample size was
visible condition and 0.76 in the hidden condition (median posterior deemed appropriate as it was sufficient to estimate the effects of con
probability difference = 0.25, 95% CI [− 0.08 0.54], BF = 3.03; Fig. 1c dition in Experiment 1. Participants did not have prior experience with
and d). However, the wide credible intervals suggest that these model the game or its purpose prior to participating in the experiment.
predictions are uncertain. Thus, the model tentatively suggests that
participants are stingier in the hidden condition than the visible 3.1.2. Procedure and design
condition. Experiment 2 was largely identical to Experiment 1, with a few
important changes. First, participants completed the experiment in the
2.2.3. Exploratory analyses laboratory, rather than online. All participants arrived at a waiting area
Further exploring greedy behaviour, we found that participants in prior to their scheduled participation time and were asked to refrain
the hidden condition had more cattle in stock when they decided to from communicating. If there was an odd number of participants, one
request from their partner (median 71 cattle) than participants in the participant was asked to reschedule. Participants were then seated at
visible condition (median 66 cattle; median posterior difference = 4.98, computers one-at-a-time and truthfully informed that (1) they would be
95% CI [1.38 8.54]). Participants in the hidden condition also requested playing a two-person computer game with a participant in another
slightly more cattle on average than participants in the visible condition room, (2) the research assistant did not know who their partner was, and
(median posterior difference = 1.12 cattle, 95% CI [− 0.07 2.40]), (3) they would not be told who their partner was during the game.
though this credible interval crossed zero. When below the minimum Second, unlike Experiment 1, participants played two games in the same
survival threshold, participants in the hidden condition requested more session rather than just one. We utilised a within-subjects design,
cattle than necessary to reach the threshold (median posterior difference randomly counterbalancing the order of the visible and hidden games.
between amount requested and amount required = 2.18, 95% CI [0.50 Participants were informed that they would play both games with the
3.88]). In contrast, participants in the visible condition requested just same partner. Third, participants were compensated for their time
enough cattle to reach the threshold (median posterior difference = differently. In Experiment 1, MTurk participants were paid directly for
− 0.33, 95% CI [− 1.72 1.16]). their performance in the game. Here, participants received either course
Exploring stingy behaviour, we found that participants in the hidden credit or a flat $8 payment (plus a $4 fee if asked to reschedule).
condition gave on average 3 cattle less than their partner asked for However, to continue incentivising play in the games, we truthfully
(median posterior difference between amount given and amount informed participants that their performance would also determine the
requested by partner = − 3.13, 95% CI [− 4.34 –1.91]). In contrast, number of tickets entered into a raffle on their behalf for a $20 gift
participants in the visible condition tended to give the amount that was voucher that they could win after data collection had been completed.
asked (median posterior difference = − 1.00, 95% CI [− 2.26 0.19]). On average, participants spent 32 min completing the experiment (SD =
To explore variation in survival rate, we also conducted survival 7 min, range = 15–49 min).
analysis, a regression method that estimates the survival rate while ac
counting for the right-censored nature of the data (i.e., right-censored 3.1.3. Statistical analysis
participants survived all 25 rounds, the maximum amount, but may The same Bayesian mixed-effects logistic regressions from Experi
have died if the game had continued). This analysis predicted that, if ment 1 were fitted to the data. However, slopes for condition were
participants were allowed to play for more than 25 rounds, those in the included as random effects, grouped by participants nested within
107S. Claessens et al. Evolution and Human Behavior 42 (2021) 104–112 dyads, in accordance with our within-subjects design. As before, esti indicating an increase in greediness in the expected direction. These mated parameters are reported on the log odds scale, 95% CIs are hidden-first participants were almost three times as likely to request credible intervals for posterior distributions, and Bayes factors deter when above the threshold in the hidden condition compared to the mine whether posterior predicted probabilities are different or equal visible condition. across conditions. All models converged normally (R-hat
S. Claessens et al. Evolution and Human Behavior 42 (2021) 104–112
exploratory analyses only for participants who played the hidden game 4. Experiment 3
first. Exploring greedy behaviour, we found no difference between
conditions in the amount of cattle in stock when deciding to request 4.1. Methods
(median hidden condition = 65 cattle; median visible condition = 63
cattle; median posterior difference = 2.03, 95% CI [− 1.81 5.71]). There 4.1.1. Participants
was also no difference between conditions in the amount requested We recruited 98 participants on the online platform Prolific
(median posterior difference = − 0.66, 95% CI [− 1.91 0.60]), and par (http://prolific.ac). This sample size was deemed appropriate as it was
ticipants in both conditions requested just enough to reach the minimum sufficient to estimate the effects of condition in the previous experi
survival threshold (median difference between amount requested and ments. 14 participants dropped out (5 could not be connected to a
amount required: visible = 0.09, 95% CI [− 0.92 1.14]; hidden = 0.62, partner, and 9 abandoned the game due to long wait times), leaving a
95% CI [− 0.34 1.64]). final sample of 84 participants (51 females). All participants were over
Exploring stingy behaviour, we found that participants in the visible 18 years old (M = 31 years, SD = 10 years, range = 18–65 years) and
condition gave on average 0.61 cattle less than their partner asked for from the United States. To qualify for the experiment, participants were
(median difference between amount given and amount requested by required to have a minimum 95% approval rate on Prolific. Participants
partner = − 0.61, 95% CI [− 1.16 –0.02]). Participants in the hidden did not have prior experience with the game or its purpose prior to
condition gave on average 2.40 cattle less than asked for (median dif participating in the experiment.
ference between amount given and amount requested by partner =
− 2.40, 95% CI [− 3.33 –1.47]), fewer than in the visible condition 4.1.2. Procedure and design
(median difference between conditions = − 1.79, 95% CI [− 2.66 Participants were paid a show-up fee of $3.25 for participating and
–0.99]). could earn bonus payments throughout. On average, participants earned
Survival analysis revealed that participants in the hidden condition $4.99 in total (SD = $0.75, range = $3.70–$6.13). Experiment 3 was
died at a faster rate than participants in the visible condition. This identical to Experiment 1, except that the visibility of resources was
analysis predicted that, if participants were allowed to play for more manipulated for Player 2 only in each dyad. Player 1’s resources were
than 25 rounds, those in the hidden condition would have survived 28 always visible. In a between-subjects design, this resulted in (a) a control
rounds (median) while those in the visible condition would have sur condition where Player 2’s resources were visible (number of Player 2s
vived 81 rounds (median posterior difference = − 47.15 rounds, 95% CI = 20), and (b) an experimental condition where Player 2’s resources
[− 489.13 –1.18]). Unlike Experiment 1, this result is in the expected were hidden (number of Player 2s = 22).
direction.
4.1.3. Statistical analysis
3.3. Discussion As before, Bayesian mixed-effects logistic regressions were fitted to
the data. Because Player 1’s resources were always visible and we
The results of this laboratory experiment replicate and extend the manipulated whether Player 2’s resources were visible or not, we ana
findings from Experiment 1. Again, we find that individuals are more lysed data for Player 2s only. Estimated parameters are reported on the
likely to break the rules of need-based transfers when resources can be log odds scale, 95% CIs are credible intervals for posterior distributions,
hidden from their partners, compared to when resources are visible. and Bayes factors determine whether posterior predicted probabilities
Interestingly, however, this effect only holds when individuals have no are different or equal across conditions. All models converged normally
prior experience with a partner (i.e., they play the hidden game first). (R-hatS. Claessens et al. Evolution and Human Behavior 42 (2021) 104–112
Fig. 3. Stinginess in Experiment 3 (Prolific). (a) Median model-predicted probability of Player 2 not fulfilling a request when able to do so without dropping
beneath the minimum survival threshold (i.e., stinginess) with shaded 95% posterior credible intervals. (b) Lines represent the number of Player 2s alive in the game.
Light bars represent the number of Player 2s able to fulfill their partner’s request without dropping beneath the threshold. Dark bars represent the number of Player
2s who do not fulfill their partner’s request when able. Code to reproduce this plot at https://osf.io/wt2mq/.
However, we did not find any evidence that the experimental conditions food from hunts to other camp members (Peterson, 1993). While in
affected the survival rate of Player 2s (median posterior difference in dividuals could free-ride on demand-sharing arrangements by refusing
rounds survived = − 6.96 rounds, 95% CI [− 410.83 75.01]). to give and hiding resources, such cheating is made difficult by the
visibility of large game. However, increased monetisation in egalitarian
4.3. Discussion societies has often led to the collapse of such demand-sharing systems.
For example, after traders began buying meat from Mbuti hunter-
In this final experiment, Player 1’s resources remained visible while gatherers, the amount of meat shared within camps decreased (Ichi
the visibility of Player 2’s resources was manipulated. We found that kawa, 1991). Similarly, the introduction of cash and commoditization
there was a slight increase in the probability of stinginess among Player into Baka communities in Southeastern Cameroon encouraged market
2s when their resources were hidden, even when Player 1’s resources economy exchange and money hoarding, resulting in declines in
remained visible. Although uncertain due to the small sample size in our demand-sharing of meat (Kitanishi, 2006; Townsend, 2015). Thus, when
restricted analyses, this effect size is comparable to that found in pre resources become easily concealed, as monetisation allows, cooperative
vious experiments. Player 2s in the hidden condition, but not the visible risk pooling arrangements can be difficult to maintain.
condition, also gave less than their partner asked for. These results We expected that the same effect would occur in our economic game:
suggest that simply manipulating the visibility of one’s resource hold hidden resources would result in the complete collapse of the need-
ings, even when others’ are visible, is enough to induce stingy behav based transfer system. However, while the probability of cheating ten
iour. In other words, this experiment tentatively supports the cheating ded to increase when resources could be hidden, participants in the
hypothesis of stingy behaviour over the suspicion hypothesis. hidden condition gave at least some cattle to their partners (otherwise
the probability of stinginess would be 100% in the hidden condition
5. General discussion across all experiments). Why didn’t the cooperative system collapse
entirely when resources could be hidden? This is likely because in
In volatile environments, need-based transfer systems such as osotua dividuals were still aware that they were interdependent with their only
allow individuals to pool risk with others (Aktipis et al., 2011; Aktipis risk pooling partner (Aktipis et al., 2018; Roberts, 2005) and that some
et al., 2016; Hao et al., 2015). Two simple rules underlie such re cattle transfers must still occur if they were to survive the game. Thus, at
lationships: (1) ask only when in need and (2) give when asked and able. least in dyads, there is a conflict between breaking the rules to earn the
But, as with any social dilemma, the temptation to break these rules and most short-term profit and ensuring that one’s partner survives to keep
exploit the generosity of others is ever present. Here, we found that them available as a long-term risk pooling partner. However, this ten
people were more likely to break need-based transfer rules when re sion may be lessened, and the probability of cheating increased, if in
sources were hidden as opposed to visible. When others could not dividuals have more outside options (i.e., group size >2), as the target of
evaluate their resource holdings, individuals tended to be greedier (i.e., any cheating is just one of many interdependent risk pooling partners.
more likely to ask for help even when they were not in need) and stingier Future research could test this prediction by extending our methodology
(i.e., more likely to not fulfill requests from their partner even if they to larger groups of players.
could do so without going under the survival threshold themselves). Need-based transfer systems are predicted to improve survival rates
These results are in line with previous empirical work on cheating in in harsh ecologies. If the rules of need-based transfers are being broken
public-goods provisioning (Hardy & Van Vugt, 2006; Yoeli et al., 2013) when resources are hidden, it follows that survival rate should also
and evolutionary modelling showing that the possibility for reputation decrease. However, we found mixed evidence for a link between
management favours the evolution of cooperation (Nowak & Sigmund, resource visibility and survival rate in this study. In Experiment 2, our
2005). Experiment 3 tentatively suggested that stingy behaviour is due survival analysis revealed that participants who played the hidden game
to active cheating and not simply suspicion of one’s partner, but the 95% first died faster in the hidden condition, as expected, but we did not
credible interval for this result crossed zero and so more data will be replicate this finding in Experiments 1 or 3. One potential explanation
needed to confirm this. for these mixed findings is that our simulated ecology was not harsh
These results may explain the collapse of real-world risk pooling enough to measure the beneficial effects of need-based transfer systems
systems when resources can be concealed. Consider, for example, on survival. This is supported by the fact that many participants in our
demand-sharing, a cooperative risk pooling system among foragers in experiments survived all 25 rounds of the game (63% of participants in
which individuals are forced via social pressure to distribute any surplus Experiment 1, 67% in Experiment 2, and 60% in Experiment 3).
110S. Claessens et al. Evolution and Human Behavior 42 (2021) 104–112
Participants in both conditions were also able to stockpile a large Experiment 2 (ref: MOD00008507), and Experiment 3 (ref:
amount of cattle, sometimes ending the game with over double the STUDY00007432).
minimum survival threshold. This limits the conclusions that we can
make regarding the long-term effects of need-based transfer relation Funding
ships on survival. Indeed, simulations of the Maasai need-based transfer
system show that differences in survival between strategies are only This work was supported by the John Templeton Foundation [grant
apparent when volatility rate and volatility size are intermediate; if they number: 46724]. Any opinions, findings, conclusions, or recommenda
are not harsh enough, all individuals survive and no differences can be tions expressed in this article are those of the authors and do not
seen among the strategies (Aktipis et al., 2016). Although our chosen necessarily reflect the views of the John Templeton Foundation. The
game parameters were based on real data on African pastoralist soci John Templeton Foundation had no involvement in study design; in the
eties, future studies could systematically vary the harshness of the collection, analysis and interpretation of data; in the writing of the
simulated ecology (e.g. increasing the probability of disasters, reducing report; or in the decision to submit the article for publication.
the birth rate every year) and increase the number of rounds to better
study the effects of need-based transfers on survival. Declaration of Competing Interest
Despite the temptation to cheat, several mechanisms may stabilise
need-based transfer systems with easily concealable resources. First, as The authors declare that they have no known competing financial
highlighted by Experiment 2, repeated interactions can develop trust interests or personal relationships that could have appeared to influence
between individuals, reducing the temptation to cheat later. Such the work reported in this paper.
repeated bond-based transfers, as seen in gifts between Ju/’hoansi hxaro
partners (Wiessner, 1982), establish and maintain relationships between References
risk pooling partners. Second, cultural evolution may imbue need-based
transfer systems with religious or spiritual significance, such as sacred Aktipis, A., Cronk, L., Alcock, J., Ayers, J. D., Baciu, C., Balliet, D., … Winfrey, P. (2018).
Understanding cooperation through fitness interdependence. Nature Human
ness (Cronk & Aktipis, 2018; Norenzayan et al., 2016). Consider, for
Behaviour, 2(7), 429–431. https://doi.org/10.1038/s41562-018-0378-4.
example, the Ik of Uganda. As small-scale farmers, hunters, and gath Aktipis, A., Cronk, L., & de Aguiar, R. (2011). Risk-pooling and herd survival: An agent-
erers, what few resources the Ik possess are much easier to hide than the based model of a Maasai gift-giving system. Human Ecology, 39(2), 131–140. https://
doi.org/10.1007/s10745-010-9364-9.
livestock of the Maasai. Nevertheless, they do have a strong ethic of
Aktipis, A., de Aguiar, R., Flaherty, A., Iyer, P., Sonkoi, D., & Cronk, L. (2016).
sharing with those in need. This is supported by an Ik belief that the Cooperation in an uncertain world: For the Maasai of East Africa, need-based
landscape is inhabited by earth spirits known as kijawikå. The Ik believe transfers outperform account-keeping in volatile environments. Human Ecology, 44
that the kijawikå bring misfortune to people who fail to share with (3), 353–364. https://doi.org/10.1007/s10745-016-9823-z.
Bürkner, P.-C. (2017). brms: An R package for Bayesian multilevel models using Stan.
others and reward those who are generous. Resources may be hidden to Journal of Statistical Software, 80(1), 1–28. https://doi.org/10.18637/jss.v080.i01.
people, but the kijawikå can be counted on to see them no matter where Cashdan, E. A. (1985). Coping with risk: Reciprocity among the Basarwa of northern
they are (Cronk, Berbesque, et al., 2019). Third, need-based transfer Botswana. Man, 20(3), 454–474. https://doi.org/10.2307/2802441.
Chen, D. L., Schonger, M., & Wickens, C. (2016). oTree-an open-source platform for
systems could require that participants in risk pools reveal their wealth. laboratory, online, and field experiments. Journal of Behavioral and Experimental
This is the strategy used by Pando, a US company that creates risk pools Finance, 9, 88–97. https://doi.org/10.1016/j.jbef.2015.12.001.
among people in occupations, such as professional baseball, in which it R Core Team. (2018). R: A language and environment for statistical computing. Vienna,
Austria. Retrieved from https://www.r-project.org/.
is difficult to predict who will become very wealthy. In the case of Major Cosmides, L., & Tooby, J. (1992). Cognitive adaptations for social exchange. In
League Baseball, players cannot hide their income because their con J. Barkow, L. Cosmides, & J. Tooby (Eds.), The adapted mind: Evolutionary psychology
tracts are public knowledge. When Pando creates risk pools for people in and the generation of culture (pp. 163–228). New York: Oxford University Press.
Cronk, L., & Aktipis, A. (2018). Sacredness as an implied threat of supernatural
other occupations, they require participants to share their income tax
punishment: The case of need-based transfers. Religion, Brain & Behavior, 8(3),
returns (personal communication). 282–285. https://doi.org/10.1080/2153599X.2017.1302978.
In conclusion, we have shown across several experiments that if re Cronk, L., Aktipis, A., Gazzillo, S., White, D., Wutich, A., & Sopher, B. (2019). Common
knowledge promotes risk pooling in an experimental economic game. PLoS One, 14
sources are hidden, individuals are greedier and stingier in economic
(8), Article e0220682. https://doi.org/10.1371/journal.pone.0220682.
games modelling risk pooling scenarios. Thus, while osotua is an effec Cronk, L., Berbesque, J. C., Conte, T., Gervais, M., Iyer, P., McCarthy, D., … Aktipis, A.
tive means of pooling the risks associated with Maasai livestock herding, (2019). Managing risk through cooperation: Need-based transfers and risk pooling
similar need-based transfer systems may be less likely to evolve and among the societies of the Human Generosity Project. In L. R. Lozny, &
T. H. McGovern (Eds.), Global perspectives on long term community resource
stabilise in societies in which resources are more easily concealed. management. Springer. https://doi.org/10.1007/978-3-030-15800-2_4.
Dahl, G., & Hjort, A. (1976). Having herds: Pastoral herd growth and household economy.
Data availability Department of Social Anthropology: University of Stockholm.
Dorfman, M. S. (2007). Introduction to risk management and insurance. Prentice Hall.
Gurven, M., Hill, K., & Jakugi, F. (2004). Why do foragers share and sharers forage?
The data associated with this research are available at https://osf. Explorations of social dimensions of foraging. Research in Economic Anthropology, 23,
io/wt2mq/. 19–43. https://doi.org/10.1016/S0190-1281(04)23001-3.
Hao, Y., Armbruster, D., Cronk, L., & Aktipis, A. (2015). Need-based transfers on a
network: A model of risk-pooling in ecologically volatile environments. Evolution and
Author contributions Human Behavior, 36(4), 265–273. https://doi.org/10.1016/j.
evolhumbehav.2014.12.003.
Hardy, C. L., & Van Vugt, M. (2006). Nice guys finish first: The competitive altruism
S. Claessens, L. Cronk, and A. Aktipis conceived of and designed the hypothesis. Personality and Social Psychology Bulletin, 32(10), 1402–1413. https://
experimental economic game. J. D. Ayers collected data in the labora doi.org/10.1177/0146167206291006.
tory at Arizona State University and helped set up data collection on Ichikawa, M. (1991). The impact of commoditization on the Mbuti of eastern Zaire. In
N. Peterson, & T. Matsuyana (Eds.), Cash, commoditisation and changing foragers, Senri
Prolific. S. Claessens wrote the code for the game, collected data on
ethnological studies (pp. 135–162). https://doi.org/10.15021/00003137.
Amazon Mechanical Turk and Prolific, conducted all statistical analyses, Kameda, T., Takezawa, M., & Hastie, R. (2003). The logic of social sharing: An
and wrote the manuscript. All authors approved the final version of the evolutionary game analysis of adaptive norm development. Personality and Social
Psychology Review, 7(1), 2–19. https://doi.org/10.1207/S15327957PSPR0701_1.
manuscript for submission.
Kameda, T., Takezawa, M., Tindale, R. S., & Smith, C. M. (2002). Social sharing and risk
reduction: Exploring a computational algorithm for the psychology of windfall gains.
Ethics statement Evolution and Human Behavior, 23(1), 11–33. https://doi.org/10.1016/S1090-5138
(01)00086-1.
Kaplan, H. S., & Hill, K. (1985). Food sharing among Ache foragers: Tests of explanatory
Ethical approval was granted by Arizona State University Institu hypotheses. Current Anthropology, 26(2), 223–246. https://doi.org/10.1086/
tional Review Board for Experiment 1 (ref: STUDY00007432), 203251.
111S. Claessens et al. Evolution and Human Behavior 42 (2021) 104–112
Kaplan, H. S., Schniter, E., Smith, V. L., & Wilson, B. J. (2012). Risk and the evolution of Peterson, N. (1993). Demand sharing: Reciprocity and the pressure for generosity among
human exchange. Proceedings of the Royal Society B: Biological Sciences, 279(1740), foragers. American Anthropologist, 95(4), 860–874. https://doi.org/10.2307/683021.
2930–2935. https://doi.org/10.1098/rspb.2011.2614. Roberts, G. (2005). Cooperation through interdependence. Animal Behaviour, 70(4),
Kitanishi, K. (2006). The impact of cash and commoditization on the Baka hunter- 901–908. https://doi.org/10.1016/j.anbehav.2005.02.006.
gatherer society in Southeastern Cameroon. African Study Monographs, 33, 121–142. Stan Development Team. (2018). RStan: the R interface to Stan. Retrieved from
https://doi.org/10.14989/68472. http://mc-stan.org/.
Lee, M. D., & Wagenmakers, E. J. (2014). Bayesian cognitive modeling: A practical course. Townsend, C. (2015). The emergence of inequality in a former hunter-gatherer society: A
New York: Cambridge University Press. https://doi.org/10.1017/ Baka case study.. Doctoral Dissertation. University College London.
CBO9781139087759. Wickham, H. (2009). ggplot2: Elegant graphics for data analysis. Springer-Verlag New
Norenzayan, A., Shariff, A. F., Gervais, W. M., Willard, A. K., McNamara, R. A., York. Retrieved from http://ggplot2.org.
Slingerland, E., & Henrich, J. (2016). The cultural evolution of prosocial religions. Wiessner, P. (1982). Risk, reciprocity and social influences on !Kung San economics. In
Behavioral and Brain Sciences, 39, 1–19. https://doi.org/10.1017/ E. Leacock, & R. Lee (Eds.), Politics and history in band societies (pp. 61–84). New
S0140525X14001356. York: Cambridge University Press.
Nowak, M. A. (2006). Five rules for the evolution of cooperation. Science, 314(5805), Yoeli, E., Hoffman, M., Rand, D. G., & Nowak, M. A. (2013). Powering up with indirect
1560–1563. https://doi.org/10.1126/science.1133755. reciprocity in a large-scale field experiment. Proceedings of the National Academy of
Nowak, M. A., & Sigmund, K. (2005). Evolution of indirect reciprocity. Nature, 437 Sciences of the United States of America, 110, 10424–10429. https://doi.org/10.1073/
(7063), 1291–1298. https://doi.org/10.1038/nature04131. pnas.1301210110.
112You can also read