A Second Screen Journey to the Cup: Twitter Dynamics during the Stanley Cup Playoffs - TMA Conferences

Page created by Ida Horton
 
CONTINUE READING
A Second Screen Journey to the Cup: Twitter Dynamics during the Stanley Cup Playoffs - TMA Conferences
A Second Screen Journey to the Cup: Twitter
          Dynamics during the Stanley Cup Playoffs
                    Daniel de Leng, Mattias Tiger, Mathias Almquist, Viktor Almquist, Niklas Carlsson
                                             Linkoping University, Sweden

   Abstract—With Twitter and other microblogging services,          teams have recognized this as a great opportunity to connect
users can easily express their opinion and ideas in short text      with their viewers and fans, the research community has only
messages. A recent trend is that users use the real-time prop-      started to explore the use of this second screen in the context
erty of these services to share their opinions and thoughts as
events unfold on TV or in the real world. In the context of         of the events that causes the tweets. As of now, most such
TV broadcasts, Twitter (over a mobile device, for example) is       studies have looked at different TV shows [1], [2], [3], [4],
referred to as a second screen. This paper presents the first       and not at sporting events or entire playoffs, for that matter.
characterization of the second screen usage over the playoffs of       This paper considers the second screen usage during sport-
a major sports league. We present both temporal and spatial
                                                                    ing events broadcasted on TV. In particular, we characterize the
analysis of the Twitter usage during the end of the National
Hockey League (NHL) regular season and the 2015 Stanley             temporal and geographic usage of Twitter during the end of the
Cup playoffs. Our analysis provides insights into the usage         National Hockey League (NHL) regular season and the entire
patterns over the full 72-day period and with regards to in-        2015 playoffs. For our analysis, we use Twitter data collected
game events such as goals, but also with regards to geographic      over a 72-day period in spring 2015. NHL data is well-suited
biases. Quantifying these biases and the significance of specific
                                                                    for such analysis, as NHL uses a similar playoff structure as
events, we then discuss and provide insights into how the playoff
dynamics may impact advertisers and third-party developers that     the other major North American sports leagues (NFL, NBA,
try to provide increased personalization.                           and MLB); each team uses easy-to-identify three-letter (hash)
                                                                    tags, and NHL provides well-structured information about
                          I. I NTRODUCTION                          each game, allowing us to map distinct events such as goals,
   Social media and micro-blogging services are quickly be-         fights, and start/end times of each period.2
coming an integral part of most peoples’ lives. The combi-             We used the Twitter streaming API to collect NHL-related
nation of smartphones that users carry with them everywhere         tweets pertaining to the end of the regular season, the NHL
and services such as Twitter that allow users to express their      playoffs, individual games, as well as information about indi-
opinion and ideas in short text messages, called tweets, have       vidual tweeters (users creating the tweets), and their follower
enabled users to share their opinions and thoughts in real-         relationships. Using this data, we performed temporal and
time, as events unfold. Today, Twitter is the most popular such     geographic analysis of both the long-term dynamics (capturing
micro-blogging services. During 2015-2016 Twitter reported          the change in interactivity over the playoffs) and short-term
that they had roughly 300 million active monthly users and          dynamics, all the way down to individual events within a
500 million tweets per day.1 With Twitter, users can post their     single game. While quantifying biases and rate changes due
own tweets (for others to read) and subscribe to other Twitter      to specific games and in-game events allow us to discuss
users’ tweets. Users then receive notifications when tweets are     and provide insights into how advertisers and third-party
posted by the users that they follow (i.e., users whose tweets      developers could provide increased personalization, our results
they subscribe to).                                                 also shows that the interaction primarily is focused to the
   A very interesting trend in the usage of these services is how   participating cities, and that the overall amount of tweets per
they are used as a second screen while people are watching          day decrease as teams are eliminated from the playoffs, with
TV, or in some cases even attend a live event. In particular,       the exceptions of the finals when the activity again increase,
many users are today sharing their opinions and thoughts about      just to peak at the final game of the entire playoffs, when many
TV shows and other broadcasted TV events, in real-time, with        fans (especially local fans of the winning team) post their
large number of users, as the shows and events unfold. The          congratulations. This very temporal and regional engagement
wide reach of tweets allows users to have interactions with         shows the importance of knowing your audience.
people far away, who they otherwise may not be able to spend           We also provide some insights into the interactivity between
time with in their busy everyday lives. In addition, the uni-       second screen users. For example, a low reply rate suggests
directional follower relationships used by Twitter allow users      that also the second screen usage operates more as an easy-to-
to follow the comments by celebrities and other people that         access broadcast medium than as a one-on-one communication
they may not have the opportunity to interact with in person.       tool among friends. Furthermore, a few users are responsible
Although many broadcasting companies, celebrities, and sports
                                                                      2 Arlitt [5] provides a nice introduction to the rules and events in ice hockey,
  1 https://about.twitter.com/company                               and discusses similarities of playing hockey and building a better Internet.
A Second Screen Journey to the Cup: Twitter Dynamics during the Stanley Cup Playoffs - TMA Conferences
for most of the tweets, with the number of observed second-         Based on each team’s regular season results, eight teams in
screen tweets per user being heavy-tailed, with a power-            each conference make it to the Stanley Cup playoffs. During
law-like shape. Having said that, roughly half of the tweets        the playoffs, three rounds of best-of-seven series are used to
are retweets, suggesting a high degree of interactivity and         determine the two conference champions. In each series, the
agreement among some users. Not surprisingly, such retweets         team that first wins four games is declared the winner of that
are primarily by users cheering for the same team.                  series. Finally, the two conference champions play a best-of-
   The remainder of the paper is structured as follows. Sec-        seven series to determine the Stanley Cup Champion.3
tion II starts off with a discussion of related work. Section III      During each game, the NHL records detailed play-by-play
presents our methodology and provides the necessary back-           reports, which provide ground-truth information about the
ground. Section IV presents a high-level characterization of        timing of important events. However, since ice hockey uses
the second screen usage during the playoffs, and Section V          time stoppage and events are recorded based on the game
presents per-game analysis of selected games. Finally, Sec-         clock, additional information is needed to align the event
tion VI concludes and discusses potential future work.              information with the Twitter feed data. For this reason, we
                                                                    watched a subset of the games and manually recorded the
                     II. R ELATED W ORK
                                                                    actual time of the most important game events, including goals,
   Researchers have shown that second screen viewing leads          penalties, as well as both the start and end time of each period.
to higher cognitive load, while reducing news recall and
comprehension [6]. Yet, it is clear that Twitter increasingly is    B. Twitter API
used as a second screen [7], and that users share their viewing        Twitter provides two APIs for gathering user-generated data:
experiences [8], [1] or opinions [9] during current live events     a REST API that allows selected tweets to be extracted using
and talk shows [10]. One of the reasons for this is that it helps   detailed queries, and a streaming API that allows the Twitter
users feel connected [11].                                          feed to be monitored in real time. Since the REST API imposes
   Doughty et al. [12] use data from Twitter to analyze the         strict rate limitations, we selected to use the streaming API.
social network observed through second screen usage. The               The streaming API takes a set of #hashtags and key-
social graphs from live Twitter streams have also been used as      words as input and provides a stream of tweets that include
a barometer for public opinion during elections [13], [14], or to   these hashtags, as well as information about the user generat-
infer individuals’ political opinion during similar events [15],    ing each tweet. To limit the amount of tweets, Twitter uses a
[16]. Others have developed social TV tools that provide ac-        1% “firehose” approach, that randomly filter away tweets from
cess to their friends’ current TV viewing [17] or algorithm that    the set of tweets matching our selected hashtags/keywords
generate summaries of live events such as soccer games [18].        whenever the volume of the stream would otherwise exceed
   None of the above works characterize the second screen           1% of all public tweets. Fortunately, the API also reports the
usage during sporting events or a playoff series. In contrast,      number of tweets filtered away, allowing us to report volume
we present a temporal and geographic characterization of the        data also during such instances.
second screen usage during the 2015 Stanley Cup playoffs.
   In addition to the second screen usage, many other inter-        C. Primary Data Collection
esting aspects of the Twitter landscape have been investigated         To obtain a good collection of tweets, we adapted the
since the first Twitter studies [19], [20]. For example, users      hashtags used by the streaming API based on the games
have been classified [21], [22], the follower market [23] and       played each day. To do this in a systematic way, we wrote a
spam usage [24] have been studied, cascades of retweets have        data gathering tool that automatically reconfigures the hashtag
been shown to result in sudden bursts of new connections [25],      selection at noon UTC. The time was chosen based on earlier
and linguistic content features in tweets [22] have been ana-       work by Kwak et al. [30], which showed low activity during
lyzed, just to name a few examples. Others have shown that          these early-morning hours in US and Canada, where the games
Twitter users share similarities with their neighbors in the        takes place, and the observation that most games are during
social graphs [26], explored the influence of popular Twitter       the evening hours local time. Selecting such low volume hours
users (on their followers) [27], and investigated the effects       is important to minimize collection disruptions, as the change
of homophily on group polarization and extremism in Twitter         in filtering strategy requires the collection stream to be torn
networks [28], [29]. Motivated by these observations and an         down and set up anew.
expectation that fans of different teams can become polarized          Selecting the best set of hashtags each day is non-trivial,
during a playoff series, we include tag-based and geo-based         and can be considered an art in itself. First, all 30 NHL
analyses to capture the impact that this can have on the tweet      teams have their own official Twitter accounts, from which
activity during individual games and across the playoffs.           we extracted and used the hashtags they use to identify their
          III. BACKGROUND AND M ETHODOLOGY                          individual teams. Such hashtags are typically based on the
                                                                    team name or a short phrase, where the latter is preferred when
A. Playoff Format and Ground Truth Timing
                                                                    the team names are ambiguous in common speech patterns.
  NHL is divided into an eastern and western conference, with
16 and 14 teams, respectively. (16+15 team since 2017/18.)            3 https://en.wikipedia.org/wiki/2015   Stanley Cup playoffs
2 000 000
For example, Montreal Canadian fans are encouraged to use
the hashtag #GoHabsGo to indicate their support. Second,                                                                   1 549 730
                                                                                          1 500 000
each day we extracted the schedule of the games to be played

                                                                       Number of Tweets
and added filters based on the teams to play using the hashtag
                                                                                          1 000 000
convention applied by the NHL, which uses the three-letter
codes assigned to each team and a “vs” tag to specify each                                                                             501 831
                                                                                                  500 000
game. For example, for a game between New York Rangers                                                                                                               259 342
                                                                                                                                                                                            129 886
(NYR) and Montreal Canadians (MTL) we would add the                                                                                              17 458     17 431                24 120
                                                                                                                   0
filters NHL-NYR, NHL-MTL, and #NYRvsMTL.

                                                                                                                                                           e
                                                                                                                                 d

                                                                                                                                                          s
                                                                                                                                                         ry

                                                                                                                                                                                               rs
                                                                                                                                           d

                                                                                                                                                                                 t
                                                                                                                                                        on
                                                                                                                               Pa

                                                                                                                                                        nt
                                                                                                                                         oi

                                                                                                                                                                               .i
                                                                                                                                                       er

                                                                                                                                                                                             he
                                                                                                                                                      ph
                                                                                                                             /i

                                                                                                                                                     ie
                                                                                                                                       dr

                                                                                                                                                                             vr
                                                                                                                                                    kb

                                                                                                                                                                                           ot
    This approach naturally has limitations. For example, our

                                                                                                                           ne

                                                                                                                                                   cl
                                                                                                                                     An

                                                                                                                                                                           dl
                                                                                                                                                   s
                                                                                                                                                  ac

                                                                                                                                                 ow
                                                                                                                         ho

                                                                                                                                                b
                                                                                                                                               Bl

                                                                                                                                              nd
                                                                                                                       iP

                                                                                                                                              We
method easily miss day-specific tags (e.g., related to a specific

                                                                                                                                            Wi
games such as the Stanley Cup Finals). Yet, with many users                                                                Fig. 1. Tweets per device type or platform.
following the standard convention, our approach captures a
significant number of tweets each day, allowing us to provide
                                                                                                                                                                                Measurements
insights into the relative tweet volumes.                                                                   10 5
                                                                                                                                                                                Best Fit

                IV. S ECOND S CREEN U SAGE
                                                                                                            10 4
   For the analysis presented in this section, we used a dataset

                                                                                          Number of Users
collected over 72 days, starting on April 5th, 2015. The dataset
                                                                                                            10 3
spans the last six days of the regular season (April 11 being
the last day with regular season games and the day that the
playoff schedule was finalized), the first playoff round (April                                             10 2

15–29), the second playoff round (April 30th through May
13th), the third round (also called conference finals; May                                                  10 1
16–30) and the Stanley Cup finals (June 3–15). In total, the
dataset includes 4.5 million unique tweets, by over 795,000
                                                                                                            10 0
unique users. While the 1% firehose effect came into play                                                      10 0                  10 1            10 2                10 3                  10 4
                                                                                                                                                 Total Tweets
almost every day, the number of lost tweets was relatively low.       Fig. 2. Number of users with different number of tweets (blue) and best-fit
Manual inspection suggests that losses typically took place at        power law distribution (red).
in-game events such as goals, when the tweet volume spiked.
Section V provides a more detailed analysis and discussion of         squares) power law distribution (red). Despite non-overlapping
these in-game events.                                                 curves (due to the high weight given to observations in the
A. Mobile Clients                                                     tail) the observed straight-line behavior indicates power-law-
                                                                      like characteristics. The tail primarily consists of automated
   Figure 1 shows a histogram for the device types and
                                                                      retweet accounts and services extending social media reach
platforms used by the users posting each tweet, as extracted
                                                                      for paying customers.
from the identifier URL in each tweet. The majority of tweets
                                                                         With most users only making a single post, it is perhaps
(88% if excluding the difficult-to-classify “Other” category) in
                                                                      not surprising that most users are only active for a single day.
our dataset originate from mobile clients such as smartphones
                                                                      Figure 3 shows the number of users that are active different
or tablets, with most tweets originate from Apple products
                                                                      number of days, both on linear scale (blue) and logarithmic
such as the iPhone and iPad. This observation (together with
                                                                      scale (red). On average, users are active 2.47 days, but with
the high correlation of in-game events and peaks in tweet
                                                                      a significant tail of users active longer (stdev=3.2). While
activity) supports the expectation that people use Twitter as a
                                                                      some fans primarily focus on their favorite team, others may
second screen with the TV or computer as the primary screen.
   Another interesting observed platform is the dlvr.it web           engage also in matches involving other teams. For example, we
service, which allows automatic retweeting of others’ tweets          have observed a decreased usage between the first and second
and tweeting of a person’s status from other social media (e.g.,      round, and between the second and third round, suggesting
Instagram or Facebook). We note that the service generally is         that users’ engagement decreases when their favorite team is
used as a tool to help businesses with their social networking        eliminated, but also how users re-engage during the finals. In
outreach and visibility. Given that its usage is small in our         the set of users that posts almost every day we observe official
dataset, it can maybe best be seen as noise when analyzing            team/news accounts as well as a few spammers.
the second screen usage observed here.                                   Finally, it should be noted that the number of active users
                                                                      is highly correlated with the number of tweets. For example,
B. Skewed Usage                                                       on an hourly basis we observe a correlation of 0.972 (with
   There is a high skew in the number of tweets per user.             Normalized Root Mean Square Error, NRMSE, of 0.775) and
Figure 2 shows the number of users with a given number of ob-         on a per-day basis we observe a correlation of 0.988 (with
served tweets (blue) on a log-log scale, and a best-fit (i.e. least   NRMSE of 0.219). Figure 4 shows an example plot of the
10 5                                                     x 10
                                                                                                                                                                                                                                                                                   5                               Tweets and Retweets per Day
                                          10 6                                                                                                                                                                   6                                                   3.5
                                                                                                                                                                                                                                                                                                                                            1

                                                                                                                                                                                                                                                                                                                       Retweet Ratio
                                                                                                                                                                          Users (linear scale)
                                          10 5                                                                                                                            Users (log scale)
                                                                                                                                                                                                                 5                                                    3

                                                                                                                                                                                                                     Users (linear scale)
Users (log scale)

                                                                                                                                                                                                                                                                                                                                       0.5

                                                                                                                                                                                                                                               Tweets and Retweets
                                          10 4                                                                                                                                                                   4                                                   2.5

                                          10 3                                                                                                                                                                   3                                                    2                                                                     0

                                                                                                                                                                                                                                                                                                                                            5
                                                                                                                                                                                                                                                                                                                                                     15

                                                                                                                                                                                                                                                                                                                                                              25

                                                                                                                                                                                                                                                                                                                                                                        5
                                                                                                                                                                                                                                                                                                                                                                                15

                                                                                                                                                                                                                                                                                                                                                                                         25

                                                                                                                                                                                                                                                                                                                                                                                                   4
                                                                                                                                                                                                                                                                                                                                                                                                            14
                                                                                                                                                                                                                                                                                                                                        l

                                                                                                                                                                                                                                                                                                                                                                   y

                                                                                                                                                                                                                                                                                                                                                                                              ne
                                               2                                                                                                                                                                 2

                                                                                                                                                                                                                                                                                                                                       ri

                                                                                                                                                                                                                                                                                                                                                 l

                                                                                                                                                                                                                                                                                                                                                          l
                                                                                                                                                                                                                                                                                                                                                               Ma

                                                                                                                                                                                                                                                                                                                                                                            y

                                                                                                                                                                                                                                                                                                                                                                                     y

                                                                                                                                                                                                                                                                                                                                                                                                       ne
                                          10                                                                                                                                                                                                                         1.5

                                                                                                                                                                                                                                                                                                                                                ri

                                                                                                                                                                                                                                                                                                                                                      ri

                                                                                                                                                                                                                                                                                                                                                                        Ma

                                                                                                                                                                                                                                                                                                                                                                                 Ma

                                                                                                                                                                                                                                                                                                                                                                                          Ju
                                                                                                                                                                                                                                                                                                                         Ap

                                                                                                                                                                                                                                                                                                                                                                                                   Ju
                                                                                                                                                                                                                                                                                                                                        Ap

                                                                                                                                                                                                                                                                                                                                                     Ap
                                          10 1                                                                                                                                                                   1                                                    1

                                               0                                                                                                                                                                 0
                                          10                                                                                                                                                                                                                         0.5
                                                   0            5             10              15            20                                            25               30              35           40
                                                                                                            Days                                                                                                                                                      0

                                                                                                                                                                                                                                                                           5
                                                                                                                                                                                                                                                                                   10

                                                                                                                                                                                                                                                                                            15

                                                                                                                                                                                                                                                                                                     20

                                                                                                                                                                                                                                                                                                              25

                                                                                                                                                                                                                                                                                                                       30

                                                                                                                                                                                                                                                                                                                                            5
                                                                                                                                                                                                                                                                                                                                                     10

                                                                                                                                                                                                                                                                                                                                                              15

                                                                                                                                                                                                                                                                                                                                                                       20

                                                                                                                                                                                                                                                                                                                                                                                25

                                                                                                                                                                                                                                                                                                                                                                                         30

                                                                                                                                                                                                                                                                                                                                                                                                   4

                                                                                                                                                                                                                                                                                                                                                                                                            9
                                                                                                                                                                                                                                                                                                                                                                                                                 14
Fig. 3. Number of unique users that post tweets for a given number of days.

                                                                                                                                                                                                                                                                      l

                                                                                                                                                                                                                                                                                                                                        y

                                                                                                                                                                                                                                                                                                                                                                                              ne

                                                                                                                                                                                                                                                                                                                                                                                                       ne
                                                                                                                                                                                                                                                                     ri

                                                                                                                                                                                                                                                                               l

                                                                                                                                                                                                                                                                                        l

                                                                                                                                                                                                                                                                                                 l

                                                                                                                                                                                                                                                                                                          l

                                                                                                                                                                                                                                                                                                                   l
                                                                                                                                                                                                                                                                                                                                       Ma

                                                                                                                                                                                                                                                                                                                                                 y

                                                                                                                                                                                                                                                                                                                                                          y

                                                                                                                                                                                                                                                                                                                                                                   y

                                                                                                                                                                                                                                                                                                                                                                            y

                                                                                                                                                                                                                                                                                                                                                                                     y

                                                                                                                                                                                                                                                                                                                                                                                                            ne
                                                                                                                                                                                                                                                                           ri

                                                                                                                                                                                                                                                                                   ri

                                                                                                                                                                                                                                                                                            ri

                                                                                                                                                                                                                                                                                                     ri

                                                                                                                                                                                                                                                                                                              ri

                                                                                                                                                                                                                                                                                                                                            Ma

                                                                                                                                                                                                                                                                                                                                                      Ma

                                                                                                                                                                                                                                                                                                                                                              Ma

                                                                                                                                                                                                                                                                                                                                                                       Ma

                                                                                                                                                                                                                                                                                                                                                                                Ma

                                                                                                                                                                                                                                                                                                                                                                                         Ju

                                                                                                                                                                                                                                                                                                                                                                                                   Ju
Blue (right y-axis) shows the true totals, red (left y-axis) shows the log totals.

                                                                                                                                                                                                                                                    Ap

                                                                                                                                                                                                                                                                                                                                                                                                        Ju
                                                                                                                                                                                                                                                                      Ap

                                                                                                                                                                                                                                                                                Ap

                                                                                                                                                                                                                                                                                        Ap

                                                                                                                                                                                                                                                                                                 Ap

                                                                                                                                                                                                                                                                                                          Ap
                                          18000                                                                                                                                                                                                                       Fig. 5. Number of tweets (blue) and retweets (red) per day.
                                          16000                                                                                                              4
Tweet rate, Active users (linear scale)

                                                                                                                                                        10
                                                                                                                 Tweet rate, Active users (log scale)

                                          14000                                                                                                                                                                                             in the general activity (e.g. the finals in June), with the most
                                          12000                                                                                                                                                                                             retweeted tweets often being due to tweets by celebrities with
                                          10000                                                                                                                                                                                             many followers.
                                           8000                                                                                                         10 3
                                                                                                                                                                                                                                            D. Longitudinal Usage
                                           6000
                                                                                                                                                                                                                                               Comparing the heights of the bars in Figures 5, we observe
                                           4000
                                                                                                                                                                                                                                            the most activity during the last day of the regular season
                                           2000
                                                                                                                                                                                                                                            (when the final playoff teams and schedule were determined)
                                                   0                                                                                                    10 2
                                                                                                                                                                                                                                            and the last day of the playoffs, when the Chicago Blackhawks
                                                                                                                                                                 5

                                                                                                                                                                              6

                                                                                                                                                                                           7

                                                                                                                                                                                                        8

                                                                                                                                                                                                                     9
                                                       5

                                                                    6

                                                                                 7

                                                                                              8

                                                                                                            9

                                                                                                                                                          l

                                                                                                                                                                          l

                                                                                                                                                                                       l

                                                                                                                                                                                                    l

                                                                                                                                                                                                                 l
                                                   l

                                                                l

                                                                             l

                                                                                          l

                                                                                                        l

                                                                                                                                                        ri

                                                                                                                                                                      ri

                                                                                                                                                                                   ri

                                                                                                                                                                                                ri

                                                                                                                                                                                                             ri
                                               ri

                                                            ri

                                                                         ri

                                                                                      ri

                                                                                                    ri

                                                                                                                                                                                                                                            were declared Stanley Cup Champions. Furthermore, the usage
                                                                                                                                        Ap

                                                                                                                                                                     Ap

                                                                                                                                                                                  Ap

                                                                                                                                                                                               Ap

                                                                                                                                                                                                            Ap
                                           Ap

                                                           Ap

                                                                        Ap

                                                                                     Ap

                                                                                                   Ap

Fig. 4. Number of tweets (blue) and users (red) in a one-hour sliding window.                                                                                                                                                               (and spikes) is much higher during the first playoff round
                                                                                                                                                                                                                                            (April 15–29) than during the second round (April 30 through
number of active users and tweets within a one-hour sliding                                                                                                                                                                                 May 13) and again higher during the second round than
window. A closer look at this figure also reveals a diurnal                                                                                                                                                                                 the third round (May 16–30), supporting our previous claim
usage patterns with heavier usage during evening hours when                                                                                                                                                                                 that user engagement (and usage) went down as teams were
the games typically took place.                                                                                                                                                                                                             eliminated. Although we observe considerable peaks on May
                                                                                                                                                                                                                                            29–30 (game sevenths of the two conference finals), it was
C. Type of Tweets
                                                                                                                                                                                                                                            not until the finals (June 3–15) that the interest really peaked
   We also consider the impact of different types of tweets,                                                                                                                                                                                again. We note clear spikes for each of the six championship
including retweets, replies, and tweets sent from official                                                                                                                                                                                  games, with the first and final games generating the most
accounts. Official accounts are responsible for few (1.81%)                                                                                                                                                                                 Twitter activity. Naturally, the tweets from the final day saw
original tweets. In contrast, retweets make up the largest                                                                                                                                                                                  many people (including U.S. President Obama) congratulate
portion (53.9%). With a retweet, a user forwards a copy of                                                                                                                                                                                  Chicago on the win.
a tweet to its followers. While retweets do not add new
information, they help disseminate information and opinions                                                                                                                                                                                 E. Location of Tweeters
to others and indicate that user do engage in these events.                                                                                                                                                                                   We next take a closer look at the relative location of the
   We have also seen a small portion of replies among the                                                                                                                                                                                   tweeters. For this analysis, we use the subset of tweets that
tweets. However, such discussions are typically extremely                                                                                                                                                                                   contain geo-location data (given in latitude and longitude
short. This observation, combined with a higher retweet ratio                                                                                                                                                                               coordinates), and calculate distances between the location
(0.753) for tweets from official accounts, suggest that official                                                                                                                                                                            and each NHL arena (taking into account Earth’s geometry).
contents may be more engaging and that one-on-one discus-                                                                                                                                                                                   Although only roughly 1% of the observed tweets included the
sions are relatively less frequent. Many of the forwarded tweets                                                                                                                                                                            posters’ geographic coordinates (an optional feature in Twitter)
are instead from the official team accounts (of the team that                                                                                                                                                                               and there may be biases in the subset that agree to share their
the user may cheer) and news accounts (that the users have                                                                                                                                                                                  locations, the geo-data provides some interesting insights into
actively selected to follow).                                                                                                                                                                                                               the changes in regional interest over time.
   Figure 5 shows the total number of tweets (blue) and                                                                                                                                                                                       First, let us consider the locality of tweeters across the full
retweets (red) per day, and an insert with the daily retweet                                                                                                                                                                                dataset. Figure 6 shows the cumulative distribution function
ratio. Interestingly, the ratio is relatively stable compared                                                                                                                                                                               (CDF) and complementary CDF (CCDF) of the distance
to the large variations in total per-day tweet volumes, with                                                                                                                                                                                between the tweeter (when posting the tweet) and the closest
typical daily variations between 0.45 and 0.65. In general, the                                                                                                                                                                             NHL arena. We note that 50% of the tweets are from within
somewhat higher relative re-tweet rates occurred when there                                                                                                                                                                                 27.8 km of the closest arena and 90% are from within 324
was little activity (e.g. May 25th) and when there were spikes                                                                                                                                                                              km of the closest arena. This shows that most of the activity
1                                                                         1                                   100

                                                                                                                       Percent tweets (%)
                                                                                                                                                                 Team eliminated regular season
                                                                                                                                            80                       Team eliminated first round
                             0.8                                                                        0.8                                                       Team eliminated second round
                                                                                                                                            60                      Team eliminated third round

                                                                                                              CCDF
                             0.6                                                                        0.6                                                            Team participated in final
                       CDF

                                                                                        CDF
                                                                                       CCDF                                                 40
                             0.4                                                                        0.4
                                                                                                                                            20
                             0.2                                                                        0.2
                                                                                                                                             0       Re            Fir              Se              Th              Fin
                              0                                                                         0                                              g.              st             co              ird              als
                                                                                                                                                            Se              rou          nd                 rou
                                                                                                                                                              as               nd             rou              nd
                                                                                                                                                                  on                             nd
                                   10-2              10-1   100     101    102    103             104
                                                      Distance to closest arena (km)                                                              (a) Closest arena regardless of distance
                      Fig. 6. CDF and CCDF of the distance to the closest NHL arena.
                                                                                                                                            100

                                                                                                                       Percent tweets (%)
                                                                                                                                                                 Team eliminated regular season
                                                                                                                                            80                       Team eliminated first round
                      14                                                                                                                                          Team eliminated second round
                                                         Second round

                                                                                                                                            60                      Team eliminated third round
                                       Third round

                                                                         First round

                      12                                                                                                                                               Team participated in final
 Percent tweets (%)

                      10                                                                                                                    40
                               Final

                                                                                        Eliminated regular season
                      8                                                                                                                     20
                      6
                                                                                                                                             0       Re            Fir              Se              Th              Fin
                      4                                                                                                                                g.              st             co              ird              als
                                                                                                                                                            Se              rou          nd                 rou
                                                                                                                                                              as               nd             rou              nd
                      2                                                                                                                                           on                             nd
                      0                                                                                                                     (b) Closest arena conditioned on being within 100km
                             CHI
                             TBL
                             NYR
                             ANA
                             MTL
                             WSH
                             MIN
                             CGY
                             OTT
                             DET
                             PIT
                             NYI
                             STL
                             NSH
                             WPG
                             VAN
                             BOS
                             FLA
                             CBJ
                             PHI
                             NJD
                             CAR
                             TOR
                             BUF
                             LAK
                             DAL
                             COL
                             SJS
                             EDM
                             PHX

                                                                                                                     Fig. 8. Fraction of tweets “located” closest to an arena belonging to a team
                                                                                                                     eliminated at different stages of the playoff elimination process.
 Fig. 7. Closest NHL arena when tweet from within 100 km of an arena.

is associated with regions hosting an NHL team. Furthermore,                                                         over the playoffs. Here, we show the fraction of tweets that
with only 7.5% of these tweets being from within 1 km of the                                                         occurred between the end of the prior round and the end
closest arena, the majority of the activity appears to be due                                                        of the current round (associating all such tweets with the
to people watching the game from their home, bars, or other                                                          current round). Similarly, we let the last day of the regular
locations, rather than from within the arenas.                                                                       season mark the last day before the start of the time-period
   Most activity is observed close to Chicago (CHI), the city                                                        that we associate with the first round. We see that for the
of the team that won the Stanley Cup. This is observed in                                                            end of the regular season, the number of tweets per category
Figure 7. Here, we show the percentage of tweets that are                                                            is approximately proportional to the number of teams in
closest to each NHL arena, across all tweets that are associated                                                     each category (i.e., 14, 8, 4, 2, 2). However, as soon as the
with a location that is within 100km of an NHL arena. (In                                                            playoff starts, we see a steady increase in each round for
total, 73.6% of the geo-tagged tweets meet this criterion.)                                                          the teams reaching the final (again CHI contributing most
To simplify interpretation, we also mark which round each                                                            of those tweets). In general, the fans associated with already
team reached. We note that the teams that went further in                                                            eliminated teams contribute a substantially smaller fraction
the playoffs generally are associated with more local tweets                                                         of the tweets, especially when accounting for the categories
(bias towards higher bars towards the right), with most of                                                           associated with eliminated teams including more teams per
the individual peaks being associated with Canadian playoff                                                          category than the categories including teams still in the playoff
teams and other traditional hockey markets (e.g., NYR, MTL,                                                          chase. Assuming that active tweeting can be used as a predictor
MIN, OTT, NYI, and TOR). Not surprisingly, among the non-                                                            of local user engagement, then these results suggest that
playoff teams, Toronto (TOR) stands out when looking at the                                                          people in region that are eliminated quickly lose interest after
proximity of tweets to NHL arenas. Toronto (5.6%) is often                                                           their team is eliminated. This highlights that advertisers and
considered the hockey center of the world. This is also where                                                        personalized news services must take into account the teams
NHL has its main office and where NHL’s Hockey Hall of                                                               individual users cheer for (or at least the users’ geographic
Fame (HHOF) is located. Yet, over the full trace period, we see                                                      location relative to teams, which these results suggest provide
that Chicago (CHI; 13.3%), Montreal (MTL; 7.7%), and New                                                             an approximation) and teams’ playoff status, for example,
York Rangers (NYR; 6.5%) all contributed with more geo-                                                              when deciding to promote services and news that may have
tagged tweets than Toronto. Even Ottawa (OTT; 5.3%), a much                                                          more/less value depending on which team a user cheers for.
smaller Canadian city (with 0.95 million people, compared to
Toronto’s 2.8 million people), came close to reach the same                                                          F. Hashtags
amount of tweets as Toronto despite being eliminated already                                                            We have observed Zipf-like popularity skew in the hashtag
in the first round. This again highlights the high concentration                                                     usage, and, ignoring Toronto (non-playoff team), that the same
of tweets from cities with active playoff teams.                                                                     set of teams for which we observe the most local tweeters
   Finally, Figure 8 shows how the tweet volumes associated                                                          (previous section) are also the teams for which we observe the
with teams making it to the different playoff rounds changed                                                         most team-related hashtags. The first observation is illustrated
TABLE I

      Number of tweets with hashtag
                                      106                                                                 S UMMARY TABLE OF IN - GAME STATISTICS .
                                      105                                                      Game      Date   Score    #Users    #Tweets     Retweet   Replies
                                      104                                                     MTL-OTT    15/4    4-3     24,342     49,632      0.37      0.07
                                      103                                                     CHI-NSH    19/4    4-2     13,619     29,847      0.46      0.05
                                                                                              DET-TBL    23/4    2-3     19,374     32,484      0.49      0.05
                                      102                                                     NYR-PIT    24/4    2-1     13,184     27,070      0.40      0.06
                                      101                                                     WSH-NYI    25/4    1-3     11,297     23,590      0.37      0.06
                                      100                                                     STL-MIN    26/4    1-4     14,955     28,990      0.47      0.08
                                            100      101     102      103      104     105
                                                             Rank of hashtag                 20 hashtags per game, and a parallel collection processes was
Fig. 9. Number of times each hashtag is observed as a function of the rank                   initiated 15 minutes before each game. Each collection lasted
of the hashtag (based on decreasing usage frequency in the dataset).                         approximately 200 minutes, allowing us to capture the tweets
                                                                                             for the full games.

                                                                                             A. In-game User Engagement
                                                                                                Table I summarizes the number of tweets and users for
                                                                                             each of the six games, as well as a breakdown of the fraction
                                                                                             of retweets and replies. The analyzed games were: Montreal
                                                                                             Canadiens (MTL) vs Ottawa Senators (OTT), Chicago Black-
                                                                                             hawks (CHI) vs Nashville Predators (NSH), Detroit Red Wings
                                                                                             (DET) vs Tampa Bay Lightning (TBL), New York Rangers
                                                                                             (NYR) vs Pittsburgh Penguins (PIT), New York Islanders
                                                                                             (NYI) vs Washington Capitals (WSH), and Minnesota Wild
                                                                                             (MIN) vs St Louis Blues (STL).
                                                                                                For the in-game data we find a non-negligible fraction
                                                                                             replies (5-8%), suggesting some degree of one-on-one interac-
                                            Fig. 10. Tweets per minute during NYI vs WSH.    tion during the games. We also find a smaller fraction retweets
                                                                                             (37-49%) than for the overall dataset, suggesting that relatively
in Figure 9. Here, we use a rank-frequency plot with both axes                               more original tweets (new content) are created during the
on log scale and show the number of times each hashtag is                                    games. In contrast, retweets may more often be done with
observed as a function of its rank (with ranks determined based                              some delay, after the games, and/or contain post-game (or pre-
on decreasing occurrences). As indicated by the straight-line                                game) content.
behavior of this log-log plot, the distribution is Zipf-like (and                               Given the popularity of ice hockey in Canada, it is perhaps
hence also power-law) [31]. The second observation can be                                    not surprising that we observe the highest activity during the
demonstrated by looking closer at the top-10 most frequently                                 game between two Canadian teams (MTL-OTT), with 49,632
observed hashtags in the dataset: #blackhawks (868,509                                       tweets spread over 24,342 users; on average 2.0 tweets per
tweets; CHI), #nyr (604,583 tweets; NYR), #stanleycup                                        observed user. Overall, the average tweets per user during the
(416,141 tweets; all teams), #gohabsgo (315,869 tweets;                                      games were between 1.7 and 2.2, showing a relatively high
MTL), #habs (192,891 tweets; MTL), #mnwild (164,933                                          activity per user during the short three-hour window of a game.
tweets; MIN), #tblightning (162,878; TBL), #sens                                                Finally, comparing across games, there consistently appears
(149,541 tweets; OTT), #flames (148,141 tweets, CGY),                                        to be a relatively similar skew in the number of followers
and #caps (144,703 tweets, WSH). Note that Chicago Black-                                    per tweeter observed during each game. This is highlighted
hawks (CHI), New York Rangers (NYR), and Montreal Cana-                                      by the close-to-overlapping CDF and CCDF curves (one for
diens (MTL) places at the top. In fact, noting that two top-five                             each of the above six example games) shown in Figure 11.
hashtags #gohabsgo and #habs belong to MTL, these three                                      We can also observe that the majority of tweets (more than
teams really stand out from the rest. Again, these three teams                               50%) are by tweeters with less than 274 followers (221,
are the exact same teams with the most local tweets.                                         242, 272, 274, 259, and 262 followers for each of the six
                                                                                             games, respectively) and that there is a heavy-tail of tweets
                                                   V. P ER - GAME A NALYSIS
                                                                                             by tweeters with many followers. For example, the two games
   To better understand the second screen usage during games,                                with the heaviest tails (out of the six example games), 1% of
we watched and manually recorded the timestamps at which                                     the tweets are by tweeters with at least 16,880 and 42,779
important events occurred during six games. For these games,                                 followers, respectively. Similarly, the most followed tweeters
we collected additional tweet data using game specific hash-                                 that we observe during each game have between 3,365,095 and
tags manually identified by reading up on the particular games                               16,588,960 followers. Naturally, tweets by users with many
and the involved teams. For these datasets, we used on average                               followers are more likely to generate follow-up posts by others.
1                                               100
         0.8                                              10-1
                                                          10-2

                                                                 CCDF
         0.6
   CDF

                                                          10-3
         0.4
                            CDF(s)                        10-4
         0.2                                              10-5
                           CCDF(s)
          0                                               10-6
               100 101 102 103 104 105 106 107 108
                      Number of followers                                Fig. 12. Tweets per minute at the time of different in-game event types.
    Fig. 11. Number of followers for tweeters during example games.
                                                                                  1
B. In-game Events                                                                        MTL-OTT
   We next look closer at the in-game events that trigger the                    0.8     CHI-NSH
most user activity. In particular, we consider an event to be                            DET-TBL
                                                                                 0.6

                                                                           CDF
equivalent to a game judgment, for example a goal or a penalty.                          NYR-PIT
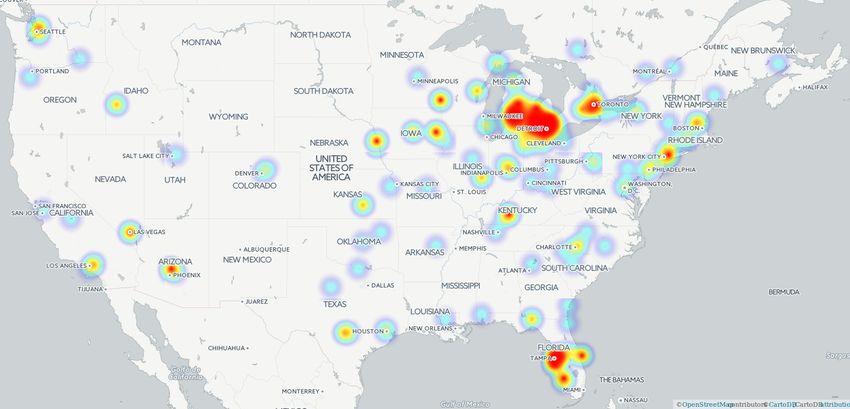
Figure 10 shows the number of tweets per minute for the                          0.4     WSH-NYI
example game between New York Islanders (NYI) and the                                    STL-MIN
                                                                                 0.2
Washington Capitals (WSH). This figure highlights the real-
time nature of second screen usage, and clearly shows that                        0
tweets are generated at the highest rate when goals occur or                           10-2   10-1   100      101     102    103     104
at the end of the game. For example, during goals (at minute                                  Distance to closest of two arenas (km)
33, 62, 159, and 179) the tweet rate is at least five times higher       Fig. 13. Distance to closest of the two teams’ arenas for in-game tweets.
than during the rest of the game. We also see a smaller spike
at the 20 minute mark, when the game started, and a large               shows the tweeters’ distance to the closest arena of the two
spike when the game ends.                                               teams competing in the game as a cumulative distribution
   Similar patterns have been observed during other games.              function (CDF), for each of the six games. Although there
Figure 12 shows the number of tweets (per minute) that                  is a significant tail of users far away from the participating
occurred for the corresponding in-game events for the example           teams’ arenas, we see that many of the tweeters are close
games. For the goals, we include statistics for the minimum,            to the participating teams’ corresponding cities. For example,
average, and maximum amount of tweets observed across goal              43-50% of the tweeters are within 100km of the closest
events during each game. While goals are popular and well-              participating city, and approximately 63% are within 300km.
tweeted events, in all but one of the games the highest observed        The sharp step in the OTT-MTL curve is due to many tweets
tweet rate was observed at the end of the game.                         from the general Toronto region (largest city in Canada, with
   In general, the sharp peaks at the times of interest pro-            a very big hockey interest, and located 320km from Ottawa).
vide opportunities to develop automated tools that provide                 The geo-spatial locality is perhaps even more clearly illus-
personalized event feeds to users. To validate this hypothesis          trated in Figure 14, which shows the geographic tweet intensity
we implemented a very simple event detector based on the                during a game between Detroit Red Wings (DET) and Tampa
same exponentially weighted moving average (EMWA) used                  Bay Lightning (TBL). Here, two large intense regions are
to detect packet losses in TCP [32]. At a high level, with              observed around Detroit, Michigan (top) and Tampa, Florida
this method, an EMWA with weight α is used to estimate                  (bottom). Similar plots for each team separately, reveal that
the average, an EMWA with weight β is used to estimate                  there typically is a very large imbalance in the tweets for
the deviations, and a detection threshold is set equal to the           each team in each of the highlighted regions. For example,
estimated average plus K times the estimated deviation. Using           almost only Tampa tweets about TBL, whereas most of the
the recommended values α = 1/8, β = 1/4, and K = 4,                     highlighted regions tweet about DET, Tampa included. This is
we detect all the events of interest for the example games              likely an effect of DET (founded 1926), which is one of NHL’s
and a few additional events. For example, for the NYI-WSH               original six teams, having a much broader fan base than TBL
game above, in addition to start, end, and goals, we also detect        (founded 1992).
events at times 118 and 139. The first of these events is due
                                                                                                   VI. C ONCLUSIONS
to Islanders fans being upset that Matt Donovan (NYI) gets a
misconduct penalty, and the second event marks the start of               This paper presents the first characterization of in-game
the third (final) period.                                               second screen usage and across an entire playoff. We present
                                                                        both temporal and spatial analysis of the Twitter usage during
C. In-game Location-based Analysis                                      the end of the NHL regular season and the 2015 Stanley Cup
  Next, we consider the geographical location of people that            playoffs. We show that the majority of these tweets are done
tweeted about particular teams during the games. Figure 13              using mobile devices, that the tweeting actively is heavy tailed,
[5] M. Arlitt, “The top ten similarities between playing hockey and building
                                                                                  a better internet,” SIGCOMM Comput. Commun. Rev., vol. 42, no. 2, pp.
                                                                                  99–102, Mar. 2012.
                                                                              [6] A. Van Cauwenberge, G. Schaap, and R. V. Roy, “TV no longer
                                                                                  commands our full attention: Effects of second-screen viewing and task
                                                                                  relevance on cognitive load and learning from news,” Computers in
                                                                                  Human Behavior, vol. 38, pp. 100–109, 2014.
                                                                              [7] M. Doughty, S. Lawson, and D. Rowland, “Co-viewing live TV with
                                                                                  digital backchannel streams,” in Proc. ACM EuroITV, 2011.
                                                                              [8] D. Y. Wohn and E.-K. Na, “Tweeting about TV: Sharing television
                                                                                  viewing experiences via social media message streams,” First Monday,
                                                                                  vol. 16, 2011.
                                                                              [9] N. Anstead and B. O’Loughlin, “The emerging viewertariat and BBC
                                                                                  question time: Television debate and real-time commenting online,” The
Fig. 14. Tweets during the game between Detroit (Michigan) and Tampa              International Journal of Press/Politics, 2011.
(Florida) on April 16, 2015.                                                 [10] F. Giglietto and D. Selva, “Second screen and participation: A content
                                                                                  analysis on a full season dataset of tweets,” Journal of Communication,
and roughly half of the tweets are retweets. During the actual                    vol. 64, pp. 260–277, 2014.
                                                                             [11] S. Schirra, H. Sun, and F. Bentley, “Together alone: Motivations for
games, more new content is generated (e.g., spikes in usage                       live-tweeting a television series,” in Proc. ACM CHI, 2014.
and lower retweet ratios) and the usage patterns provide clear               [12] M. Doughty, D. Rowland, and S. Lawson, “Who is on your sofa?: TV
evidence that Twitter is used for real-time second screen usage.                  audience communities and second screening social networks,” in Proc.
                                                                                  ACM EuroITV, 2012.
For example, when goals occur we observe significant spikes                  [13] N. A. Diakopoulos and D. A. Shamma, “Characterizing debate perfor-
in tweeting rates (typically 7-8 times the in-game baseline).                     mance via aggregated Twitter sentiment,” in Proc. ACM CHI, 2010.
Only at the end of the games do we observe higher tweet rates.               [14] D. A. Shamma, L. Kennedy, and E. F. Churchill, “Tweet the debates:
                                                                                  Understanding community annotation of uncollected sources,” in Proc.
Our geo-based analysis shows that the majority of tweets are                      ACM SIGMM Workshop on Social Media, 2009.
from the regions closest to the competing cities, with a tail of             [15] D. Shamma, L. Kennedy, and E. Churchill, “Tweetgeist: Can the Twitter
tweeters further away, and a high bias towards mentioning the                     timeline reveal the structure of broadcast events,” in Proc. CSCW
                                                                                  Horizons, 2010.
local team.                                                                  [16] A. Tumasjan, T. O. Sprenger, P. G. Sandner, and I. M. Welpe, “Predicting
   While our analysis shows significant second screen activity                    elections with Twitter: What 140 characters reveal about political
during games, the passive usage is likely much greater. How-                      sentiment,” in Proc. ICWSM, 2010.
                                                                             [17] G. Harboe, C. J. Metcalf, F. Bentley, J. Tullio, N. Massey, and G. Ro-
ever, determining the passive Twitter usage is not possible with                  mano, “Ambient social TV: Drawing people into a shared experience,”
Twitter’s current API. Another interesting direction for future                   in Proc. ACM CHI, 2008.
work is the design of personalized stream aggregation tools                  [18] J. Nichols, J. Mahmud, and C. Drews, “Summarizing sporting events
                                                                                  using twitter,” in Proc. ACM IUI, 2012.
that automatically, in real time, extract tweets that may be of              [19] A. Java, X. Song, T. Finin, and B. Tseng, “Why we twitter: Under-
interest to a user. Our results suggest that such tools may use                   standing microblogging usage and communities,” in Proc. ACM KDD,
anomaly detection in the tweet rates to detect interesting in-                    2007.
                                                                             [20] B. Krishnamurthy, P. Gill, and M. Arlitt, “A few chirps about Twitter,”
game events and that further filtering may be possible based on                   in Proc. ACM WOSN, 2008.
the closest city. Of course, user relationships (and who they                [21] D. Rao, D. Yarowsky, A. Shreevats, and M. Gupta, “Classifying latent
follow) may also provide a good indication, which must be                         user attributes in Twitter,” in Proc. ACM SMUC, 2010.
                                                                             [22] M. Pennacchiotti and A.-M. Popescu, “A machine learning approach to
explored further. Given the drop in tweets local to eliminated                    Twitter user classification,” in Proc. ICWSM, 2011.
teams, NHL-related news (and other sports new related to                     [23] G. Stringhini, G. Wang, M. Egele, C. Kruegel, G. Vigna, H. Zheng, and
sports using elimination playoffs) should likely best be adapted                  B. Y. Zhao, “Follow the green: Growth and dynamics in twitter follower
                                                                                  markets,” in Proc. IMC, 2013.
to account for a user’s potential drop in user engagement once               [24] C. Lumezanu and N. Feamster, “Observing common spam in Twitter
a team that the fan cheers for is eliminated.                                     and email,” in Proc. IMC, 2012.
                                                                             [25] S. A. Myers and J. Leskovec, “The bursty dynamics of the twitter
                   VII. ACKNOWLEDGMENTS                                           information network,” in Proc. WWW, 2014.
                                                                             [26] F. Al Zamal, W. Liu, and D. Ruths, “Homophily and latent attribute
   We thank our shepherd Matthieu Latapy and the anonymous                        inference: Inferring latent attributes of twitter users from neighbors,” in
reviewers for their feedback. This work was funded in part by                     Proc. ICWSM, 2012.
the Swedish Research Council (VR) and the National Graduate                  [27] M. Cha, H. Haddadi, F. Benevenuto, and P. K. Gummadi, “Measuring
                                                                                  user influence in Twitter: The million follower fallacy,” in Proc. ICWSM,
School in Computer Science, Sweden (CUGS).                                        2010.
                                                                             [28] S. Yardi and D. Boyd, “Dynamic debates: An analysis of group
                            R EFERENCES                                           polarization over time on twitter,” Bulletin of Science, Technology &
 [1] Q. Ji and A. A. Raney, “Morally judging entertainment: A case study          Society, vol. 30, no. 5, pp. 316–327, 2010.
     of live tweeting during Downton Abbey,” Media Psychology, vol. 18,      [29] V. R. K. Garimella and I. Weber, “A long-term analysis of polarization
     pp. 221–242, 2015.                                                           on Twitter,” in Proc. ICWSM, 2017.
 [2] M. Lochrie and P. Coulton, “Mobile phones as second screen for TV,      [30] H. Kwak, C. Lee, H. Park, and S. Moon, “What is Twitter, a social
     enabling inter-audience interaction,” in Proc. ACM ACE, 2011.                network or a news media?” in Proc. WWW, 2010.
 [3] P. Mukherjee and B. J. Jansen, “Evaluating classification schemes for   [31] A. Mahanti, N. Carlsson, A. Mahanti, M. Arlitt, and C. Williamson, “A
     second screen interactions,” in Proc. IEEE ICNC, 2015.                       tale of the tails: Power-laws in internet measurements,” IEEE Network,
 [4] A. Bermingham and A. F. Smeaton, “An evaluation of the role of               vol. 27, no. 1, pp. 59–64, Jan/Feb. 2013.
     sentiment in second screen microblog search tasks,” in Proc. ICWSM,     [32] V. Paxson, M. Allman, J. Chu, and M. Sargent, “Computing TCP’s
     2012.                                                                        retransmission timer,” RFC 6298, IETF, June 2011.
You can also read