Event Detection in Twitter: A Keyword Volume Approach - arXiv
←
→
Page content transcription
If your browser does not render page correctly, please read the page content below
Event Detection in Twitter: A Keyword Volume
                                                                Approach
                                                                1st Ahmad Hany Hossny                                        2nd Lewis Mitchell
                                                            School of Mathematical Sciences                           School of Mathematical Sciences
                                                                 University of Adelaide                                    University of Adelaide
                                                                  Adelaide, Australia                                Data to Decisions CRC stream lead
                                                             ahmad.hossny@adelaide.edu.au                              lewis.mitchell@adelaide.edu.au

                                           Abstract—Event detection using social media streams needs a
arXiv:1901.00570v1 [cs.SI] 3 Jan 2019

                                        set of informative features with strong signals that need minimal
                                        preprocessing and are highly associated with events of interest.
                                        Identifying these informative features as keywords from Twitter
                                        is challenging, as people use informal language to express their
                                        thoughts and feelings. This informality includes acronyms, mis-
                                        spelled words, synonyms, transliteration and ambiguous terms.
                                        In this paper, we propose an efficient method to select the
                                        keywords frequently used in Twitter that are mostly associated               Fig. 1: The the proposed pipeline extracts the
                                        with events of interest such as protests. The volume of these                word-pairs matching events of interest, then use
                                        keywords is tracked in real time to identify the events of interest          the extracted word-pairs as features to detect
                                        in a binary classification scheme. We use keywords within word-              civil unrest events.
                                        pairs to capture the context. The proposed method is to binarize
                                        vectors of daily counts for each word-pair by applying a spike
                                        detection temporal filter, then use the Jaccard metric to measure
                                        the similarity of the binary vector for each word-pair with the       tracking the temporal patterns of keywords, clustering words
                                        binary vector describing event occurrence. The top n word-            into topics, or by evaluating sentiment scores and polarity.
                                        pairs are used as features to classify any day to be an event         The main challenge in keyword-based models is to determine
                                        or non-event day. The selected features are tested using multiple
                                        classifiers such as Naive Bayes, SVM, Logistic Regression, KNN
                                                                                                              which words to use in the first place, especially as people use
                                        and decision trees. They all produced AUC ROC scores up to 0.91       words in a non-standard way, particularly on Twitter.
                                        and F1 scores up to 0.79. The experiment is performed using the          In this research, we aim for detecting large events as
                                        English language in multiple cities such as Melbourne, Sydney         soon as they happen with near-live sensitivity. For example,
                                        and Brisbane as well as the Indonesian language in Jakarta. The       When spontaneous protests occur just after recent news such
                                        two experiments, comprising different languages and locations,
                                        yielded similar results.                                              as increasing taxes or decreasing budget, we need to have
                                           Index Terms—Social Networks, Event Detection, Civil Unrest,        indicators to raise the flag of a happening protest. Identifying
                                        Spike Matching, Feature Selection, keyword selection, Twitter         these indicators requires to select a set of words that are mostly
                                                                                                              associated with the events of interest such as protests. We then
                                                               I. I NTRODUCTION                               track the volume of these words and evaluate the probability
                                                                                                              of an event occurring given the current volume of each of
                                           Event detection is important for emergency services to react
                                                                                                              the tracked features. The main challenge is to find this set of
                                        rapidly and minimize damage. For example, terrorist attacks,
                                                                                                              features that allow such probabilistic classification.
                                        protests, or bushfires may require the presence of ambulances,
                                        firefighters, and police as soon as possible to save people. This        Using text as features in Twitter is challenging because of
                                        research aims to detect events as soon as they occur and are          the informal nature of the tweets, the limited length of the
                                        reported via some Twitter user. The event detection process           tweet, platform-specific language, and multilingual nature of
                                        requires to know the keywords associated with each event and          Twitter [14], [23], [29]. The main challenges for text analysis
                                        to assess the minimal count of each word to decide confidently        in Twitter are listed below:
                                        that an event has occurred. In this research, we propose a              1) The usage of misspelled words, acronyms, an non-
                                        novel method of spike matching to identify keywords, and use               standard abbreviations make words and expression not
                                        probabilistic classification to assess the probability of having           understandable.
                                        an event given the volume of each word.                                 2) The transliteration of non-Latin languages such as Ara-
                                           Event detection and prediction from social networks have                bic using the Latin script distorts the feature signal
                                        been studied frequently in recent years. Most of the predictive            where words with similar spelling have different mean-
                                        frameworks use textual content such as likes, shares, and                  ing in different languages (e.g. the term “boss” in
                                        retweets, as features. The text is used as features either by              English means “manager”, while in Arabic it means
“look”) .
3) The limited length of the tweets makes sentiment anal-
ysis and topic modelling pretty challenging.
4) Semantic ambiguity: a single word can refer to many
meanings (e.g. “strike” may refer to a lightning strike
or a protest or a football strike)
We approached the first and second challenges by using
a Bayesian approach to learn which terms were associated
with events, regardless of whether they are standard language,
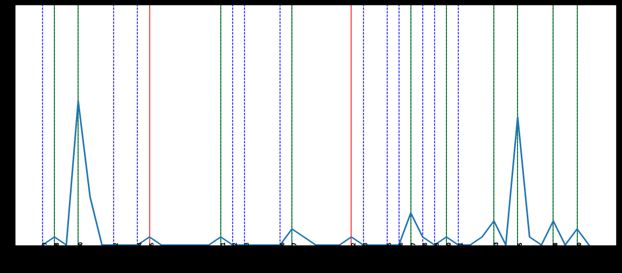
acronyms, or even a made-up word, so long as they match Fig. 2: The spikes in the time series signal for
the events of interest. The third and fourth challenges are the word-pair (‘Melbourne’,‘Ral’) are matched
approached by using word-pairs, where we extract all the pairs with the event days that represented as dotted
of co-occurring words within each tweet. This allows us to vertical lines. The green lines represent spikes
recognize the context of the word (’Messi’,’strike’ ) is different matching events. The Blue lines represent events
than (’labour’,’strike’). with no matching spikes and red lines represent
According to the distributional semantic hypothesis, event- spikes that did not match any event.
related words are likely to be used on the day of an event
more frequently than any normal day before or after the event.
This will form a spike in the keyword count magnitude along per day, with a total word-pair count of 12 million different
the timeline as illustrated in Figure 2. To find the words word-pairs per day, forming 6 billion word-pairs over the entire
most associated with events, we search for the words that timeframe. The selected word-pairs from in each city are used
achieve the highest number of spikes matching the days of as features to classify if there will be an event or not on a
events. We use the Jaccard similarity metric as it values the specific day in that city. We classified events from the extracted
spikes matching events and penalizes spikes with no event word-pairs using 9 classifiers including Naive Bayes, Decision
and penalizes events without spikes. Separate words can be Trees, KNN, SVM, and logistic regression.
noisy due to the misuse of the term by people, especially in In Section 2, we describe the event detection methods.
big data environments. So, we rather used the word-pairs as Section 3 states the known statistical methods used for data
textual features in order to capture the context of the word. association and feature selection. Section 4 describes the
For example, this can differentiate between the multiple usages proposed feature selection method. Section 5 describes model
of the word “strike” within the contexts of “lightning strike”, training and prediction. Section 6 describes the experiment
“football strike” and “labour strike” design, the data and the results. Section 7 summarizes the
In this paper, we propose a method to find the best word- paper, discuss the research conclusion and explains future
pairs to represent the events of interest. These word-pairs can work.
be used for time series analysis to predict future events as
indicated in Figure 1. They can also be used as seeds for
topic modelling, or to find related posts and word-pairs using II. E VENT D ETECTION M ETHODS
dynamic query expansion. The proposed framework uses a
temporal filter to identify the spikes within the word-pair Analyzing social networks for event detection is approached
signal to binarize the word-pair time series vector [20]. The from multiple perspectives depending on the research objec-
binary vector of the word-pair is compared to the protest days tive. This can be predicting election results, a contest winner,
vector using Jaccard similarity index [27], [5], where the word- or predicting peoples’ reaction to a government decision
pairs with highest similarity scores are the most associated through protest. The main perspectives to analyze the social
word-pairs with protest days. This feature selection method networks are (1) content analysis, where the textual content
is built upon the assumption that people discuss an event on of each post is analyzed using natural language processing to
the day of that event more than on any day before or after identify the topic or the sentiment of the authors. (2) Network
the event. This implies that word-pairs related to the event structure analysis, where the relation between the users are
will form a spike on this specific day. Some of the spiking described in a tree structure for the follower-followee patterns,
word-pairs are related to the nature of the event itself, such or in a graph structure for friendship and interaction patterns.
as “taxi protest” or “fair education”. These word-pairs will These patterns can be used to know the political preference
appear once or twice along the time frame. Meanwhile, more of people prior to elections. (3) Behavioural analysis of each
generic word-pairs such as “human rights” or “labour strike” user including sentiment, response, likes, retweets, location,
will spike more frequently in the days of events regardless the to identify responses toward specific events. This might be
protest nature. useful to identify users with terrorist intentions. In this section,
To test our method, we developed two experiments using we will focus on textual content-based models, where text
all the tweets in Melbourne and Sydney over a period of 640 analysis and understanding can be achieved using keywords,
days. The total number of tweets exceeded 4 million tweets topic modelling or sentiment analysis.A. Keyword-based approaches Cheng et al. suggested using space-time scan statistics to
detect events by looking for clusters within data across both
Keyword-based approaches focus on sequence analysis of
time and space, regardless of the content of each individual
the time series for each keyword. They also consider dif-
tweet [7]. The clusters emerging during spatio-temporal rele-
ferent forms for each keyword, including n-gram, skip-gram,
vant events are used as an indicator of a currently occurring
and word-pairs [11]. The keyword-based approaches use the
event, as people tweet more often about event topics and news.
concept of the distributional semantics to group semantically-
Ritter et al. proposed a framework that uses the calendar
related words as synonyms to be used as a single feature [19].
date, cause and event type to describe any event in a way
In this approach, keywords are usually associated with events
similar to the way Twitter users mention the important events.
by correlation, entropy or distance metrics. Also, Hossny et
This framework used temporal resolution, POS tagging, an
al. proposed using SVD with K-Means to strengthen keyword
event tagger, and named entity recognition. Once features are
signals, by grouping words having similar temporal patterns,
extracted, the association between the combination of features
then mapping them into one central word that has minimum
and the events is measured in order to know what are the most
distance to the other members of the cluster [17].
important features and how significant the event will be [31].
Sayyadi et al. used co-occurring keywords in documents
Zhou et al. introduced a graphical model to capture the
such as news articles to build a network of keywords. This
information in the social data including time, content, and
network is used as a graph to feed a community detection
location, calling it location-time constrained topic (LTT). They
algorithm in order to identify and classify events [34]. Takeshi
measure the similarity between the tweets using KL divergence
et al. created a probabilistic spatio-temporal model to identify
to assess media content uncertainty. Then, they measure the
natural disasters events such as earthquakes and typhoons
similarity between users using a “longest common subse-
using multiple tweet-based features such as words counts per
quence” (LCS) metric. They aggregate the two measurements
tweet, event-related keywords, and tweet context. They con-
by augmenting weights as a measure for message similarity.
sidered each Twitter user as a social sensor and applied both
They used the similarity between streaming posts in a social
of the Kalman filter and particle filter for location estimation.
network to detect social events [42].
This model could detect 96% of Japanese earthquakes [32].
Zhou et al. developed a named entity recognition model to Ifrim et al. presented another approach for topic detection
find location names within tweets and use them as keyword- that combines aggressive pre-processing of data with hierar-
features for event detection, then estimated the impact of the chical clustering of tweets. The framework analyzes different
detected events qualitatively [43]. factors affecting the quality of topic modelling results [18],
Weng et al. introduced “Event Detection by Clustering of along with real-time data streams of live tweets to produce
Wavelet-based Signals” (EDCow). This model used wavelets topic streams in close to real-time rate.
to analyze the frequency of word signals, then calculated Xing et al. presented the mutually generative Latent Dirich-
the autocorrelations of each word signal in order to filter let Allocation model (MGE-LDA) that uses hashtags and
outlier words. The remaining words were clustered using a topics, as they both are generated mutually by each other in
modularity-based graph partitioning technique to form events tweets. This process models the relationship between topics
[40]. Ning et al. proposed a model to identify evidence-based and hashtags in tweets, and uses them both as features for
precursors and forecasts of future events. They used as a set event discovery [41]. Azzam et al. used deep learning and co-
of news articles to develop a nested multiple instance learning sine similarity to understand short text posts in communities of
model to predict events across multiple countries. This model question answering[3], [4]. Also, Hossny et al. used inductive
can identify the news articles that can be used as precursors logic programming to understand short sentences from news
for a protest [26]. for translation purposes [16]
B. Topic modelling approaches C. Sentiment analysis approaches
Topic modelling approaches focus on clustering related The third approach is to identify sentiment through the
words according to their meaning, and indexing them using context of the post, which is another application for distri-
some similarity metric such as cosine similarity or Euclidean butional semantics requiring a huge amount of training data
distance. The most recognized techniques are (1) Latent to build the required understanding of the context. Sentiment
Semantic Indexing (LSI), where the observation matrix is analysis approaches focus on recognizing the feelings of
decomposed using singular value decomposition and the data the crowd and use the score of each feeling as a feature
are clustered using K-Means [19],(2) Latent Dirichlet Allo- to calculate the probability of social events occurring. The
cation (LDA), where the words are clustered using Gaussian sentiment can represent the emotion, attitude, or opinion of
mixture models (GMM) according to the likelihood of term the user towards the subject of the post. One approach to
co-occurrence within the same context [33], (3) Word2Vec, identify sentiment is to find smiley faces such as emoticons
which uses a very large corpus to compute continuous vector and emojis within a tweet or a post. Another approach is to
representations, where we can apply standard vector operations use a sentiment labelled dictionary such as SentiWordNet to
to map one vector to another [24]. assess the sentiment associated with each word.Generally, sentiment analysis has not been used solely to Distance correlation is introduced by Szekely et al . (2007)
predict civil unrest, especially as it still faces the challenges to measure the nonlinear association between two variables
of sarcasm and understanding negation in ill-formed sentences. [36]. Distance correlation measures the statistical distance
Meanwhile, it is used as an extra feature in combination with between probability distributions by dividing the Brownian
features from other approaches such as keywords and topic covariance (distance covariance) between X and Y by the
modelling. Paul et al. proposed a framework to predict the product of the distance standard deviations[37], [2].
results of the presidential election in the United States in TF-IDF is the short of term frequency-inverse document
2017. The proposed framework applied topic modelling to frequency technique that is used for word selection for classi-
identify related topics in news, then used the topics as seeds for fication problems. The concept of this technique is to give the
Word2Vec and LSTM to generate a set of enriched keywords. words that occur frequently within a specific class high weight
The generated keywords will be used to classify politics- as a feature and to penalize the words that occur frequently
related tweets, which are used to evaluate the sentiment among multiple classes. for example; the term “Shakespeare”
towards each candidate. The sentiment score trend is used to is considered a useful feature to classify English literature
predict the winning candidate [28]. documents as it occurs frequently in English literature and
rarely occurs in any other kind of documents. Meanwhile, the
III. F EATURE S ELECTION M ETHODS term “act” will occur frequently in English literature, but it
Keywords can be selected as features as a single term or a also occurs frequently in the other types of document, so this
word-pair or a skip-grams, which can be used for classification term will be weighted for its frequent appearance and it will
using multiple methods such as mutual information, TF-IDF, be penalized for its publicity among the classes by what we
χ2 , or traditional statistical methods such as ANOVA or call inverse-document-frequency[30].
correlation. Our problem faces two challenges: the first is the Mutual information is a metric for the amount of informa-
huge number of word-pairs extracted from all tweets for the tion one variable can tell the other one. MI evaluates how
whole time frame concurrently, which make some techniques similar are the joint distributions of the two variables with
such as TF-IDF and χ2 computationally unfeasible as they the product of the marginal distributions of each individual
require the technique to be distributable on parallel processors variable, which makes MI more general than correlation as
on a cluster. The second challenge is the temporal nature it is not limited by the real cardinal values, it can also be
of the data which require some techniques that can capture applied to binary, ordinal and nominal values[13]. As mutual
the distributional semantics of terms along with the ground information uses the similarity of the distribution, it is not
truth vector. In this section, we describe briefly a set of data concerned with pairing the individual observations of X and
association methods used to find the best word-pairs to identify Y as much as it cares about the whole statistical distribution
the event days. of X and Y. This makes MI very useful for clustering purposes
Pearson correlation measures the linear dependency of rather than classification purposes[38].
the response variable on the independent variable with the Cosine similarity metric calculates the cosine of the angle
maximum dependency of 1 and no dependency of zero. This between two vectors. The cosine metric evaluates the direction
technique needs to satisfy multiple assumptions to assess the similarity of the vectors rather the magnitude similarity. The
dependency properly. These assumptions require the signals cosine similarity score equals to 1 if the two vectors have the
of the variables to be normally distributed, homoskedastic, angle of zero between the directions of two vectors, and the
stationary and have no outliers [6], [15]. In social network and score is set to zero when the two vectors are perpendicular[9].
human-authored tweets, we cannot guarantee that the word- if the two vectors are oriented to opposite directions, the
pairs signals throughout the timeframe will satisfy the required similarity score is -1. Cosine similarity metric is usually used
assumptions. Another drawback for Pearson correlation is that in the positive space, which makes the scores limited within
zero score does not necessarily imply no correlation, while no the interval of [0,1].
correlation implies zero score. Jaccard index or coefficient is a metric to evaluate the
Spearman is a rank-based metric that evaluates the linear similarity of two sets by comparing their members to identify
association between the rank variables for each of the indepen- the common elements versus the distinct ones. The main
dent and the response variables. It simply evaluates the linear advantage of Jaccard similarity is it ignores the default value or
correlation between the ranked variables of the original vari- the null assumption in the two vectors and it only considers the
ables. Spearman correlation assumes the monotonicity of the non-default correct matches compared to the mismatches. This
variables but it relaxes the Pearson correlation requirements consideration makes the metric immune to the data imbalance.
of the signal to be normal, homoskedastic and stationary. Jaccard index is similar to cosine-similarity as it retains the
Although the text signals in the social network posts do not sparsity property and it also allows the discrimination of the
satisfy the monotonicity assumption, Spearman correlation can collinear vectors.
select some word-pairs to be used as predictive features for
classification. Spearman correlation has the same drawback of IV. S PIKE M ATCHING M ETHOD :
Pearson correlation that zero score does not necessarily imply The proposed model extracts the word-pairs having a high
no correlation while no correlation implies zero score. association with event days according to the distributionalFig. 3: The detailed pipeline for data processing, count vectorization, word-pair selection, training and prediction.
semantic hypothesis and use them for training the model that V. T RAINING AND P REDICTION
will be used later for the binary classification task[22] as
Once we identify the best word-pairs to be used as features
illustrated in figure 3. The first step is the data preparation
for classification, we split the time series vector of each word-
where we load all the tweets for each day, then we exclude
pair into a training vector and a testing vector. then we use the
the tweets having URLs or unrelated topics, then we clean
list of the training vectors of the selected word-pairs to train
each tweet by removing the hashtags, non-Latin script and
the model as explained in subsection V-A and use the list of
stopping words. Then we lemmatize and stem each word in
testing vectors for the same word-pairs to classify any day to
each tweet using Lancaster stemmer. Finally, we extract the
event/nonevent day V-B.
word-pairs in each tweet. The word-pair is the list of n words
co-occurring together within the same tweet. A. Training the model:
The second step is to count the frequency of each word-pair
The third step is to train the model using the set of features
per each day, which are used as features to classify the day
generated in the first step. We selected the Naive Bayes classi-
as either event or no-event day. The formulation is a matrix
fier to be our classification technique for the following reasons:
with rows as word-pairs and columns as days and values are
(1) the high bias of the NB classifier reduces the possibility of
daily counts of each word-pair. The third step is to binarize the
over-fitting, and our problem has a high probability of over-
event count vector (ground truth) as well as the vector of each
fitting due to the high number of features and the low number
word-pair. Binarizing the event vector is done by checking
of observations, (2) the response variable is binary, so we
if the count of events in each day is larger than zero. The
do not need to regress the variable real value as much as
binarization of the word-pair count vectors is done by applying
we need to know the event-class, and (3) The counts of the
a temporal filter to the time series in order to identify the spikes
word-pairs as independent variables are limited between 0 and
as explained in equation 1, where the days with spikes are set
100 occurrences per each day, which make the probabilistic
to ones and days without spike are set to zeros [12], [35].
approaches more effective than distance based approaches.
The training process aims to calculate three priori probabil-
1, if x(t)-x(t-1) < threshold and
ities to be used later in calculating the posterior probabilities:
f (x) = x(t)-x(t+1) > threshold (1) (1) the probability of each word-pair count in a specific day
given the status of the day as “event” or “non-event”. (2) the
0, Otherwise
priori conditional probability of each word-pair given event
Where x is the count of the word-pair, t is the time variable, status P (word−pair|Event). (3) the probability of each event
dt is the time difference, the threshold is the minimum height class as well as the probability of each word-pair as stated in
of the spike. Afterwards, we compare the binary vector for equations 4 and 4.
each word-pair with the ground truth binary vector using the Count(Eventc )
Jaccard similarity index as stated in equation 2 [27], [5]. P (Eventc ) = P (3)
c∈{0,1} Count(Eventc )
The word-pairs are then sorted descendingly according to the
similarity score. The word-pairs with the highest scores are P (W P ∩ Eventc )
used as a feature for training the model in the fourth step. P (W P |Eventc ) = (4)
P (Eventc )
where W P is the word-pair, Eventc is any class for event
P
W P ∩ GT min(W Pi , GTi ) occurrence and word-pair is the vector of counts for the word-
J(word − pair, GT ) = = Pi pairs extracted from tweets
W P ∪ GT i max(W Pi , GTi )
(2)
B. Predicting Civil Unrest
where WP is the word pair vector, GT is the ground truth Once the priori probabilities are calculated using the training
vector data, we use them to calculate the posterior probability of bothclasses of event-days and non-event-days given the values of score according to the number of word-pair spikes matching
the word-pairs using the equation 5. the event days. This method uses the concept of distributional
semantic, where the co-occurring signals are likely to be
P (Eventc |W P1 , W P2 , . . . , W Pn )
semantically associated [22].
P (W P1 , ..., W Pn ).P (Event)
= Example 1:
P (W P1 , . . . , W Pn ) (5) Original Tweet:
n
1 Y Protesters may be unmasked in wake of Coburg clash
= P (Event) P (W Pi |Event)
Z https://t.co/djjVIfzO3e (News) #melbourne #victoria
i=1
where W P is the word-pair, Z = P (W P 1, . . . ) = Cleaned Tweet:
P (W P1 ).P (W P2 ). . . . As the word-pairs are assumed to be protest unmask wake coburg clash news
independent and previously known from the training step.
VI. E XPERIMENTS AND R ESULTS List of two-words-word-pairs: [‘protest’, ‘unmask’],
[‘protest’, ‘wake’], [‘protest’, ‘Coburg’], . . . , [‘unmask’,
The experiments are designed to detect civil unrest events in
‘wake’], [‘unmask’, ‘coburg’],. . . , [‘clash’, ‘news’]
Melbourne on any specific day. In this experiment, we used all
the tweets posted from Melbourne within a time frame of 640
[‘protest’, ‘unmask’] training : [x1,1 , x1,2 , x1,3 , . . . , x1,641 ]
days between December 2015 and September 2017. This time
[‘protest’, ‘unmask’] testing : [x2,1 , x2,2 , . . . , x1,641 ]
frame will be split into 500 days for model training and 140
days for model testing on multiple folds. The tweet location is
Assuming a time frame of 20 days
specified using (1) longitude and latitude meta-tag, (2) tweet
word-pair: [2,3,3,4,5,3,2,3,8,3,3,1,3,9,3,1,2,4,5,1]
location meta-tag, (3) the profile location meta-tag, and (4)
Spikes (B OW
e ): [0,0,0,0,1,0,0,0,1,0,0,0,0,1,0,0,0,0,1,0]
The time zone meta-tag. The total number of tweets exceeded
Events(GT ): [0,0,0,0,1,0,0,0,0,0,0,0,0,1,0,0,1,0,1,0]
4 million tweets daily. Firstly, we cleaned the data from noisy
signals, performed stemming and lemmatization then extracted P
min(B OW
e i , GTi ) 3
the word-pairs from each tweet and count each word-pair per J(B OW , GT ) = P i
e =
i max(B OW i , GTi )
e 5
each day. Example 1 illustrates how each tweet is cleaned,
prepared and vectorized before being used for training the
model. The steps are explained below: Once we selected the most informative word-pairs as fea-
• The data is first cleaned by eliminating the tweets of tures, we will use the raw values to train the Naive Bayes
any language other than English, exclude the tweets classifier. The classifier is trained using 500 days selected
having URLs, remove the hash-tags, non-Latin alphabets, randomly along the whole timeframe, then it is used to predict
punctuation, HTML Tags, and remove the stopping words the other 140 days. To ensure the robustness of our experiment,
listed by NLTK [21]. We applied 10-folds cross-validation, where we performed the
• Extract the word-pairs from each tweet by generating same experiment 10 times using 10 different folds of randomly
a list of every two co-occurring words. The number of selected training and testing data. The prediction achieved an
word-pairs extracted from a tweet with size m equals average area under the ROC curve of 90%, which statistically
m ∗ (m − 1) . Each tweet consists of average 12 words, significant and achieved F-score of 91%, which is immune
which construct 132 word-pairs per tweet on average. to data imbalance as listed in table I. Figure 4 shows the
The average count of daily different word-pairs exceeds ROC curves for the results of a single fold of Naive Bayes
10 million after excluding repeated word-pairs and the classification that uses the features extracted by each selection
word-pairs with single appearance. methods. The classification results of the proposed method
• The words in each word-pair are lemmatized using NLTK outperformed the benchmarks and state of the art developed
lemmatizer in order to avoid the morphological effects to by Cui et al. (2017), Nguyen et al. (2017), Willer et al. (2016),
the word shape (e.g. bought → buy) and Adedoyin-Olowe et al. (2016) as illustrated in the table
• The words in each word-pair are then stemmed by IV [40], [8], [39], [10], [1], [25].
Lancaster stemmer in order to return related words to The same experiment has been applied to Sydney, Brisbane
their dictionary roots (E.g., Turkish → Turk) and Perth in Australia on a time frame of 640 days with
• The word-pairs are then counted per day for all the tweets 500 days training data and 140 days testing data and the
from Melbourne in order to construct the term frequency results were similar to Melbourne results with average AUC
vectors. of 0.91 and average F-Score of 0.79. To ensure that the
As explained in example 1, each word-pair will be trans- proposed method is language independent, we used the same
formed from a vector of integer values into a vector of binary method to classify civil unrest days in Jakarta using the
values and denoted as B OWe . B OW e will be used to calculate Indonesian language, the classification scores were lower than
the Jaccard similarity index of the binary vector with the the average scores for English language by 0.05 taking into
events binary vector. Each word-pair will have a similarity consideration that we did not apply any NLP pre-processingTABLE I: Event detection results for 10 randomized folds using the metrics of accuracy, precision, recall, F1,
Area under ROC curve and area under PR curve
method AUC ROC F1s AUPR Precision Recall Accuracy
Pearson correlation 0.759 0.517 0.457 0.658 0.431 0.758
distance correlation 0.831 0.677 0.564 0.687 0.669 0.807
Mutual Information 0.552 0.426 0.321 0.328 0.613 0.504
Jaccard similarity 0.894 0.794 0.676 0.727 0.878 0.862
Cosine similarity 0.651 0.397 0.358 0.431 0.405 0.653
Spike matching 0.913 0.793 0.689 0.770 0.821 0.873
TABLE II: A comparison of classification AUCs using word-pairs extracted by different feature selection methods
method NB SVM MLP LDA GPC LR RF DT KNN
Pearson Correlation 0.759 0.555 0.778 0.563 0.598 0.784 0.740 0.720 0.614
Distance correlation 0.831 0.589 0.874 0.713 0.667 0.875 0.866 0.814 0.637
Mutual Information 0.558 0.554 0.509 0.525 0.502 0.539 0.559 0.531 0.511
Jaccard Similarity 0.894 0.659 0.951 0.795 0.598 0.955 0.934 0.921 0.691
Cosine Similarity 0.651 0.561 0.591 0.527 0.497 0.670 0.528 0.600 0.523
Spike Matching 0.913 0.517 0.963 0.759 0.891 0.966 0.965 0.929 0.657
(a) Pearson Correlation ROC (b) Distance correlation ROC (c) Mutual-Information Roc
(d) Cosine Similarity ROC (e) Jaccard Similarity ROC (f) Spike Matching ROC
Fig. 4: ROC curves for Naive Bayes classification using features extracted by different selection methods
TABLE III: The average results of event detection in multiple cities using multiple metrics after cross validating
the results on 10 folds
City Accuracy Precision Recall F1 AUC PR AUC ROC
Melbourne 0.873 0.770 0.820 0.793 0.688 0.913
Sydney 0.860 0.707 0.770 0.719 0.640 0.897
Brisbane 0.855 0.514 0.612 0.528 0.449 0.791
Perth 0.903 0.605 0.797 0.686 0.574 0.886
Jakarta 0.762 0.816 0.706 0.705 0.735 0.860
to the Indonesian tweets such as stemming and lemmatization. VII. C ONCLUSIONS
In this paper, we proposed a framework to detect civil unrest
events by tracking each word-pair volume in twitter. The main
challenge with this model is to identify the word-pairs that
To verify the robustness of this feature selection method, are highly associated with the events with predictive power.
we tested the selected features using multiple classifiers such We used temporal filtering to detect the spike within the time
as KNN, SVM, naive Bayes and decision trees. The results series vector and used Jaccard similarity to calculate the scores
emphasized that the word-pairs selected using the spike- of each word-pair according to its similarity with the binary
matching method achieve better AUC scores than the other vector of event days. These scores are used to rank the word-
correlation methods as listed in table II pairs as features for prediction.TABLE IV: The classification scores compared to benchmarks
Author Ref Method F-score Accuracy
Cui et al. (2017) [10] used a graph based key-phrase extraction algorithm (TextRank) 0.65
to extract the key-phrases matching the events.
Weng et al. (2011)) [40] EDCoW: Clustering of Wavelet-based Signals followed by dis- 0.43
crete wavelet analysis for each term
Crodeiro et al. (2012) [8] WATIS: Wavelet Analysis Topic Inference Summarization 0.43
Adedoyin-Olowe et al. (2016) [1] Transaction-based Rule Mining to extract worthy hashtag key- 0.77
words
Proposed method Keyword volume and spike matching approach 0.79 0.87
Once the word-pairs are identified, we trained a Naive Bayes [7] T. Cheng and T. Wicks. Event detection using twitter: a spatio-temporal
classifier to identify any day in a specific region to be an approach. PloS one, 9(6):e97807, 2014.
[8] M. Cordeiro. Twitter event detection: combining wavelet analysis and
event or non-event days. We performed the experiment on both topic inference summarization. In Doctoral symposium on informatics
Melbourne and Sydney regions in Australia, and we achieved engineering, pages 11–16, 2012.
a classification accuracy of 87% with the precision of 77%, [9] D. Crandall, D. Cosley, D. Huttenlocher, J. Kleinberg, and S. Suri.
Recall of 82 %, area under the ROC curve of 91% and F-Score Feedback effects between similarity and social influence in online
communities. In Proceedings of the 14th ACM SIGKDD international
of 79%. The results are all achieved after 10-folds randomized conference on Knowledge discovery and data mining, pages 160–168.
cross-validation as listed in table III. ACM, 2008.
The main contributions of this paper are (1) to overcome [10] W. Cui, P. Wang, Y. Du, X. Chen, D. Guo, J. Li, and Y. Zhou. An
algorithm for event detection based on social media data. Neurocom-
twitter challenges of acronyms, short text, ambiguity and puting, 254:53 – 58, 2017. Recent Advances in Semantic Computing
synonyms, (2) to identify the set of word-pairs to be used and Personalization.
as features for live event detection, (3) to build an end-to-end [11] J. Fernández, Y. Gutiérrez, J. M. G. Soriano, and P. Martı́nez-Barco.
Gplsi: Supervised sentiment analysis in twitter using skipgrams. In
framework that can detect the events lively according to the SemEval@ COLING, pages 294–299, 2014.
word counts. This work can be applied to similar problems, [12] F. Franke, M. Natora, C. Boucsein, M. H. Munk, and K. Obermayer.
where specific tweets can be associated with life events such An online spike detection and spike classification algorithm capable of
as disease outbreak or stock market fluctuation. This work can instantaneous resolution of overlapping spikes. Journal of computational
neuroscience, 29(1-2):127–148, 2010.
be extended to predict future events with one day in advance, [13] A. M. Fraser and H. L. Swinney. Independent coordinates for strange
where we will use the same method for feature selection in attractors from mutual information. Physical review A, 33(2):1134, 1986.
addition to to time series analysis of the historical patterns of [14] G. P. C. Fung, J. X. Yu, P. S. Yu, and H. Lu. Parameter free
bursty events detection in text streams. In Proceedings of the 31st
the word-pairs. international conference on Very large data bases, pages 181–192.
VLDB Endowment, 2005.
VIII. ACKNOWLEDGMENTS [15] L. L. Havlicek and N. L. Peterson. Robustness of the pearson corre-
This research was fully supported by the School of Math- lation against violations of assumptions. Perceptual and Motor Skills,
43(3 suppl):1319–1334, 1976.
ematical Sciences at the University of Adelaide. All the data,
[16] A. Hossny, K. Shaalan, and A. Fahmy. Machine translation model using
computation and technical framework were supported by Data- inductive logic programming. In Natural Language Processing and
To-Decision-Collaborative-Research-Center (D2DCRC). Knowledge Engineering, 2009. NLP-KE 2009. International Conference
on, pages 1–8. IEEE, 2009.
R EFERENCES [17] A. H. Hossny, T. Moschuo, G. Osborne, L. Mitchell, and N. Lothian.
Enhancing keyword correlation for event detection in social networks
[1] M. Adedoyin-Olowe, M. M. Gaber, C. M. Dancausa, F. Stahl, and J. B. using svd and k-means: Twitter case study. Social Network Analysis
Gomes. A rule dynamics approach to event detection in twitter with and Mining, 8(1):49, Jul 2018.
its application to sports and politics. Expert Systems with Applications, [18] G. Ifrim, B. Shi, and I. Brigadir. Event detection in twitter using ag-
55:351 – 360, 2016. gressive filtering and hierarchical tweet clustering. In Second Workshop
[2] A. Ayache, S. Cohen, and J. L. Véhel. The covariance structure of on Social News on the Web (SNOW), Seoul, Korea, 8 April 2014. ACM,
multifractional brownian motion, with application to long range depen- 2014.
dence. In Acoustics, Speech, and Signal Processing, 2000. ICASSP’00.
[19] T. K. Landauer. Latent semantic analysis. Wiley Online Library, 2006.
Proceedings. 2000 IEEE International Conference on, volume 6, pages
3810–3813. IEEE, 2000. [20] M. S. Lewicki. A review of methods for spike sorting: the detection
[3] A. Azzam, N. Tazi, and A. Hossny. A question routing technique and classification of neural action potentials. Network: Computation in
using deep neural network for communities of question answering. In Neural Systems, 9(4):R53–R78, 1998.
S. Candan, L. Chen, T. B. Pedersen, L. Chang, and W. Hua, editors, [21] E. Loper and S. Bird. Nltk: The natural language toolkit. In Proceedings
Database Systems for Advanced Applications, pages 35–49, Cham, 2017. of the ACL-02 Workshop on Effective Tools and Methodologies for
Springer International Publishing. Teaching Natural Language Processing and Computational Linguistics
[4] A. Azzam, N. Tazi, and A. Hossny. Text-based question routing for - Volume 1, ETMTNLP ’02, pages 63–70, Stroudsburg, PA, USA, 2002.
question answering communities via deep learning. In Proceedings of Association for Computational Linguistics.
the Symposium on Applied Computing, SAC ’17, pages 1674–1678, New [22] P. Mandera, E. Keuleers, and M. Brysbaert. Explaining human per-
York, NY, USA, 2017. ACM. formance in psycholinguistic tasks with models of semantic similarity
[5] J. Bank and B. Cole. Calculating the jaccard similarity coefficient with based on prediction and counting: A review and empirical validation.
map reduce for entity pairs in wikipedia. Wikipedia Similarity Team, Journal of Memory and Language, 92:57–78, 2017.
pages 1–18, 2008. [23] M. Mathioudakis and N. Koudas. Twittermonitor: Trend detection
[6] J. Benesty, J. Chen, Y. Huang, and I. Cohen. Pearson correlation over the twitter stream. In Proceedings of the 2010 ACM SIGMOD
coefficient. In Noise reduction in speech processing, pages 1–4. Springer, International Conference on Management of Data, SIGMOD ’10, pages
2009. 1155–1158, New York, NY, USA, 2010. ACM.[24] T. Mikolov, I. Sutskever, K. Chen, G. S. Corrado, and J. Dean. Dis-
tributed representations of words and phrases and their compositionality.
In Advances in neural information processing systems, pages 3111–
3119, 2013.
[25] D. T. Nguyen and J. E. Jung. Real-time event detection for online
behavioral analysis of big social data. Future Generation Computer
Systems, 66:137 – 145, 2017.
[26] Y. Ning, S. Muthiah, H. Rangwala, and N. Ramakrishnan. Modeling
precursors for event forecasting via nested multi-instance learning. arXiv
preprint arXiv:1602.08033, 2016.
[27] S. Niwattanakul, J. Singthongchai, E. Naenudorn, and S. Wanapu. Using
of jaccard coefficient for keywords similarity. In Proceedings of the
International MultiConference of Engineers and Computer Scientists,
volume 1, 2013.
[28] D. Paul, F. Li, M. K. Teja, X. Yu, and R. Frost. Compass: Spatio
temporal sentiment analysis of us election what twitter says! In
Proceedings of the 23rd ACM SIGKDD International Conference on
Knowledge Discovery and Data Mining, pages 1585–1594. ACM, 2017.
[29] S. Petrović, M. Osborne, and V. Lavrenko. Streaming first story detection
with application to twitter. In Human Language Technologies: The 2010
Annual Conference of the North American Chapter of the Association
for Computational Linguistics, HLT ’10, pages 181–189, Stroudsburg,
PA, USA, 2010. Association for Computational Linguistics.
[30] J. Ramos et al. Using tf-idf to determine word relevance in document
queries. In Proceedings of the first instructional conference on machine
learning, volume 242, pages 133–142, 2003.
[31] A. Ritter, O. Etzioni, S. Clark, et al. Open domain event extraction
from twitter. In Proceedings of the 18th ACM SIGKDD international
conference on Knowledge discovery and data mining, pages 1104–1112.
ACM, 2012.
[32] T. Sakaki, M. Okazaki, and Y. Matsuo. Earthquake shakes twitter users:
real-time event detection by social sensors. In Proceedings of the 19th
international conference on World wide web, pages 851–860. ACM,
2010.
[33] K. Sasaki, T. Yoshikawa, and T. Furuhashi. Online topic model for
twitter considering dynamics of user interests and topic trends. In
EMNLP, pages 1977–1985, 2014.
[34] H. Sayyadi, M. Hurst, and A. Maykov. Event detection and tracking in
social streams. In Icwsm, 2009.
[35] N. Sharafi, J. Benda, and B. Lindner. Information filtering by syn-
chronous spikes in a neural population. Journal of computational
neuroscience, 34(2):285–301, 2013.
[36] G. J. Székely, M. L. Rizzo, N. K. Bakirov, et al. Measuring and
testing dependence by correlation of distances. The annals of statistics,
35(6):2769–2794, 2007.
[37] G. J. Székely, M. L. Rizzo, et al. Brownian distance covariance. The
annals of applied statistics, 3(4):1236–1265, 2009.
[38] P. Viola and W. M. Wells III. Alignment by maximization of mutual
information. International journal of computer vision, 24(2):137–154,
1997.
[39] A. Weiler, M. Grossniklaus, and M. H. Scholl. An evaluation of the
run-time and task-based performance of event detection techniques for
twitter. Information Systems, 62:207 – 219, 2016.
[40] J. Weng and B.-S. Lee. Event detection in twitter. ICWSM, 11:401–408,
2011.
[41] C. Xing, Y. Wang, J. Liu, Y. Huang, and W.-Y. Ma. Hashtag-based
sub-event discovery using mutually generative lda in twitter. In AAAI,
pages 2666–2672, 2016.
[42] X. Zhou and L. Chen. Event detection over twitter social media streams.
The VLDB journal, 23(3):381–400, 2014.
[43] Y. Zhou, S. De, and K. Moessner. Real world city event extraction from
twitter data streams. Procedia computer science, 98:443–448, 2016.You can also read