Content based News Recommendation via Shortest Entity Distance over Knowledge Graphs
←
→
Page content transcription
If your browser does not render page correctly, please read the page content below
Content based News Recommendation via Shortest
                                              Entity Distance over Knowledge Graphs
arXiv:1905.13132v1 [cs.IR] 24 May 2019

                                                          Kevin Joseph                           Hui Jiang
                                                    KevinJoseph774@gmail.com                  hj@cse.yorku.ca

                                                                             Abstract
                                                   Content-based news recommendation systems need to recommend
                                               news articles based on the topics and content of articles without using
                                               user specific information. Many news articles describe the occurrence
                                               of specific events and named entities including people, places or ob-
                                               jects. In this paper, we propose a graph traversal algorithm as well as
                                               a novel weighting scheme for cold-start content based news recommen-
                                               dation utilizing these named entities. Seeking to create a higher degree
                                               of user-specific relevance, our algorithm computes the shortest distance
                                               between named entities, across news articles, over a large knowledge
                                               graph. Moreover, we have created a new human annotated data set
                                               for evaluating content based news recommendation systems. Exper-
                                               imental results show our method is suitable to tackle the hard cold-
                                               start problem and it produces stronger Pearson correlation to human
                                               similarity scores than other cold-start methods. Our method is also
                                               complementary and a combination with the conventional cold-start rec-
                                               ommendation methods may yield significant performance gains. The
                                               dataset, CNRec, is available at: https://github.com/kevinj22/CNRec

                                         1    INTRODUCTION
                                         News recommendation is a pivotal part of many major web portals and it is
                                         important for these search portals to recommend the “right” news articles,
                                         at the right time. Recommending news articles is one of the most challeng-
                                         ing recommendation tasks because news providers generally allow users to
                                         read news articles anonymously. As a consequence, most news recommen-
                                         dation systems have to cope with the hard “cold start” problem: making
                                         recommendations without explicit user feedback.
                                             A major difficulty in content-based news recommendation is that the
                                         similarity between news articles does not necessarily reflect their relatedness.

                                                                                  1
For instance, two news articles might share a majority of words, yet their
actual topic could be very different. Additionally one user’s opinion of what
is a good recommendation may significantly differ from another’s. Over-
specialization is also a problem with news recommendation Ozgobek et al.
(2014). In the news domain, many articles on the same topic are typically
written differently on separate news portals. These articles, if recommended
to the same reader, may result in a poor recommendation. Furthermore, the
unstructured format of news articles makes it more difficult to automatically
analyze their content than structured properties such as goods or services.
A common element across news stories is the description of specific events
and/or updates about particular entities including people, places or objects.
As these entities already represent key data related to the article, any ad-
ditional information extracted about them could be used to make more
informed recommendations. For instance, two news articles might share
many common words, but the extra information gained through a knowledge
graph may help to differentiate them. Through named entity disambiguation
(NED), we determine the proper entity link from an optimized knowledge
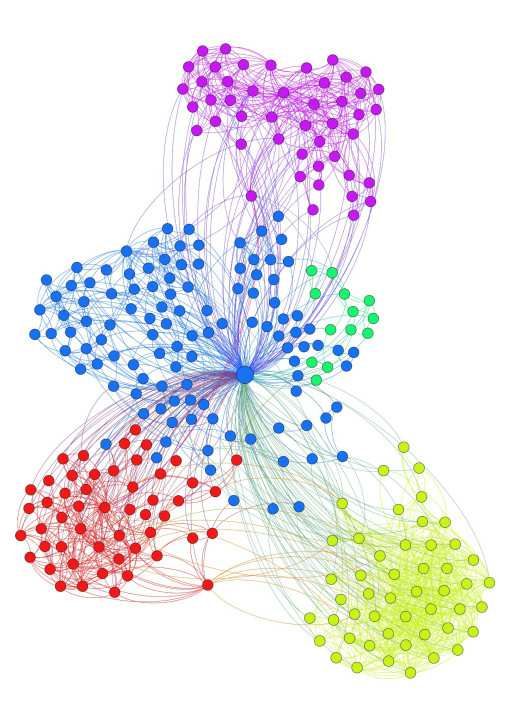
graph. Based on these entity links, a sub-graph can be created for each
article, as shown in Figure 1. These articles are effectively embedded in the
same space over the knowledge graph.
If the sub-graphs do not completely overlap, we assume these two articles
mention related topics, but not the exactly same ones. In this case, it may
be a good idea to make a content-based recommendation based on their dis-
tance over the knowledge graph. To do this we propose a new content-based
news recommendation algorithm, which leverages the vast amount of in-
formation between these sub-graphs from a curated knowledge graph. This
algorithm, similar to Schuhmacher and Ponzetto (2014), computes the single
source shortest path distance (SSSP), between two sub-graphs. Our experi-
mental results have shown our proposed method produces stronger Pearson
correlation to human similarity scores than other cold-start recommenda-
tion methods. Our method is also complementary to these conventional
cold-start recommendation methods since an ensemble of them may yield
significant performance gains. As the knowledge graph used in this work,
Freebase Bollacker et al. (2008), is extremely large, we focus our work on
attaining the best results using the least data.
Unfortunately the similarity of two documents does not necessarily in-
dicate that they would be a good recommendation to a user. Thus bench-
marking using the LeePincombeWelsh (LG50) Lee and Welsh (2005) similar-
ity dataset such as in Paul et al. (2016), Passant (2010b), and Schuhmacher
and Ponzetto (2014) would not be a good indicator of recommendation per-
2Figure 1: Each news article is represented as a subgraph (with different
colours) in a large knowledge graph via named entity disambiguation.
formance.
To get direct feedback, live recommendation tests as in Kille et al. (2017)
can be used, although this is time consuming and expensive. Live tests also
exhibit time constraints that may not allow parameter tuning with algo-
rithms requiring pre training or pre computations. For the reasons above
we believe it is necessary to provide a new human annotated data set, CN-
Rec. CNRec provides human annotated document-wise similarity scores as
well as whether a pair of articles is considered as a good recommendation
by human. This paper will also cover the creation of CNRec 1 . All results in
this paper utilize CNRec. We hope CNRec will be used as a benchmark task
for evaluating various cold-start news recommendation tasks in the research
community.
2 Related Work
Here we will briefly review related work on two topics: graph-based docu-
ment similarity and content based news recommendation.
2.1 Graph-Based Document Similarity
PathSim in Sun et al. (2011) defines a path between two sub-graphes A and
B as the connectivity via the number of paths from A to B divided by the
total number of path instances from A to B and B to A. HeteSim in Shi et al.
(2013) computes the relatedness between A and B as the overlap between the
out-neighbors of A and the in-neighbors of B. Leal et al. Leal et al. (2012) use
a proximity metric as a measure of similarity among nodes, where proximity
1
CNRec is available here: https://github.com/kevinj22/CNRec.
3is defined as the state of being near in space, time, or relationship. Lam
et al. Lam (2013) use a TF-IDF-inspired edge weighting scheme, combined
with Markov centrality, to compute entity similarity. Palma et al. Palma
et al. (2013) describe an annotation similarity measure, called AnnSim, to
evaluate similarity using a 1-1 maximal matching of annotations. SemStim
algorithm Heitmann and Hayes (2016) is based on PageRank and completes
many random walks over all neighbors of a nodes.
Nunes et al. Nunes et al. (2013) present a document similarity approach
where a document-wise connectivity score is computed based on the number
of paths between document annotations. In a follow-up paper ,Nunes et
al. use traditional TF-IDF to select top entities for each document. In
Passant (2010b,a), Passant also computes all paths between two nodes and
the number of direct and distinct links between resources in a graph, which
are used to determine the similarity of two entities for recommendation.
Zhu et. al. Zhu and Iglesias (2017) propose to use WordNet Miller
(1995) and DBpedia Auer et al. (2007) to determine the semantic similarity
between concepts. They have attained the state of the art performance using
a weighted shortest distance metric based on the least common subsumer
measure extracted from graphs. This method measures similarity between
pairs of nodes in a graph. In comparison, our work compares news articles
by groups of nodes, i.e. sub-graphs.
In Schuhmacher and Ponzetto (2014), similarity is measured based on
entity linking and analysis of entity neighborhood in DBpedia, where infor-
mation content is used to weight edges to compute the SSSP between all
pairs entities in documents. In this work, we use a much larger knowledge
graph, i.e., Freebase Bollacker et al. (2008), and compute the average mini-
mum symmetric distance across all pairwise entities between two articles.
2.2 Content-based News Recommendation
Term frequency inverse document frequency (TF-IDF) is a simple and pop-
ular method originally proposed for information retrieval Ramos (2003).
TF-IDF is also widely used to determine the relative frequency of words in
documents for content-based recommendation Ozgobek et al. (2014).
Doc2vec in Le and Mikolov (2014) is an extension to learn an embedding
vector for each document, where the order of words in the document is ig-
nored and the objective is to predict a context word given the concatenated
document and word vectors Lau and Baldwin (2016). The learned docu-
ment embedding vectors can be simply used to compute similarity between
documents for content-based recommendation.
4Bayesian Networks is a popular algorithm to model user interests in news
recommendation Yang and Yeung (2010), Wen et al. (2012). Context trees
for news recommendation are proposed in Garcin et al. (2013) LDA is used
in Li et al. (2011) to represent topic distributions Ozgobek et al. (2014).
Das et al. (2007) proposes locality sensitive hashing (LSH) and Li et al.
(2011) uses MinHash, i.e., a probabilistic clustering method. MinHash has
also been combined with probabilistic latent semantic indexing (pLSI) in
Das et al. (2007).
In Tavakolifard et al. (2013), a pre-trained named entity recognition
(NER)model is applied to each news article. Based on the identified entities
from articles, they determine user’s long-term preferences for collaborative
filtering. In this paper, rather than building user profile, we also leverage
named entity information to improve content based recommendation rather
than collaborative filtering. Li et al. (2011), Tavakolifard et al. (2013) and
Ozgobek et al. (2014) survey more natural language processing techniques
used for news recommendation.
2.3 Collaborative Filtering
In collaborative filtering, recommendations are done by using the other pref-
erences which are similar to the current users’ past preferences. As this work
focuses solely on content based recommendations this will not be covered
here.
3 Data Set: CNRec
CNRec provides document to document similarity as well as whether a pair
of articles was considered a good recommendation. The CNRec data set con-
sists of 2700 pairs of news articles, selected from 30 groupings of 10 articles
of human perceived similarity 3. In total we have 300 unique news articles
originally published in a period of 3 consecutive days between August 25-28,
2014. Each article is paired with all other articles in the same group. This
results in 45 pairs that should produce positive similarity ratings. Another
45 pairs are randomly generated across other groups resulting in 2700 total
pairs. The 3 day period, as well as the grouping and pairing procedure,
provides a ideal set of articles to process. It allows engineers to focus on
direct algorithm design rather than filtering relevant articles by time, or
overlapping entities Paul et al. (2016), before computations.
Each pair of articles is rated by 6 human annotators against two ques-
tions:
51. In terms of content delivered, how similar do you think these two
articles are? The annoators were given 3 choices: Not Similar / Simi-
lar/ Very Similar. Their answers were converted into numerical values
0/1/2 .
2. If one of these articles was recommended based on the other would
you have followed the link? Each annotator choose between NO and
YES, which were converted to numerical values 0/1.
Referencing Figure 2, CnRec indicates there is a 21.42%, 43.40%, 35.18%
split between similarity ratings leading to a good recommendation and a
73.71 Pearson correlation between similarity rating and good recommenda-
tions. This indicates that a high similarity does not mean a good recom-
mendation.
Percent of Good Recommendations Per Similarity Rating
Very Similar
Sim Rating
Similar
Not Similar
0.0 0.1 0.2 0.3 0.4
Percent of Good Recs
Figure 2: Similarity Rating Percent of Good Recommendations
4 Entity Shortest Distance Over Knowledge Graphs
In this section, we introduce the main ideas of the method we propose for
content-based news recommendation, namely entity shortest distance over
knowledge graphs (SED).
4.1 Knowledge Graphs
Many public Knowledge Graphs (KGs) are currently available. These in-
clude Freebase, DBpedia, and YAGO. Each network records millions of con-
cepts, entities and their relationships.
61. D’oh! Homer Simpson takes ALS Ice Bucket Challenge
2. McHendry Local pastor takes part in Ice Bucket Challenge
3. Pub manager to have ice cold water poured over him tonight
4. Woman has different take on ALS Ice Bucket Challenge
5. Let me tell you about my hero, the man who beat ALS
6. Facebook user claims that only 7% of ALS challenge donations go
towards charity
7. Anti-Abortion Activists Have a Big Problem With the Ice Bucket
Challenge
8. ALS Ice Bucket Challenge Charity challenge hits Chelmsford
9. Downton Abbey’s Michelle Dockery’s completes the ALS Ice Bucket
challenge
10. George RR Martin does Ice Bucket Challenge (then slips in the pool)
Figure 3: Example CNRec Similar Group Article Titles
As news articles are centered on various named entities, one could hy-
pothesize that by using a knowledge graph composed of said entities, a
reasonable recommendation could be made. In this paper all experiments
are conducted with the Freebase Bollacker et al. (2008) KG. In Freebase all
relationships are modeled in the Resource Description Framework (RDF)
format Bollacker et al. (2008), where each node edge pair is modeled in an
object-orientated manner as object-predicate-subject. A leaf, a vertex of out
degree 1, in Freebase is a human readable string used to assign values to
an entities, such as birthdays or genders. The edges in Freebase are labeled
by a predicate which exhibits a domain.type.property relationship between
its related vertices Bollacker et al. (2008). Note that Freebase is originally
modeled as a directed graph but we do not consider the direction of edges
because most relations have a sound inverse relation, such as nationalyOf
and ofNationality. This decision follows that of Schuhmacher and Ponzetto
(2014), Heitmann and Hayes (2016), and Zhu and Iglesias (2017).
Freebase is a huge knowledge graph consisting of approximately 1.9 bil-
lion triplets Bollacker et al. (2008). Any undirected simple graph G holds
7|E|
needs to be a node in Freebase associated with Apple Inc. rather than the
fruit. In this work, we do not study how to improve EDL performance, but
directly use an off-the-shelf EDL system Liu et al. ([n. d.]); Mingbin et al.
(2016). This system won the TAC KBP trilingual EDL competition in 2016
Ji and Nothman (2016).

4.2.2    Sub-graph Creation
After EDL, each news article may be represented as a sub-graph in the
shared knowledge graph. To produce a sub-graph, we start with a set of
discovered entities N and create a labeled undirected graph G = (V, E). First
we set of nodes V of G be composed of all discovered entities: V = N . Next
for each entity n in N we expand the nodes in G. This is done by performing a
breadth first search on Freebase adding all outgoing relations. Loops are not
added in graph creation. When used with our proposed weighting scheme all
connections between node pairs are collapsed into one. All related predicates
are then stored in an edge list. As our proposed weighting scheme considers
the number of common neighbors, these paths would all be weighted equally.
This removes the necessity of keeping all unique connections between nodes,
reducing computational complexity. We expand up to a maximal length L
for each discovered entity effectively adding all simple paths of up to length
L. From this we attain a sub-graph of Freebase. This graph is composed of
the discovered entities and their related concepts along all paths of maximal
length L that connect them.

4.2.3    Shortest Distance Between Articles
The most intuitive information for similarity or relatedness between any two
articles is the distance between their sub-graphs in the KG. Conceptually
speaking, the closer these two sub-graphs are located to each other, the more
similar these two articles may be.
    Let P(ni , nj ) = {P1 , P2 , ..., Pk } be the set of all possible paths connecting
the nodes ni and nj with cardinality or size N. Let |Pi | denote the length of
a path Pi ∈ P(ni , nj ), then D(ni , nj ) = min(|Pk |) denotes the shortest path
length between two nodes, namely shortest distance between them over G.
    With EDL, a set of named entities is extracted from each article. After
linking them to nodes in KG, each article is modeled by a subgraph in
KG. As symmetric algorithms are provided in Sun et al. (2011), Shi et al.
(2013), Sanfeliu and Fu (1983), and Paul et al. (2016) and one can easily
derive asymmetric version we only present the symmetric version of SED.

                                          9
We measure the similarity between two articles, e.g. S1 and S2 , based on the
shortest distance between their subgraphs over the KG, denoted D(S1 , S2 )
as:
D(S1 , S2 ) + D(S2 , S1 )
D̂(S1 , S2 ) =
2
P
minn∈S2 D(m,n)
where D(S1 , S2 ) = m∈S1 |S1 | .
Note that this method provides an average minimum row-wise distance.
This can easily be modified to use the average or sum of distance across all
all pairwise nodes between two articles. By using the minimum we focus
on the best pair of entities which has a higher probability of cooccurring
in documents. This follows Paul et al. (2016) which computes an average
maximum symmetric similarity between two articles. If we impose weights
onto all edges in KG, we may compute weighted shortest distance as the
sum of all weights along the traversed edges.
5 Creating the Optimal Subgraph
There are many practical issues to be considered in creating the subgraph
for each news article. In this section, we will discuss some of these practical
issues.
5.1 Maximal Length Expansion L
Does a larger graph have a significant impact on performance? Following
a large body of evidence from work Hulpus et al. (2013), Schuhmacher and
Ponzetto (2014), Sun et al. (2011) and Paul et al. (2016) we only consider
1 and 2 hop graph creation. Additionally by using the union of two articles
subgraphs, these 1 and 2 hops per node, which have been noted to have high
predictive power, allow for longer relevant path lengths between the articles.
5.2 Pre-Screening Entities
Assume a set of named entities is identified by the EDL system Xu et al.
(2017) for an article, how do we know whether some entities are more im-
portant than others or to treat them all equally? One may perceive that the
more an entity appears in an article, and the earlier it appears, the more
closely related it is to the main theme of the article. Combining these two
statistics, we rank all entities by a stable sort: first in descending order by
count then in ascending order by offset. Over CnRec 11 entities are found
10on average per article. In addition only a single article returns 0 entities.
The EDL system also returns an entity type for each identified entity, such
as Person (PER), Location (LOC), Organization (ORG), Geopolitical En-
tity (GPE) and Facility (FAC). Some types have many more neighbouring
nodes in the KG than others, such as GPE as shown in Figure 4. Others
such as LOC are frequently mentioned in articles. To insure there is no over
saturation of common entities we can filter out entities. For our experiments
we remove LOC and GPE typed entities. This leaves 7.5 entities on average
per article. We then try filtering the top 5 and 8 entities per article.
Average Neighbors Per Entity Type
5000
4000
Avg Neighbors
3000
2000
1000
0
ORG PER GPE LOC FAC
Entity Type
Figure 4: Average Entities Per Type
5.3 Augmenting Context Words
In this work, we use an off-the-shelf EDL system,Ji and Nothman (2016) that
is not designed to capture all Freebase entities. Moreover, some keywords
in a news article may not be an above-defined entity at all. For example, in
an article about Ebola, a debilitating virus, the word Ebola may be a key
concept to find related articles. Ebola is not a named entity by definition.
To address these issues, we propose to augment some “context words” from
each news article. We use TF-IDF to score words for each article taking the
top scoring N words which exactly match a Freebase node’s title. These N
words are added to the article’s sub-graph. This method insures no articles
have 0 discovered entities. In this paper, we experiment with N = 2 − 4
context words per article.
5.4 Penalty for Disconnected Entities
If there is no path between two entities across a pair of articles setting a
‘penalty‘ value could impact the recommendation quality. In the event the
11penalty value is set too low, too many articles would be recommended. If
it is set to high, not enough articles will be recommended. In this paper we
experiment within a range of penalty values.
6 Weighting Graph Edges
In this work, we propose to weigh each Freebase edge based on social network
influence weighting Hangal et al. (2010), which is named relation weighting
scheme (RWS) hereafter.
6.1 Relation Weighting Scheme
The proposed relation weighting scheme (RWS) is based on social network
influence weighting Hangal et al. (2010). Given a sub-graph G for an article,
assume we have an edge, e, which is connected to two entity nodes, i.e., ni
and nj . For each entity, we may query the KG and obtain all first-order
neighbouring nodes of each to form two neighborhood sets, denoted as Ni
and Nj . To weigh the edge, e, between ni and nj , we first compute the
conditional probability as follows:
|Ni ∩ Nj |
p(nj |ni ) = .
|Ni |
If two nodes share many neighbours in common it is likely that they
are closely related. As we are computing the shortest distance, a lower edge
weight is better. As we are querying a pair of neighboring nodes p(nj |ni ) > 0,
then a weight, wi , is assigned to e as: wi = 1 − p(nj |ni ).
6.2 Other Weighting Schemes
In Schuhmacher and Ponzetto (2014), and E Ali and Lawless (2017) many
metrics for ranking edges in a KG are proposed. In this work, we implement
JointIC and E Ali and Lawless (2017)’s top three metrics to weight edges
for our news recommendation tasks: i) AF: normalized Attribute Frequency
of the attributes over KG, favors common attributes in KG; ii) IAF: inverse
attribute frequency for the attributes over KG, favors rare attributes; iii)
AF-IAF: multiply the previous two features.
127 Experiments
In this section, we evaluate the recommendation performance of the pro-
posed methods. These are evaluated on a newly-created news recommenda-
tion benchmark data set,CNRec, on some typical cold-start settings. The
proposed method is compared with conventional approaches used for cold-
start content-based news recommendation, including TF-IDF and doc-vector.
It is also compared with other graph traversal algorithms in terms of F1 ,
precision, recall, Pearson, and Spearman correlation with human labeled
scores. All experiments with SED use the pruned version of FreeBase in
which we removed nodes with out degree less than 20, symmetric distance,
the top 5 non LOC / GPE entities, leaves, and are weighted unless stated
otherwise.
Table 1: Positive Article Pairs for Evaluation Conditions (%)
GR@.75 GR@.5 DR@.75 DR@.5
.
25 40 8 21
7.1 Evaluation Conditions
The two evaluation questions are highly subjective and the answers varied
on an individual basis. For example, for question 2 only 15% of article
pairs were unanimously considered to be a good recommendation by all six
participants. Therefore, in this work, we will evaluate our recommendation
algorithms under the following four different conditions. In each condition,
the CNRec data set is split into positive and negative samples in a different
way to take the subjectivity issue into account.
1. Good Recommendation at least XX% (GR@.50 and GR@.75): A pair
of articles is considered as a good recommendation if the average rating
score of Question 2 across all participants is 0.XX or above.
2. Diverse Recommendation at least XX% (DR@.50 and DR@.75): A
pair of articles is considered as a good recommendation only if at
least XX% of participants think it is a good recommendation (Yes to
Question 2) and 50% of participants think they are not very similar
(Question 1 rating is 1 or below).
From Table 1 we can see that GR@.50 will produce 40% positive pairs.
For GR@.75 25% of article pairs are positive samples. Using DR@.50 we
13Table 2: Maximal Length Expansion Radius (F1 scores in %). (Penalty
0.98 was used in all tests. No LOC or GPE entities were used.)
Weighted / Hops GR@.75 GR@.5 DR@.75 DR@.5
UnW / 2 64.57 70.23 23.16 38.26
W/2 64.87 71.62 23.79 39.75
UnW / 1 64.45 72.07 23.51 40.37
W/1 65.09 73.54 24.72 42.49
have 21% positive samples. Lastly for DR@.75 we have 8% as positive
samples.
In our experiments each algorithm’s raw recommendation scores are nor-
malized to be zero mean and unit variance. The scores are then judged
against a universal threshold, 0 in this case, to make a binary recommenda-
tion decision. For each of the above conditions, the recommendation results
are compared with the positive/negative labels to calculate precision and
recall. The final recommendation performance is measured by F1 score, i.e.,
F1 = 2 ∗ PPrecision+Recall
recision∗Recall
.
7.2 Analysis on various hyperparameters
In this section, we will study how the choices of some critical hyper-parameters
in the proposed algorithm may affect the recommendation performance.
7.2.1 Optimal Maximal Length Expansion Radius L
From 2 we can see that the one hop weighted subgraphs excel in all cate-
gories. The weighting is much more effective for the 1 hop graphs than the
two hop graphs. We believe this is because our RW checks the immediate
neighbors of two connecting nodes.
7.2.2 Effect of entity screening and context words
As shown in Table 3, after entity pre-screening and removing all entities of
the type of LOC and GPE, we observe large gains across four evaluation
conditions for both unweighted and weighted distance calculation. It is
observed that while common nodes of LOC and GPE types may be useful
in some situations, they contain too many neighboring nodes. This in turn,
leads to many incorrect recommendations due to common entity overlapping.
After removal of LOC and GPE there were 7.5 average nodes per article.
14Table 3: Entity pre-screening and context words performance comparison
(F1 scores in %). (All 1 Hop; W: weighting; NE: Number of Entities where
NLG indicates No LOC or GPE. C: adding # context words; Penalty 0.98
was used in all tests.)
W / NE / C GR@.75 GR@.5 DR@.75 DR@.5
UnW / All (11 Avg) / 0 60.79 67.58 21.37 36.89
UnW / NLG 8 / 0 64.45 72.07 23.51 40.37
UnW / NLG 5 / 0 72.53 78.46 27.81 44.98
UnW / NLG 5 / 2 75.89 83.76 29.41 49.47
UnW / NLG 5 / 4 74.30 84.25 28.64 49.94
W / All / 0 64.45 71.02 23.88 39.57
W / NLG 8 / 0 65.09 73.54 24.72 42.49
W / NLG 5 / 0 72.79 80.02 28.42 46.84
W / NLG 5 / 2 75.91 84.72 29.41 49.76
W / NLG 5 / 4 74.29 84.67 28.82 50.66
Thus we skipped filtering top 10 entities in favor of top 8 and 5. Furthermore,
we can see it is helpful to add a small number of context words for each
article. Based on the results in Table 3, we have decided to add up to 2
context words to each article since this yields the largest gain across various
categories.
7.2.3 Effect of various edge weighting schemas
Here we compare our proposed edge weighting method, RWS, in section 6.1,
with four existing methods, i.e., AF, IAF and AF-IAF, JointIC, with SED.
As shown in Figure 5, we can see that RWS produces much larger gains
across all evaluation conditions over the three existing weighting methods.
We believe this is because RWS weights each node based on the underlying
article while the three traditional methods are purely based on term fre-
quency over the entire knowledge graph. These methods likely impart less
specific information on the active article.
7.2.4 Penalty for Disconnected Nodes
Our experiments from table 4 show by setting a lower penalty value, the
overall accuracy of the algorithm is decreased. We believe this is because
too many unrelated articles are recommended.
15Weighting Method Comparision of F1 Scores
JointIC
80
RW
70 AF-IAF
AF
60 IAF
F1 Score
50
40
30
20
10
0 GoodR_AL75 GoodR_AL50 Div_AL75 Div_AL50
Measure
Figure 5: Edge weighting method comparison via Sym SED, entity
pre-screening, 2 context words.
Table 4: SED Penalty Values: F1 Scores (%)
GR@75 GR@50 DR@75 DR@5
NoP 74.19 81.70 29.35 48.47
P98 75.91 84.72 29.41 49.76
P95 74.24 81.43 29.40 48.01
P90 70.53 77.44 26.03 44.39
All tests use symmetric distance, filtered
entities, 2 context words, and relational
weighting. PXX indicates a penalty of 0.XX
was used.
16Table 5: Recommendation Algorithm Performance.
Conventional Graph Based
Algo TF-IDF Doc2Vec EG KGD SED Avg P98 SED Row P98 SED Sym P98
DR@50 F1 48.66 55.76 48.80 41.01 44.38 48.73 49.76
Precision 63.29 91.43 63.81 58.74 55.59 64.60 67.31
Recall 39.52 40.11 39.50 31.50 36.93 39.12 39.47
DR@75 F1 29.28 27.19 30.31 24.89 26.03 29.25 29.41
Precision 78.20 97.63 81.52 75.36 66.11 80.09 82.70
Recall 18.01 15.80 18.61 14.91 16.20 17.89 17.89
GR@50 F1 85.56 85.89 83.81 73.68 77.43 83.21 84.72
Precision 79.37 95.24 78.06 73.53 69.84 78.29 80.95
Recall 92.79 78.22 90.48 73.84 86.88 88.78 88.88
GR@75 F1 78.42 68.04 77.04 66.82 70.53 75.27 75.91
Precision 91.80 98.98 90.63 85.58 79.72 89.68 92.17
Recall 68.45 51.84 66.99 54.81 63.24 64.85 64.53
Table 6: Recommendation Algorithm Ensembles Performance.
Algo EG Doc EG Doc TF EG TF SED Doc SED Doc TF SED TF TF Doc
DR@50 F1 56.48 55.73 47.93 57.19 56.17 49.03 56.49
Precision 88.99 78.41 61.71 88.29 79.81 63.81 81.03
Recall 41.37 43.23 39.18 42.29 43.33 39.80 43.36
DR@75 F1 28.37 31.48 30.04 29.25 31.47 30.59 30.86
Precision 96.92 93.13 79.15 97.39 94.31 81.75 93.60
Recall 16.62 18.94 18.53 17.21 18.89 18.81 18.48
GR@50 F1 87.42 89.45 85.40 88.39 89.62 86.02 89.49
Precision 93.93 88.05 78.62 93.46 88.89 79.83 89.40
Recall 81.76 90.89 93.45 83.84 90.37 93.24 89.57
GR@75 F1 70.50 77.19 79.42 71.87 76.88 79.44 75.86
Precision 98.76 97.22 92.09 98.76 97.73 93.05 97.29
Recall 54.82 64.00 69.81 56.49 63.36 69.30 62.16
7.3 Computation Time
All graphs created are of expansion radius 1 which provided the best results
for all algorithms. Using our filtered Freebase of 17.5 million nodes graphs
were created in 50 milli-seconds (ms) on average. Weighting took 78.8 ms
average per graph. The English only Freebase of 438 000 million nodes took
512 ms on average to create each graph. As EffGraph (EG) performed better
using the unfiltered English only Freebase, it was used to create it’s graphs.
The average time for the 689 entity graph creation was 35 ms. Computing
the all pairwise shortest distance to all other discovered entities (entities
were skipped if not present in the graph) took 13.2 ms on average, although
a large majority of entity pairs (99.26%) were skipped. The 5400 evaluations
took 29.4 ms on average for SED on the 17.5 million Freebase, 983 ms for
the 438 000 SED graphs, 30.94 for KGD, and 0.00017 for EG. Computations
used a Intel(R) Core(TM) i7-6500U CPU @ 2.50GHz, with 8 GB of RAM.
17Algorithm Pearson Correlation
1 0.81 0.82 0.8 0.81
tf
0.96
0.81 1 0.72 0.68 0.68
doc
0.90
SED_P98
0.82 0.72 1 0.91 0.9 0.84
SED_P95
0.8 0.68 0.91 1 0.96 0.78
EffGraph
0.72
0.81 0.68 0.9 0.96 1
tf doc SED_P98 SED_P95 EffGraph
Figure 6: Pearson correlation of recommendation scores from various
algorithms.
7.4 Baseline Parameters
For experiments utilizing TF-IDF all stop words are removed from the cor-
pus. We then filter out any words in over 80% of articles. The Doc2Vec
model is the distributed memory (PV-DM) model. Past research has shown
that PV-DM outperforms the the distributed bag of words (PV-DBOW)
model when the corpus is small. As our data set is 300 articles this is a
reasonable choice. Our embedding size is set to 300.
As SED computes the distance between two articles TF-IDF and doc2Vec
were converted from similarity to distance measures. Since both similarity
computations were done with cosine similarity they output values between
−1 and 1. To bound the results between 0 and 1 any values that were less
than 0, indicating that the vectors are diametrically opposed, were set to
0. Then to convert from similarity to distance we subtracted the similarity
value from 1.
7.5 Main Results
In Table 5, we show the performance of two baseline recommendation algo-
rithms TF-IDF and Doc2vec, in terms of F1 scores for all four evaluation
conditions. From there, we see that TF-IDF outperforms Doc2vec by a large
margin in GR@.75 and DR@.75 while Doc2vec displays higher accuracies
in the at-least-50% tests.
Next, we have evaluated several configurations of the proposed shortest
entity distance (SED) method for the four evaluation conditions. From the
18results in Table 5, it is clear that the Schuhmacher and Ponzetto (2014)
bipartite matching and all-average distance calculation performs the worst
in all cases. This may be due to the fact that the distance measures from
some critical entities are over-averaged or ignored due to prior matchings by
other less importance entities. The symmetric distance computation yields
the best performance across all categories. We believe this is because the
symmetry prevents one article with many entities from encapsulating the
other.
By itself SED symmetric performs much better than Doc2Vec in GR@.75
and DR@.75 categories. It gives higher results versus EG in both @ 0.5
categories. It also provides better performance in the DR@.75 case over TF-
IDF and Doc2Vec although lower than EffGraph. In the DR@.50 category,
the SED symmetric variant outperforms TF-IDF and EG but is far behind
doc2vec. From these observations, it may be concluded that SED leverages
additional information from both the context and entity nodes to make
more refined diverse recommendations than the baseline algorithms, but
less refined versus EG.
As shown in Figure 6 we can see that the SED correlates less with
Doc2vec and TF-IDF than they do with each other. The results in Ta-
ble 5 show that a consolidation of SED, TF-IDF, and doc2vec provides the
highest performance in GR@.75 producing a gain of 1.02% over the blend-
ing of TF-IDF and doc2vec. A combination of SED and doc2vec provides
the highest overall performance in GR@.5 producing a gain of 0.13% over
the second best of TF-IDF and doc2vec . A synthesis of SED and TF-IDF
provides the highest performance in DR@.75 producing a gain of 0.62% over
the second best of TF-IDF and doc2vec. A combination of SED and doc2vec
give the best performance in DR@.5. This accounts for a gain of 0.70% over
the second best of TF-IDF and doc2vec. Our hypothesis is that the smaller
correlation between SED and the baseline algorithms accounts for the gains
as SED would recommend articles the baseline algorithms would not.
Finally, we evaluate the correlation between the algorithm’s recommen-
dation scores and the average annotation scores of Question 2 among the six
human annotators. In Table 7, we first list the correlation coefficients (both
Pearson and Spearman) of the baseline algorithms: TF-IDF and Doc2vec.
As we can see, the correlation coefficients of SED alone is much lower than
both baseline algorithms. Only 5.3% of distance values returned a 1 when
using SED. While many other values returned close to 1, these values do no
correlate to the human similarity scores that were exactly 1. When using
EG 63.1% of distance values were 1. We believe this is why SED has higher
precision VS EG in all categories and produces a higher Pearson correlation
19Table 7: Correlation coefficients between average human annotation scores
of Question 2 and recommendation scores from various algorithms.
Pearson Spearman
Doc2Vec 78.832 81.155
TF-IDF 87.709 81.469
KGD 70.093 61.413
EG 78.975 78.870
SED 79.273 72.730
TF + Doc 88.310 83.456
SED + TF 88.562 81.899
SED + Doc 84.271 82.642
SED + Doc + IF 88.957 83.852
versus both other traversal algorithms, but lower Spearman VS EG.
8 Conclusions
The proposed shortest entity distance (SED) algorithm performs the best
under almost all examined conditions in the cold-start content-based news
recommendation task when it is configured with maximal length 1 expan-
sion, relation weighting scheme, entity pre-screening, leaf nodes, and up to 2
context words. Moreover, the above SED algorithm yields significant gains
in these tasks when combined with some conventional recommendation al-
gorithms. This has shown that the proposed SED algorithm has effectively
leveraged useful information from knowledge graphs for content-based rec-
ommendation, which is fairly complementary with most existing algorithms.
SED also provides the highest Pearson correlation of graph traversal algo-
rithms.
Lastly, we have created a new data set for content-based news recommen-
dation from this work. We hope that this data set will become a standard
benchmark in the content-based news recommendation field as it provides a
variety of human opinions and a diverse set of answers allowing researchers
to evaluate their algorithms across many metrics.
20References
Sören Auer, Christian Bizer, Georgi Kobilarov, Jens Lehmann, Richard
Cyganiak, and Zachary Ives. 2007. DBpedia: A Nucleus for a Web
of Open Data. In Proceedings of the 6th International The Seman-
tic Web and 2Nd Asian Conference on Asian Semantic Web Confer-
ence (ISWC’07/ASWC’07). Springer-Verlag, Berlin, Heidelberg, 722–735.
http://dl.acm.org/citation.cfm?id=1785162.1785216
Kurt Bollacker, Colin Evans, Praveen Paritosh, Tim Sturge, and Jamie Tay-
lor. 2008. Freebase: A Collaboratively Created Graph Database for Struc-
turing Human Knowledge. In Proceedings of the 2008 ACM SIGMOD
International Conference on Management of Data (SIGMOD ’08). ACM,
New York, NY, USA, 1247–1250. https://doi.org/10.1145/1376616.
1376746
Abhinandan S. Das, Mayur Datar, Ashutosh Garg, and Shyam Rajaram.
2007. Google News Personalization: Scalable Online Collaborative Fil-
tering. In Proceedings of the 16th International Conference on World
Wide Web (WWW ’07). ACM, New York, NY, USA, 271–280. https:
//doi.org/10.1145/1242572.1242610
A Caputo E Ali and S Lawless. 2017. Entity Attribute Ranking Using Learn-
ing to Rank. http://ceur-ws.org/Vol-1883/paper_10.pdf. CEUR
1883 (2017).
Florent Garcin, Christos Dimitrakakis, and Boi Faltings. 2013. Personal-
ized News Recommendation with Context Trees. In Proceedings of the
7th ACM Conference on Recommender Systems (RecSys ’13). ACM,
New York, NY, USA, 105–112. https://doi.org/10.1145/2507157.
2507166
Sudheendra Hangal, Diana L. MacLean, Monica S. Lam, and Jef-
frey Heer. 2010. All Friends are Not Equal: Using Weights in
Social Graphs to Improve Search. http://vis.stanford.edu/files/
2010-WeightsSocialGraphs-SNAKDD.pdf.
B. Heitmann and C. Hayes. 2016. SemStim: Exploiting Knowledge Graphs
for Cross-Domain Recommendation. In 2016 IEEE 16th International
Conference on Data Mining Workshops (ICDMW). 999–1006. https:
//doi.org/10.1109/ICDMW.2016.0145
21Ioana Hulpus, Conor Hayes, Marcel Karnstedt, and Derek Greene. 2013.
Unsupervised Graph-based Topic Labelling Using Dbpedia. In Proceed-
ings of the Sixth ACM International Conference on Web Search and Data
Mining (WSDM ’13). ACM, New York, NY, USA, 465–474. https:
//doi.org/10.1145/2433396.2433454
Heng Ji and Joel Nothman. 2016. Overview of TAC-KBP 2016 Tri-lingual
EDL and Its Impact on End-to-End Cold-Start KBP. In Proceedings
of 2016 Text Analysis Conference (TAC). https://tac.nist.gov/
publications/2016/papers.html
Benjamin Kille, Andreas Lommatzsch, Frank Hopfgartner, Martha Larson,
and Torben Brodt. 2017. CLEF 2017 NewsREEL Overview: Offline and
Online Evaluation of Stream-based News Recommender Systems. http:
//eprints.gla.ac.uk/143586/
Samantha Lam. 2013. Using the Structure of DBpedia for Exploratory
Search. http://chbrown.github.io/kdd-2013-usb/workshops/MDS/
doc/mds2013_submission_2.pdf.
Jey Han Lau and Timothy Baldwin. 2016. An Empirical Evaluation of
doc2vec with Practical Insights into Document Embedding Generation.
CoRR abs/1607.05368 (2016). http://arxiv.org/abs/1607.05368
Quoc V. Le and Tomas Mikolov. 2014. Distributed Representations of Sen-
tences and Documents. CoRR abs/1405.4053 (2014). http://arxiv.
org/abs/1405.4053
JosÃľ Paulo Leal, VÃćnia Rodrigues, and Ricardo QueirÃşs. 2012. Comput-
ing Semantic Relatedness using DBPedia.. In SLATE (OASICS), Alberto
SimÃţes, Ricardo QueirÃşs, and Daniela Carneiro da Cruz (Eds.), Vol. 21.
Schloss Dagstuhl - Leibniz-Zentrum fuer Informatik, 133–147. http:
//dblp.uni-trier.de/db/conf/slate/slate2012.html#LealRQ12
Michael D. Lee and Matthew Welsh. 2005. An empirical evaluation of models
of text document similarity. http://www.socsci.uci.edu/˜mdlee/lee_
pincombe_welsh_document.PDF. In In CogSci2005. Erlbaum, 1254–1259.
Lei Li, Ding-Ding Wang, Shun-Zhi Zhu, and Tao Li. 2011. Personalized
News Recommendation: A Review and an Experimental Investigation. J.
Comput. Sci. Technol. 26, 5 (Sept. 2011), 754–766. https://doi.org/
10.1007/s11390-011-0175-2
22Dan Liu, Wei Lin, Shiliang Zhang, Si Wei, and Hui Jiang. [n. d.]. Neural
Networks Models for Entity Discovery and Linking. In arXiv:1611.03558.
https://arxiv.org/abs/1611.03558
George A. Miller. 1995. WordNet: A Lexical Database for English. Commun.
ACM 38, 11 (Nov. 1995), 39–41. https://doi.org/10.1145/219717.
219748
Mingbin, Feng Wei, Sedtawut Watcharawittayakul, Yuchen Kang, and Hui
Jiang. 2016. The YorkNRM Systems for Trilingual EDL Tasks at TAC
KBP 2016. In Proceedings of 2016 Text Analysis Conference (TAC).
https://tac.nist.gov/publications/2016/papers.html
Bernardo Pereira Nunes, Ricardo Kawase, Besnik Fetahu, Stefan Dietze,
Marco A. Casanova, and Diana Maynard. 2013. Interlinking Documents
based on Semantic Graphs. Procedia Computer Science 22, Supplement
C (2013), 231 – 240. https://doi.org/10.1016/j.procs.2013.09.
099 17th International Conference in Knowledge Based and Intelligent
Information and Engineering Systems - KES2013.
Ozlem Ozgobek, Jon Atle Gulla, and R. Cenk Erdur. 2014. A Survey
on Challenges and Methods in News Recommendation. In Proceedings
of the 10th International Conference on Web Information Systems and
Technologies - Volume 2: WEBIST,. INSTICC, SciTePress, 278–285.
https://doi.org/10.5220/0004844202780285
Guillermo Palma, Maria-Esther Vidal, Eric Haag, Louiqa Raschid, and An-
dreas Thor. 2013. Measuring Relatedness Between Scientific Entities in
Annotation Datasets. https://bit.ly/2HAyeVA.
Alexandre Passant. 2010a. Dbrec: Music Recommendations Using DBpe-
dia. In Proceedings of the 9th International Semantic Web Conference on
The Semantic Web - Volume Part II (ISWC’10). Springer-Verlag, Berlin,
Heidelberg, 209–224. http://dl.acm.org/citation.cfm?id=1940334.
1940349
Alexandre Passant. 2010b. Measuring Semantic Distance on Linking Data
and Using it for Resources Recommendations. https://www.aaai.org/
ocs/index.php/SSS/SSS10/paper/view/1147.
Christian Paul, Achim Rettinger, Aditya Mogadala, Craig A. Knoblock,
and Pedro Szekely. 2016. Efficient Graph-Based Document Similarity. In
Proceedings of the 13th International Conference on The Semantic Web.
23Latest Advances and New Domains - Volume 9678. Springer-Verlag New
York, Inc., New York, NY, USA, 334–349. https://doi.org/10.1007/
978-3-319-34129-3_21
Juan Ramos. 2003. Using TF-IDF to Determine Word Relevance in Docu-
ment Queries. https://bit.ly/2HRlE7J.
A. Sanfeliu and K. S. Fu. 1983. A distance measure between attributed
relational graphs for pattern recognition. IEEE Transactions on Systems,
Man, and Cybernetics SMC-13, 3 (May 1983), 353–362. https://doi.
org/10.1109/TSMC.1983.6313167
Michael Schuhmacher and Simone Paolo Ponzetto. 2014. Knowledge-based
Graph Document Modeling. In Proceedings of the 7th ACM Interna-
tional Conference on Web Search and Data Mining (WSDM ’14). ACM,
New York, NY, USA, 543–552. https://doi.org/10.1145/2556195.
2556250
Chuan Shi, Xiangnan Kong, Yue Huang, Philip S. Yu, and Bin Wu. 2013.
HeteSim: A General Framework for Relevance Measure in Heterogeneous
Networks. CoRR abs/1309.7393 (2013). http://dblp.uni-trier.de/
db/journals/corr/corr1309.html#ShiKHYW13
Yizhou Sun, Jiawei Han, Xifeng Yan, Philip S. Yu, and Tianyi Wu. 2011.
Pathsim: Meta path-based top-k similarity search in heterogeneous infor-
mation networks. https://bit.ly/2Hx6XTM. In In VLDB 11.
Mozhgan Tavakolifard, Jon Atle Gulla, Kevin C. Almeroth, Jon Espen Ing-
valdesn, Gaute Nygreen, and Erik Berg. 2013. Tailored News in the Palm
of Your Hand: A Multi-perspective Transparent Approach to News Rec-
ommendation. In Proceedings of the 22Nd International Conference on
World Wide Web (WWW ’13 Companion). ACM, New York, NY, USA,
305–308. https://doi.org/10.1145/2487788.2487930
Hao Wen, Liping Fang, and Ling Guan. 2012. A Hybrid Approach for
Personalized Recommendation of News on the Web. Expert Syst. Appl. 39,
5 (April 2012), 5806–5814. https://doi.org/10.1016/j.eswa.2011.
11.087
Mingbin Xu, Hui Jiang, and Sedtawut Watcharawittayakul. 2017. A Lo-
cal Detection Approach for Named Entity Recognition and Mention
24Detection. In Proceedings of the 55th Annual Meeting of the Associ-
ation for Computational Linguistics (Volume 1: Long Papers). Asso-
ciation for Computational Linguistics, Vancouver, Canada, 1237–1247.
http://aclweb.org/anthology/P17-1114
Linda Yang and K. Yeung. 2010. A proactive personalized mobile news
recommendation system.
G. Zhu and C. A. Iglesias. 2017. Computing Semantic Similarity of Con-
cepts in Knowledge Graphs. IEEE Transactions on Knowledge and Data
Engineering 29, 1 (Jan 2017), 72–85. https://doi.org/10.1109/TKDE.
2016.2610428
This work was partially supported by the Natural Sciences and Engi-
neering Research Council of Canada, under a USRA grant No. 511876.
25You can also read