The impact of using different wood qualities and wood species on chips produced using a novel type of pilot drum chipper
←
→
Page content transcription
If your browser does not render page correctly, please read the page content below
Nordic Pulp & Paper Research Journal 2021; 36(2): 214–226

Chemical pulping

Jessica Gard Timmerfors*, Hamid Salehi, Sylvia H. Larsson, Torbjörn Sjölund and
Leif J. Jönsson

The impact of using different wood qualities and
wood species on chips produced using a novel
type of pilot drum chipper
https://doi.org/10.1515/npprj-2019-0096                                  Keywords: drum chipper; frozen wood; moisture content;
Received November 20, 2020; accepted February 14, 2021; previously       tree species; wood chips.
published online March 3, 2021

Abstract: Resource-efficient wood chipping for forest-
industrial processes demands large fractions of accept                   Introduction
chips and small fractions of small-sized material, such as
pin chips and fines. In Kraft pulping, a narrow distribution             Most forest-industrial processes, i. e. processes in the pulp
of wood chip thickness is important for even impregnation                and paper industry and in wood-based biorefineries, are
and for making high-quality pulp. Using newly developed                  based on wood chips. The objective of wood chipping is
forest-industrial drum-chipping technology, the investiga-               to produce a high yield of wood chips that have a suit-
tion covered wood of varying moisture content, frozen ver-               able quality for processing using digesters and refiners,
sus unfrozen wood, and the use of different wood species.                regardless of season, weather conditions, and variations
Using conventional techniques for analyzing wood chip                    in feedstock composition. Although wood chip quality is
dimensions, fast-grown spruce wood with high moisture                    of utmost importance both for the pulp yield in chemical
content gave 4.2 % pin chips and fines, which was less                   pulping and for subsequent process steps, very little re-
than half of the fractions obtained with spruce wood with                search is devoted to investigations of new forest-industrial
lower moisture content. A comparison between frozen                      wood chipping technology and factors that influence wood
and unfrozen pine resulted in slightly thinner and shorter               chip quality. A common definition of high wood chip qual-
chips for the frozen wood, but in both cases accept yields               ity is that the chips consist of a low fraction of overthick
of up to ∼85 % were achieved. A comparison of different                  chips, pin chips, and fines, and that they are uniform with
tree species (aspen, birch, pine, and spruce) resulted in                regard to bulk density and moisture content (Hartler and
                                                                         Stade 1977, Uhmeier 1995, Hartler 1996). Uniformity with
larger accept fractions (∼90 %) for the hardwood species,
                                                                         respect to length and thickness is also important. The def-
even though the average length of these wood chips was
                                                                         initions of length, thickness, and width of a wood chip
as low as 17 mm. The results provide a first indication of
                                                                         are indicated in Figure 1. High wood chip quality results
how basic wood log properties affect the yields of accept
                                                                         in pulp with high and uniform quality, whereas low wood
chips and small-sized material when using modern indus-
                                                                         chip quality results in low-quality pulp, or even costly
trial drum-chipping technology.
                                                                         operation disturbances (Hartler and Stade 1977, Hartler
                                                                         1996). More specifically, a high fraction of wood chips
*Corresponding author: Jessica Gard Timmerfors, Department of            of too small dimensions results in poor yields and pulp
Chemistry, Umeå University, SE-901 87 Umeå, Sweden, e-mail:
                                                                         of lower strength (Hartler 1996). A high fraction of over-
jessica.gard.timmerfors@more.se, ORCID:
https://orcid.org/0000-0001-6105-5169
                                                                         thick chips increases the fraction of reject (shives) (Hartler
Hamid Salehi, Sylvia H. Larsson, Department of Forest Biomaterials       1996), as the thickness affects impregnation in Kraft pulp-
and Technology, Swedish University of Agricultural Sciences, SE-901      ing and poor impregnation results in uncooked pieces of
83 Umeå, Sweden, e-mails: H.SalehiKahrizsangi@greenwich.ac.uk,           wood.
sylvia.larsson@slu.se
                                                                              Wood chippers in the pulp and paper industry of to-
Torbjörn Sjölund, MoRe Research i Örnsköldsvik AB, Box 70, SE-891
22 Örnsköldsvik, Sweden, e-mail: torbjorn.sjolund@more.se
                                                                         day are typically disc chippers (Brännvall 2009). How-
Leif J. Jönsson, Department of Chemistry, Umeå University, SE-901        ever, an inherent problem with disc chippers is that
87 Umeå, Sweden, e-mail: leif.jonsson@umu.se                             they have an uneven velocity across the disc, as the

  Open Access. © 2021 Gard Timmerfors et al., published by De Gruyter.       This work is licensed under the Creative Commons Attribution 4.0
International License.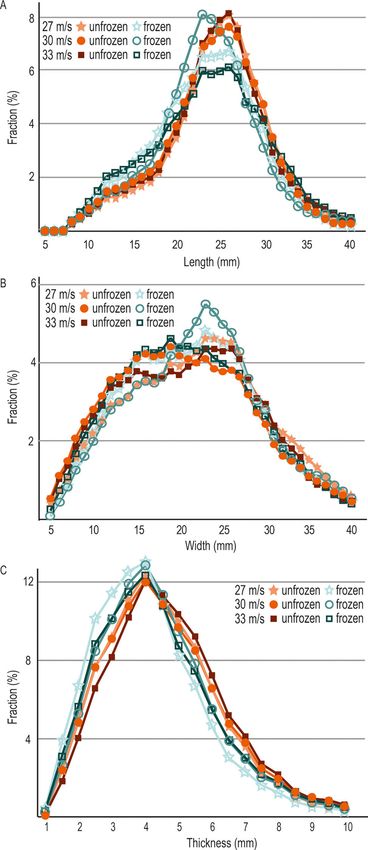
J. Gard Timmerfors et al.: Impact of wood qualities on industrial drum chipping   | 215

                                                                       would be more important at higher temperatures (Hartler
                                                                       and Stade 1977, Hartler 1996, Hernández et al. 2014). In-
                                                                       dustrial experience indicates that frozen wood will give
                                                                       rise to thinner wood chips and increased fractions of
                                                                       pin and fines, and that this increase of pin chips and
                                                                       fines will be higher at higher disc velocities (Brännvall
                                                                       2009).
Figure 1: Schematical image of wood chip indicating the orientation         Another factor that will affect the wood chip quality
of fibers in relation to length, width, and thickness.                 is the variation among the wood species that are used
                                                                       as feedstock for pulping operations. Wood density and
                                                                       mechanical behavior can vary between species, between
                                                                       trees of the same species, and within the same tree. There
velocity is lower at the center than at the periphery.
                                                                       are some previous studies of the impact of tree species
Using a novel drum-chipping technology described in
                                                                       and ring orientation on wood chip quality (Twaddle 1997),
previous papers, promising results have been achieved
                                                                       such as the thickness of the wood chips (Figure 1) and ef-
with regard to wood chips for both Kraft pulping (Gard
                                                                       fects of the angle between annual rings and cutting knife
Timmerfors et al. 2020) and sulfite pulping (Gard Tim-
                                                                       for loblolly pine, southern red oak, shagbark hickory, and
merfors and Jönsson 2019). Drum chippers have a uni-
                                                                       sweetgum. Chipping in a laboratory test bed indicated that
form velocity across the drum and can therefore gener-
                                                                       the thickness, which increased with wood chip length (Fig-
ate more uniform wood chips with relatively low frac-
                                                                       ure 1), was dependent on the tree species. The variation
tions of pin chips and fines (Gard Timmerfors et al.
                                                                       of the angle between annual rings and knife was most
2020).
                                                                       important for wood of southern red oak. An angle be-
     When wood chippers are operated in the forest indus-
                                                                       tween annual rings and knife edge of 0° resulted in thicker
try, the feedstock will often exhibit large variations with
                                                                       wood chips than an angle of 90°. Thus, there was a vari-
regard to moisture content and temperature. The mois-                  ation between species but also within a single species,
ture content of the wood logs will depend on growth con-               depending on the microstructure of the wood (Twaddle
ditions, logging period, and the handling of the wood                  1997). The importance of the inherent mechanical vari-
logs before they reach the industry (Hart 2009). Even                  ation in the wood material itself was also observed in
if the time between harvest and transport to industry                  a study of Norway spruce log cracking (Hellström et al.
is minimized, temporary weather phenomena, for exam-                   2008).
ple drought, will affect the moisture content of logs and                   The aim of this study was to investigate how wood
wood chips (Marrs 1989, Hart 2009, Sfeir et al. 2021). Wood            quality, such as moisture content and freezing state, and
with a dry-matter content over 70 % will give increased                wood species affect the quality of wood chips produced
amounts of pin chips and fines (Brännvall 2009). Further-              using the novel industrial drum-chipping technology. Al-
more, there is a difference between wood harvested and                 though chipping is an important area for the pulp and pa-
handled during winter and summer seasons. In Nordic                    per industry, forest-industrial chipping is covered by rel-
regions, the wood will typically be frozen during chip-                atively few studies. There are some basic comparisons be-
ping in the winter, but unfrozen during the summer sea-                tween the new drum-chipper technology and conventional
son. During winter, the interior of a log might still be               disc-chipper technology in the literature (Gard Timmerfors
frozen even if the outer part thawed during handling. Al-              et al. 2020), but this is the first study addressing the effects
though the effects of temperature variations on wood chip-             of wood quality on chips produced using the new drum-
ping to a large extent remain to be elucidated, earlier                chipper technology.
studies on disc chipping of softwood have indicated that                    The focus area of this work is forest-industrial wood
low temperatures make the wood more brittle (Hernández                 chipping for the pulp and paper industry. This is differ-
et al. 2014). That would make the influence of high cut-               ent compared to chipping or particle size reduction for the
ting speeds (such as at the periphery at the disc) more                bioenergy sector, where there are several recent studies re-
pronounced, resulting in more small-sized material, pin                garding the properties of the raw material (Abdallah et al.
chips and fines, and less large-sized material. Studies of             2011, Spinelli et al. 2011, Spinelli and Magagnotti 2012).
disc chippers and mechanical testing furthermore show                  There are differences with regard to chipping techniques,
that whereas the moisture content would be most impor-                 standards, and definitions (Abdallah et al. 2011). For ex-
tant at sub-zero temperatures (< 0 °C), the basic density              ample, the moisture content is critical for the impregna-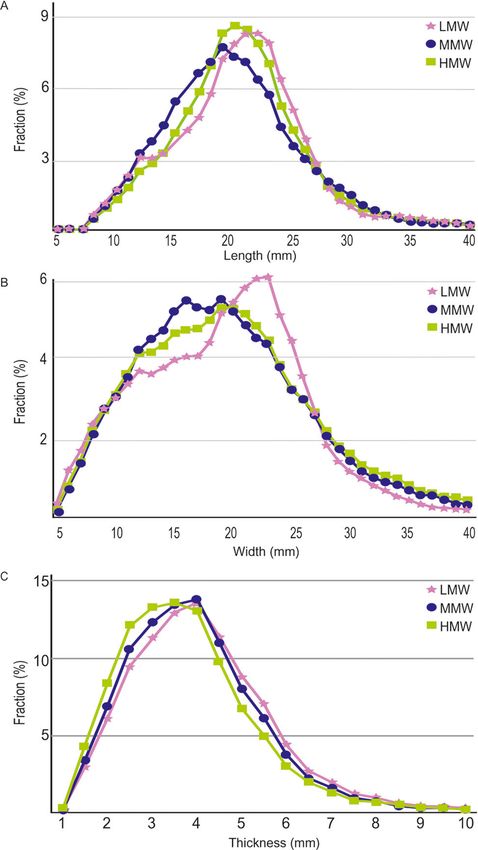
216 | J. Gard Timmerfors et al.: Impact of wood qualities on industrial drum chipping

tion process in chemical pulping, and too low moisture             Materials and methods
content will cause problems (Hartler and Stade 1977). In
contrast, dry wood chips (or particles) are advantageous           Wood logs
in the bioenergy sector, as less water needs to be vapor-
ized during combustion. Yet another type of chipping oc-           The study consisted of three sets of experiments, per-
curs at sawmills, where chipper-canters are used to con-           formed under different time periods and using different
vert residual portions of wood logs to wood chips (Cáceres         sets of wood logs. The three experimental series were fo-
                                                                   cused on moisture content, frozen wood, and different
et al. 2015, Pfeiffer et al. 2015, Curti et al. 2018). Such wood
                                                                   wood species, respectively.
chips are typically used in the pulp and paper industry, but
                                                                        In the first experimental series, debarked and un-
the chipping process is different and affects only the outer
                                                                   frozen wood logs of Norway spruce (Picea abies) were
portions of the wood logs rather than whole wood logs as
                                                                   used. The diameter of the logs were in the range 10–14 cm.
in forest-industrial wood chipping with disc chippers and
                                                                   There were six logs in total. Each log originated from a
drum chippers.
                                                                   separate tree. There were two logs from fast-growing trees
     Three series of experiments were conducted address-
                                                                   from wet conditions and growing in the outer part of the
ing moisture content, frozen vs. unfrozen wood, and differ-
                                                                   forest with plenty of nutrition and sunlight resulting in
ent wood species. With regard to different wood species,
                                                                   wood with a high moisture content (HMW, high moisture
four wood species commonly occurring in Nordic forests             wood). There were two logs from dryer conditions and
were investigated: Norway spruce, Scots pine, downy                growing inside the forest resulting in wood that was a lit-
birch, and Eurasian aspen. Forest land covers 69 % of Swe-         tle dryer than an average wood log used in industry. This
den, an area corresponding to 23.5 million ha (Skogsdata           wood was referred to as MMW (medium moisture wood).
2018). The standing volume consists mainly of Norway               Finally, there were two logs from very dry trees growing
spruce (40.8 %), Scots pine (39.0 %), and birch (12.4 %)           inside the forest and selected for visually appearing as
(Skogsdata 2018). Among broad-leaved trees, aspen (1.6 %)          dry (LMW, low moisture wood). Felling and debarking was
is second after birch (together with alder) (Skogsdata             made manually.
2018). Thus, the selection of wood species represents the               Studies of the difference between frozen and unfrozen
two most common types of softwood (spruce and pine) and            wood were performed using debarked wood logs of Scots
the two of the most common types of hardwood (birch and            pine (Pinus sylvestris). The diameter of the logs were in the
aspen).                                                            range 10–15 cm. Five logs were used, and each log origi-
     The wood chips were produced using a pilot drum               nated from a separate tree. Each log was separated into
chipper described in a previous paper (Gard Timmerfors             two halves. One half was chipped in its unfrozen state and
and Jönsson 2019). The evaluation of the wood chips was            the second half was put into a plastic cover and before
performed using SCAN-CM, a series of manual industrial             chipping it was kept outdoors for seven days in tempera-
standard methods (Scandinavian Pulp, Paper and Board               tures ranging between −3 °C and −15 °C. When it was possi-
Testing Committee’s series of test methods for chemi-              ble to distinguish top and bottom parts of wood logs, they
cal and mechanical pulps and wood chips), and using a              were evenly distributed among the frozen and unfrozen as-
ScanChip analyzer. The SCAN-CM standard methods have               sortments to avoid any bias.
been widely used in industry. The ScanChip analyzer is                  Studies of the difference between tree species were
an optical system for rapid analysis of wood chips, and            conducted using a third set of logs. The tree species were
                                                                   Eurasian aspen (Populus tremula), downy birch (Betula
advantages include larger sample size and automation.
                                                                   pubescens), Scots pine, and Norway spruce. There were at
The wood with different moisture content was also ana-
                                                                   least 12 logs of each species. The logs were debarked man-
lyzed with regard to its chemical composition and perfor-
                                                                   ually and chipped while frozen.
mance in a standard Kraft cook, to detect potential dam-
age caused by wood rot, which would make the compar-
ison difficult. Analysis of the chemical composition could
                                                                   Wood chipping
reveal if there were other fundamental differences than the
moisture content. Investigations in this area will provide         The wood logs were chipped using a pilot-scale drum chip-
a better understanding of the impact of wood quality and           per of novel design, constructed by Multi Channel Swe-
wood species in the production of chips for pulping and            den AB (Bredbyn, Sweden). The drum of the pilot chipper
biorefinery processes.                                             had a diameter of 3 m, a width of 20 cm, and was equipped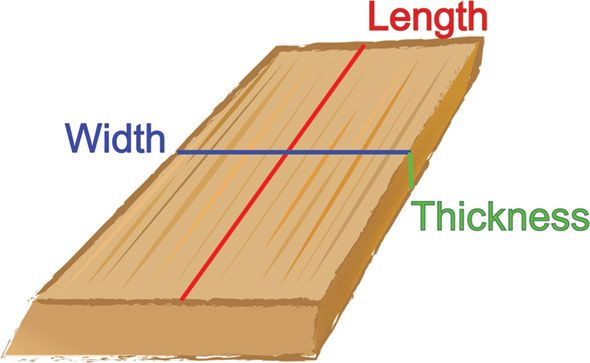
J. Gard Timmerfors et al.: Impact of wood qualities on industrial drum chipping   | 217

with 16 knives. For all three sets of experiments, the knife       SCAN-CM 46:92 (bulk density), SCAN-CM 47:92 (thickness
angles (α = 2.2°, ε’ = 30°) were adjusted to be suitable           and thickness distribution), and SCAN-CM 40:01 (size dis-
for production of wood chips of an average thickness of            tribution). For each assortment, the analyses were re-
around 4 mm. Definitions of knife angles and T dimension           peated 3–4 times. In addition, some of the samples were
of the chipping process, and studies of the relationship be-       analyzed using a ScanChip image analysis system (Pulp-
tween chip size and knife angles have been previously re-          Eye, Örnsköldsvik, Sweden, and Iggesund Tools, Igge-
ported (Gard Timmerfors and Jönsson 2019, Gard Timmer-             sund, now ANDRITZ) located in the Metsä Board Husum
fors et al. 2020) and the feeding system has been described        mill (Husum, Sweden). The ScanChip analyzer provides
(Gard Timmerfors and Jönsson 2019). The logs are placed            average values and distribution of length, thickness, and
manually on the in-feed system and are fed into the chip-          width (Figure 1), for 30–50 % of the wood fragments (wood
per at approx. 0.9 m/s (400–450 rpm). The system is de-            chips and particles) in a sample. The samples were in-
signed so that the velocity is a little lower than the velocity    serted manually into the ScanChip analyzer. The ScanChip
of the wood logs pulled in by the chipper, as the feeding          analyzer automatically measures the dimensions of wood
system should not pull or push the wood log.                       chips and particles, and calculates the mass fractions ac-
     For the first and the second series of experiments, the       cording to the SCAN standard system (oversized, over-
logs where chipped separately and all wood chips were              thick, large accept, small accept, pin chips, and fines as
collected. For all three series, the fractions were mixed          defined in Table 1).
and downsized according to SCAN-CM 41:94 (sampling)
method prior to conducting tests that required a small
sample size (bulk density, thickness distribution, size dis-       Carbohydrate analysis
tribution, and moisture content).
     In the first series of experiments, the drum velocity         Accept chips (large and small accept, as defined in Ta-
was 30 m s−1 . The T dimension was adjusted for a setting          ble 1) sorted out using the SCAN-CM 40:01 (size distribu-
length of 23 mm (SL23) (T = 12 mm).                                tion) method from the three wood chip fractions HMW,
     In the second series of experiments, half wood logs           MMW, and LMW were dried in a ventilated oven for at least
were chipped at different velocities. For each velocity,           24 h at around 40 °C. The drying continued until the mass
one half of each log was chipped in frozen state and the           was constant to assure that the chips were completely dry.
other half in unfrozen state. The velocities were 27 m s−1 ,       The chips were then milled using a Wiley mill. The carbo-
30 m s−1 , and 33 m s−1 . The T dimension was adjusted for a       hydrate content of the powdered wood samples was de-
setting length of 26 mm (SL26) (T = 14 mm).                        termined by MoRe Research (Örnsköldsvik, Sweden) using
     In the third series of experiments, wood logs of each         the SCAN-CM 71:09 procedure.
tree species were chipped under winter conditions and us-
ing two different setting lengths. The drum velocity was
30 m s−1 and the T dimension was adjusted for setting              Kraft cooking and pulp analysis
lengths of 23 mm (SL23) (T = 12 mm) and 19 mm (SL19)
                                                                   Standard Kraft cooking of the three wood chip assortments
(T = 10 mm). During chipping, a sample amounting to 40–
                                                                   with different moisture contents was made in the pilot
80 L was collected for characterization (wood chip dimen-
                                                                   digester facility of MoRe Research. Each assortment was
sions, bulk density, and moisture content). The wood chips
were collected by holding a 125 L polyethene bag after the         treated and analyzed according to a standard Kraft batch
5 m long scraper conveyor of the pilot chipper, in a simi-         cooking procedure developed by MoRe Research using the
lar manner as described in the SCAN-CM 41:94 method in             following procedure: A sample of 2 kg (dry weight) of wood
which a bucket is used for the collection procedure. The           chips was divided into two 1 kg (dry weight) fractions. Each
sample was taken when the third wood log reached the               fraction was inserted into a basket, and put into a pilot re-
chipper to get a mixture of wood chips from the second and         actor together with cooking liquid. The liquid-to-wood ra-
the third, and sometimes the fourth wood log.                      tio was 3.8 L cooking liquor per kg dry weight wood chips.
                                                                   The effective alkali charge was 22 %. The pilot digester was
                                                                   heated, and then the following temperature profile was
Characterization of wood chips                                     used: 40 min heating 122–132 °C, 5 min heating 132–156 °C,
                                                                   70 min 156–158 °C, and 125 min 158–160 °C. The reactor was
Manual analyses of wood chips were performed using the             cooled down and the pulp was washed using deionized
standard methods SCAN-CM 39:94 (dry-matter content),               water. For calculation of the pulp yield by weighing, one
218 | J. Gard Timmerfors et al.: Impact of wood qualities on industrial drum chipping
Table 1: Data for Norway spruce wood chips produced using unfrozen wood logs with different moisture content (SL23, velocity 30 m s−1 ).a
Parameter/fraction Def.b LMW MMW HMW
c
SCAN standard
Dry matter (%) 78.7 ± 0.9*** 61.3 ± 3.3 41.9 ± 3.5***
Bulk density (kg m−3 ) 111 ± 7*** 128 ± 6 128 ± 19
Thickness (mm) 5.4 ± 0.4** 4.9 ± 0.2 5.7 ± 0.1***
Oversized (%) > Ø45 0.3 ± 0.5 0.8 ± 0.6 2.7 ± 0.4***
Overthick (%) > //8 10.7 ± 2.3 9.0 ± 1.6 13.7 ± 1.1***
Large accept (%) > Ø13 60.5 ± 8.3 59.9 ± 3.5 65.1 ± 2.0***
Small accept (%) > Ø7 19.8 ± 4.6 17.0 ± 2.9 14.3 ± 0.6**
Pin chips (%) > Ø3 7.5 ± 3.7 10.5 ± 1.3 3.5 ± 0.5***
Fines (%) < Ø3 1.1 ± 0.9** 2.8 ± 0.9 0.7 ± 0.2**
Total acceptd (%) 80.4 ± 3.9 76.9 ± 1.4 79.4 ± 1.6
ScanChip analyzere
Length (mm) 21.1 21.1 20.6
Width (mm) 19.9 20.3 20.0
Thickness (mm) 4.4 4.0 4.2
Oversized (%) > Ø45 < 0.1 0.2 0.4
Overthick (%) > //8 10.4 7.9 10.4
Large accept (%) > Ø13 60.3 61.8 61.8
Small accept (%) > Ø7 21.9 22.9 20.9
Pin chips (%) > Ø3 9.1 6.7 5.7
Fines (%) < Ø3 1.2 0.6 0.8
Total acceptd (%) 82.2 84.7 82.7
Carbohydrate compositionf
Arabinan (mg g−1 ) 11 11 12
Galactan (mg g−1 ) 11 16 20
Glucan (mg g−1 ) 412 442 423
Xylan (mg g−1 ) 51 53 54
Mannan (mg g−1 ) 111 100 108
Kraft cooking resultsg
Yield (g g−1 ) 46.3 47.8 47.3
Reject (%) 0.31 0.45 0.47
Viscosity (ml g−1 ) 1060 1110 1090
Kappa number 24.1 24.2 24.7
ISO brightness (%) 36.3 34.3 36.4
Fibre length (mm) 2.02 2.23 1.83
a
LMW, low moisture wood; MMW, medium moisture wood; HMW, high moisture wood. Average values and standard deviations for size fraction
distribution calculated using SCAN-CM 40:01 or using automated chip analyzer.
b
Definition: Ø, screen hole diameter in mm; //, screen slot distance in mm.
c
Significant differences (t-test) compared to MMW wood chips are indicated: *** p ≤ 0.01; ** 0.01 < p ≤ 0.05; * 0.05 < p ≤ 0.1. Calculation of
average values and standard deviations: dryness, SCAN 39:94; bulk density, SCAN-CM 46:92; thickness distribution, SCAN-CM 47:92.
d
Sum of large and small accept chips.
e
Average values for length, thickness, and width calculated using automated chip analyzer.
f
Values for carbohydrate composition according to SCAN-CM 71:09 (equivalent to anhydrous sugar).
g
Values for pulp quality using ISO 302:2004, ISO 5351:2010, ISO 2470-1:2016, ISO 16065-2:2007.
of the fractions was dried in an oven at 105 °C for at least tion was determined by weighing the dried residue from
16 h or until the mass was constant. The other fraction the screener and dividing this amount with the calculated
was added to 60 L of water in a tank equipped with a stir- dry-weight of the wood chips used for the analysis. The
rer, and the material was defibrated by mixing for 3 min rest of the material, the pulp, was centrifuged to a dry
at a speed of 1440 turns min−1 . The material was passed content of 25 %, disintegrated with a mechanical homog-
through a laboratory screener with 0.15 mm screen slots enizer, and sampled. The sample was dried in an oven at
(Lorentzen & Wettre, Stockholm, Sweden). The reject frac- 40 °C for 18–24 h and analyzed according to ISO 5251 (vis-J. Gard Timmerfors et al.: Impact of wood qualities on industrial drum chipping | 219
cosity), ISO 302 (Kappa number), ISO 2470 (brightness), that there was no significant difference between the assort-
and ISO 16065-2 (fiber length). ments with regard to total accept, which was in the range
77–80 % (Table 1).
With regard to the small-sized fractions, pin chips and
Results and discussion fines, HMW consistently showed the lowest values (Ta-
ble 1). For fines, the value for LMW was significantly lower
(p ≤ 0.05) than that for MMW. The combined fraction of
Industrial wood chipping typically imply the handling of
pin chips and fines was 8.6 % for LMW, 13.3 % for MMW,
wood logs with different moisture content under differ-
and 4.2 % for HMW. These values can be compared with
ent temperatures, and often involves a mixture of wood
the estimated acceptable range for pin chips and fines in
species. Earlier studies of the effects of temperature and
digesters after screening, which is 8–11 % (Hartler 1996).
wood species on wood chip quality have been made us-
The relatively high fraction of pin chips and fines observed
ing traditional disc chippers or specially designed labora-
for LMW agrees with the observation that wood with a dry-
tory set-ups (Hernández et al. 2014, Twaddle 1997). In this
matter content over 70 % gives increased fraction of pin
study, we evaluated the effects of basic feedstock varia-
chips and fines (Brännvall 2009).
tions on wood chip quality when using a newly developed
In summary, the SCAN size-fraction analysis showed
drum-chipping technology.
that for large-sized fractions, such as oversized, overthick,
and large accept, HMW always exhibited the highest val-
ues. In agreement with this, HMW always exhibited lower
Effects of growth conditions and moisture
values than the others for small-sized fractions, such as
content
small accept, pin chips, and fines. In all but two cases, dif-
In the first series of experiments, chipping behavior for ferences between LMW and MMW were not statistically sig-
trees grown under different conditions – resulting in wood nificant even at p ≤ 0.1 (Table 1).
with different moisture content, was evaluated for the set- The average values for length, width, and thickness,
tings SL25 and drum velocity 30 m s−1 . The wood logs could as determined using the ScanChip analyzer, are shown
be divided into three categories depending on the mois- in Table 1, whereas the size distribution behind the av-
ture content (Table 1). The dry-matter contents of the wood erage values is shown in Figure 2. Although the average
chips were, approximately, 80 % for LMW, 60 % for MMW, length was similar (Table 1) and most of the wood chips
and 40 % for HMW. The differences were statistically sig- had a length in the range 17–25 mm (Figure 2A), the dis-
nificant (p ≤ 0.01). tribution curves indicated differences as the peaks were
Moisture content was expected to affect the bulk den- not superimposed (Figure 2A). With decreasing chip mois-
sity. The bulk density of LMW wood chips was around ture content, the peak of the distribution curve shifted
110 kg m−3 , which was significantly (p ≤ 0.01) lower than slightly towards greater length (Figure 2A). The average
the value for MMW (Table 1). The average wood chip thick- width and distribution curves for width were similar for
ness, as determined by using the SCAN method, varied be- all assortments (Table 1, Figure 2A), although the peak
tween 4.85 and 5.70 mm, but the differences did not follow for LMW shifted somewhat towards greater width (23–
any particular trend with regard to dry-matter content (Ta- 24 mm). The range of the average thickness determined
ble 1). using the ScanChip analyzer, 4.0–4.4 mm, was somewhat
The fraction of oversized wood chips increased with lower than the range determined using the SCAN method
increasing moisture content, and the value for HMW, (Table 1). Similar results have been obtained in previous
2.7 %, was significantly (p ≤ 0.01) higher than the val- studies in which both the SCAN method and ScanChip an-
ues for LMW and MMW (Table 1). The overthick fraction alyzer have been used (Gard Timmerfors and Jönsson 2019,
was in the range 9–14 %, with HMW exhibiting a signifi- Gard Timmerfors et al. 2020). The reason for that is that in
cantly higher value. This agrees with the values for average the SCAN method the thickest part of the chips determines
thickness, where HMW also exhibited the highest value how the chip is sorted, whereas the ScanChip analyzer de-
and MMW the lowest. HMW showed a significantly (p ≤ termines the average thickness and disregards chips with
0.01) higher value for large accept, ∼65 %, whereas LMW too big variation. For both methods, the average thick-
and MMW both had values around 60 %. Conversely, the ness was smallest for MMW. These chips had smaller aver-
fraction of small accept increased with decreasing mois- age thickness, larger fractions in the range 1–3.5 mm, and
ture content (Table 1). The combined effect of this was smaller fractions that were thicker than 4 mm (Figure 2B).220 | J. Gard Timmerfors et al.: Impact of wood qualities on industrial drum chipping
of high moisture content assortments produces less small-
sized material.
The carbohydrate composition was analyzed to check
for potential differences caused by different growth condi-
tions, different genetic background, and attacks by wood-
degrading fungi, as differences in the contents of major
constituents, such as carbohydrate and lignin, could po-
tentially affect chipping and cooking results. The fractions
of some hemicellulosic constituents, viz. galactan and xy-
lan, were higher in wood with higher moisture content (Ta-
ble 1). The glucan content, which probably reflects the cel-
lulose content, was highest for MMW, followed by HMW,
and LMW. The combined fraction of carbohydrate was
slightly larger for MMW, which contained 62.2 % carbohy-
drate compared to 59.6 % for LMW and 61.6 % for HMW.
MMW also had a slightly higher fraction of glucan than
LMW and HMW. This could possibly indicate that MMW
had slightly higher levels of cellulose, something that po-
tentially could affect yield and viscosity during Kraft pulp-
ing.
The pulp yield varied slightly between 46.3–47.8 %
(Table 1). The viscosity and the kappa number were sim-
ilar. For MMW, the ISO brightness was slightly lower than
for LMW and HMW, whereas the fiber length was longer.
It remains a possibility that other differences than the
moisture content affect the results of the study presented
in Table 1 and Figure 2. For example, wood from trees with
a higher age might be associated with longer fiber length,
lower brightness, and higher pulp yields. Future studies
are needed to resolve how differences in age affect wood
chip quality and subsequent Kraft pulping when using the
new drum- chipping technology.
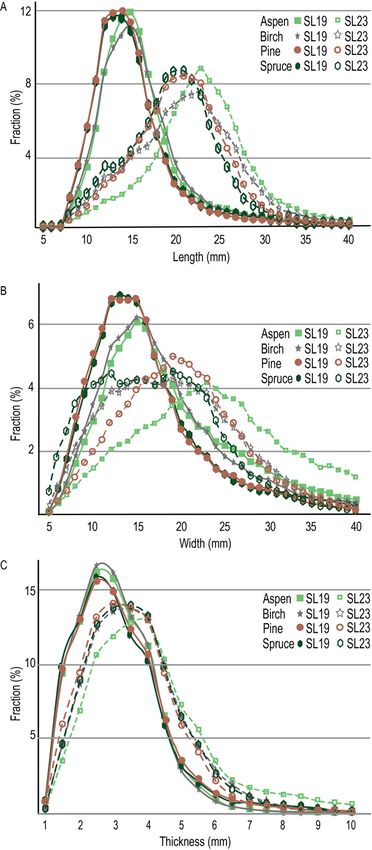
Figure 2: Analysis of size distribution of wood chips with different
moisture content using the ScanChip analyzer. The figure shows the
fractions of wood chips as a function of (A) length, (B) width, and Effects of chipping frozen wood at sub-zero
(C) thickness: LMW, solid pink line, filled star ( ); MMW, length
and thickness, solid blue line, filled circles ( ); HMW, length and
temperatures
thickness, solid green line, filled squares ( ).
In the second series of experiments, the settings SL26
and the drum velocities 27, 30, and 33 m s−1 were used to
investigate the effect of wood being frozen or unfrozen
when chipping. Between these assortments, there were
Compared to the SCAN method, size-fraction deter- only small differences in dry-matter content (46–56 %) and
mination using the ScanChip method typically gave more average thickness (5.1–5.5 mm), as determined using SCAN
similar values. A reason for that could be that the ScanChip standard methods (Table 2).
analysis covered the whole sample, whereas the SCAN According to the SCAN standard method, the fractions
method was restricted to a 10-L sample size even if it was of oversized wood chips were ≤1.3 %. There were no sig-
repeated four times for each assortment. Nevertheless, the nificant differences between fractions of oversized wood
ScanChip analyzer indicated a trend for the combined frac- chips from frozen and unfrozen logs when chipped at the
tion of pin chips and fines, which was 10.3 % for LMW, same velocity (Table 2). The fractions of overthick chips
7.3 % for MMW, and 6.5 % for HMW. Thus, both the SCAN were in the range 6.9–11.2 %. In most cases, there were
method and the ScanChip analyzer indicate that chipping no significant differences between unfrozen and frozenJ. Gard Timmerfors et al.: Impact of wood qualities on industrial drum chipping | 221
Table 2: Data for wood chips produced using frozen and unfrozen wood logs of Scots pine and settings SL26.a
Parameter/fraction Def.b 27 m s−1 30 m s−1 33 m s−1
Unfrozen Frozen Unfrozen Frozen Unfrozen Frozen
c
SCAN standard
Dry matterd (%) 46 ± 1 56 ± 3 52 ± 1
Thicknessd (mm) 5.2 ± 0.1 5.1 ± 0.1 5.1 ± 0.1 5.5 ± 0.1*** 5.2 ± 0.3 5.2 ± 0.3
Oversized (%) > Ø45 0.4 ± 0.1 0.9 ± 1.2 1.3 ± 1.3 NDf 0.5 ± 0.3 0.5 ± 0.7
Overthick (%) > //8 8.6 ± 1.8 9.2 ± 1.4 11.2 ± 0.8 10.5 ± 1.3 6.9 ± 1.8 10.0 ± 1.5*
Large accept (%) > Ø13 71.2 ± 3.4 72.4 ± 0.5 60.5 ± 3.0 72.9 ± 1.3*** 63.7 ± 7.8 64.5 ± 0.8
Small accept (%) > Ø7 14.3 ± 2.0 12.0 ± 0.3 16.0 ± 1.0 11.4 ± 0.2*** 17.6 ± 2.6 15.8 ± 0.5
Pin chips (%) > Ø3 4.5 ± 1.2 4.5 ± 0.4 8.0 ± 1.5 4.1 ± 0.2*** 8.7 ± 2.7 7.4 ± 0.5
Fines (%) < Ø3 0.9 ± 0.4 1.0 ± 0.2 2.9 ± 0.6 1.0 ± 0.1*** 2.5 ± 0.9 1.7 ± 0.2
Total accepte (%) 85.5 ± 4.4 84.4 ± 0.4 76.6 ± 2.4 84.3 ± 1.1*** 81.4 ± 5.3 80.3 ± 1.3
ScanChip analyzere
Length (mm) 25.5 24.0 25.2 24.1 24.9 24.6
Width (mm) 22.9 22.3 22.1 23.0 21.5 21.7
Thickness (mm) 4.8 4.3 5.0 4.6 4.8 4.6
Oversized (%) > Ø45 0.3 0.1 0.1 NDd 0.2 0.2
Overthick (%) > //8 10.1 7.2 12.1 8.4 10.5 9.3
Large accept (%) > Ø13 69.2 69.7 64.9 72.0 62.4 63.5
Small accept (%) > Ø7 15.9 17.2 15.2 14.2 18.2 18.8
Pin chips (%) > Ø3 4.1 5.0 6.0 4.7 6.9 6.9
Fines (%) < Ø3 0.6 0.8 1.6 0.8 1.9 1.2
Total acceptg (%) 85.0 86.9 80.1 86.2 80.5 82.3
a
Average values and standard deviations for size fraction distribution calculated using SCAN-CM 40:01 or using automated chip analyzer.
b
Definition: Ø, screen hole diameter in mm; //, screen slot distance in mm.
c
Significant differences (t-test) comparison between frozen and unfrozen pine for each velocity: *** p ≤ 0.01; ** 0.01 < p ≤ 0.05; * 0.05 < p ≤
0.1.
d
Average values and standard deviations for dryness (SCAN 39:94) and thickness distribution (SCAN-CM 47:92).
e
Not detected.
f
Sum of large and small accept chips.
g
Average values for length, thickness, and width were calculated using automated chip analyzer.
wood. The fraction of large accept chips was always larger The average values for length, width, and thickness,
for frozen compared to unfrozen wood, when values for as determined using the ScanChip analyzer are shown in
the same velocity are compared. At 30 m s−1 , this differ- Table 2, whereas the size distribution behind the aver-
ence was significant (p ≤ 0.01). The trend was the oppo- age values is shown in Figure 3. The average length was
site for small accept chips; there was always a larger frac- in the range 24.0–25.5 mm, and slightly lower for frozen
tion of small accept for the unfrozen wood (Table 2), and than for unfrozen wood (Table 2). This slight length dif-
at 30 m s−1 the difference was significant (p ≤ 0.01). With ference is also seen in Figure 3A, which shows that the
regard to the fraction of total accept, the differences be- frozen wood exhibited higher values than unfrozen wood
tween large and small accept cancelled each other, and in the range 10–22 mm and lower values in the range 25–
there were no significant differences between frozen and 35 mm. The average width was similar (21.5–23.0 mm) and
unfrozen wood. The fraction of total accept was in the there was no difference between frozen and unfrozen wood
range 76.6–85.5 %, and the highest values (84.4–85.5 %) (Table 2). The average thickness determined using the
were achieved at a velocity of 27 m s−1 (Table 2). Compar- ScanChip analyzer (4.3–5.0 mm) was somewhat lower than
ing frozen and unfrozen wood, there were no clear trends the corresponding values obtained with the SCAN method
for the fractions of pin chips (4.1–8.7 %) and fines (0.9– (5.1–5.5 mm) (Table 2). The ScanChip data point towards a
2.9 %). The lowest values for pin chips (4.5 %) and fines slightly lower average thickness for frozen wood, which is
(0.9–1.0 %) were achieved at the velocity 27 m s−1 , result- also supported by thickness distribution data in Figure 3C
ing in combined fractions of pin chips and fines being only showing larger fractions of wood chips below 4 mm for
5.4–5.5 %. frozen wood and smaller fractions above 4 mm. This obser-222 | J. Gard Timmerfors et al.: Impact of wood qualities on industrial drum chipping
vation agrees with ScanChip data showing slightly larger
fractions of overthick wood chips for unfrozen logs (Ta-
ble 2). As for the SCAN method, the ScanChip analyzer
did not show any clear differences between frozen and un-
frozen wood for pin chips and fines.
Hernández et al. (2014) reported on changes in the me-
chanical properties of frozen black spruce, which could af-
fect length and thickness distribution. Hartler (1996) ob-
served that the pin chip fractions in industrial wood chip
samples were almost twice as high when the temperature
was −15 °C compared to +15 °C. There was also a trend for
the fractions of fines, which were higher during cold con-
ditions in February than during warm conditions in May
(Hartler 1996). Surprisingly, our data do not show larger
fractions of pin chips and fines for frozen wood compared
to the unfrozen. More studies are needed to understand if
this is due to the use of different wood-chipping technolo-
gies in different studies or to other factors. An increase of
the fractions of pin chips and fines during winter could
possibly be due to more wear on the knives when more
sand and small stones get stuck on wood logs because of
the frost, as less sharp knives would result in increased
fractions of pin chips and fines. Alternatively, this result
could be a consequence of that this study was based on
drum-chipping technology rather than disc-chipping tech-
nology. Biological variation, such as regarding the occur-
rence of knots, might also play a role, as has been observed
previously in studies based on chipping-canters (Grubii
et al. 2019).
Effects of using different wood species
In the third series of experiments, the settings SL25 and
SL19 were used with a drum velocity of 30 m s−1 to investi-
gate chipping of trees from four different wood species, viz.
aspen, birch, pine, and spruce (Table 3). The dry-matter
content was in the range 42–53 %. Within the same set-
ting length, the average thickness, as determined by using
the SCAN method, was higher for the hardwood species
than for the softwood species (Table 3). The average bulk
density was in the range 126–149 kg m−3 . Within the same
Figure 3: Analysis of size distribution of wood chips with different setting length, birch always exhibited the highest value
moisture content using the ScanChip analyzer. The figure shows (Table 3). This can be related to the relatively high ba-
the fractions of wood chips as a function of (A) length, (B) width,
sic density of birch wood (480–550 kg m−3 ) compared to
and (C) thickness: 27 m s−1 , unfrozen wood logs, solid light orange
line, filled star ( ); 27 m s−1 , frozen wood logs, solid light turquoise many other wood species, such as quaking aspen (350–
line, open star ( ); 30 m s−1 , unfrozen wood logs, solid orange 400 kg m−3 ), Norway spruce (380–390 kg m−3 ), and Scots
line, filled circles ( ); 30 m s−1 , frozen wood logs, solid turquoise pine (390–420 kg m−3 ) (Ek et al. 2009).
line, open circles ( ); 33 m s−1 , unfrozen wood logs, solid dark Within the same setting length, the fractions of over-
orange line, filled squares ( ); 33 m s−1 frozen wood logs, solid dark
sized and overthick wood chips were always higher for
turquoise line, open squares ( ).
hardwoods than for softwoods (Table 3). Although this wasJ. Gard Timmerfors et al.: Impact of wood qualities on industrial drum chipping | 223
Table 3: Data for wood chips produced using frozen wood logs of different tree species (SL23 or SL19 using velocity 30 m s−1 ).a
Parameter/fraction Def.b SL23 SL19
Aspen Birch Pine Spruce Aspen Birch Pine Spruce
c
SCAN standard
Dry matter (%) 49 ± 1*** 48 ± 1*** 48 ± 1** 42 ± 1 52 ± 1*** 53 ± 2*** 44 ± 1*** 43 ± 1
** ** *** ** **
Thickness (mm) 5.0 ± 0.5 4.7 ± 0.2 4.5 ± 0.2 4.1 ± 0.2 3.9 ± 0.2 3.8 ± 0.2 3.6 ± 0.2 3.2 ± 0.5
Bulk density (kg m−3 ) 126 ± 2*** 138 ± 5** 131 ± 2*** 135 ± 2 138 ± 2** 149 ± 2*** 136 ± 2 137 ± 2
*
Oversized (%) > Ø45 1.3 ± 1.8 1.7 ± 1.8 0.2 ± 0.4 0.3 ± 0.4 0.7 ± 0.7 0.1 ± 0.2 NDd ND
Overthick (%) > //8 12.9 ± 0.8** 8.0 ± 1.0* 5.3 ± 1.3 5.2 ± 1.3 4.0 ± 0.7 3.6 ± 0.8 2.7 ± 1.2 3.1 ± 0.9
Large accept (%) > Ø13 68.3 ± 2.9 54.8 ± 3.4 74.8 ± 1.9* 54.8 ± 15.7 70.1 ± 1.2*** 67.6 ± 0.6*** 47.6 ± 5.7 36.2 ± 6.9
Small accept (%) > Ø7 11.4 ± 2.7** 23.7 ± 0.4 13.2 ± 0.8* 24.2 ± 8.2 20.3 ± 0.6*** 23.1 ± 0.3*** 35.2 ± 3.5* 39.3 ± 2.7
Pin chips (%) > Ø3 5.1 ± 1.8* 10.3 ± 0.6 5.4 ± 0.6 13.4 ± 8.8 4.3 ± 0.3** 5.0 ± 0.2** 12.9 ± 2.9 19.0 ± 4.8
*** *
Fines (%) < Ø3 0.8 ± 0.1 1.6 ± 0.6 0.8 ± 0.8 2.1 ± 0.2 0.7 ± 0.1 0.6 ± 0.1 1.5 ± 0.4 1.5 ± 1.4
Total accepte (%) 79.8 ± 0.3 78.5 ± 3.8 88.0 ± 1.9* 79.1 ± 7.8 90.4 ± 1.3** 90.7 ± 0.7** 82.8 ± 2.2* 75.5 ± 4.4
ScanChip analyzerf
Length (mm) 23.7 21.9 21.4 20.5 16.9 16.8 15.6 15.9
Width (mm) 24.7 19.8 20.9 17.6 19.6 18.6 16.5 16.9
Thickness (mm) 4.4 4.0 3.7 3.9 3.3 3.0 2.8 2.8
Oversized (%) > Ø45 0.51 0.3 0.3 0.2 0.4 0.1 ND ND
Overthick (%) > //8 11.8 7.0 4.3 4.2 2.6 1.8 2.0 2.6
Large accept (%) > Ø13 67.5 58.2 66.5 43.6 57.0 50.8 31.5 31.9
Small accept (%) > Ø7 12.5 24.0 20.9 31.2 32.1 36.7 42.8 40.8
Pin chips (%) > Ø3 4.9 9.6 7.1 18.5 7.5 9.8 21.9 21.5
Fines (%) < Ø3 0.9 0.9 0.9 2.3 0.5 0.8 1.8 3.3
Total accepte (%) 79.9 82.2 87.4 74.8 89.3 87.5 74.3 72.7
a
Average values and standard deviations for size fraction distribution calculated using SCAN-CM 40:01 or using automated chip analyzer.
b
Definition: Ø, screen hole diameter in mm; // screen slot distance in mm.
c
Significant differences (t-test) compared to spruce wood chips at the same length setting (SL23 or SL19) are indicated: *** p ≤ 0.01; ** 0.01 <
p ≤ 0.05; * 0.05 < p ≤ 0.1. Average values and standard deviations for dryness (SCAN 39:94), bulk density (SCAN-CM 46:92), and thickness
distribution (SCAN-CM 47:92).
d
Not detected.
e
Sum of large and small accept chips.
f
Average values for length, thickness, and width calculated using automated chip analyzer.
not always statistically significant for the SCAN analysis, cept decreased and the fractions of small accept increased
the same pattern emerged also for the ScanChip analysis when the setting length was changed from SL23 to SL19
(Table 3). That observation also agreed with the values for (Table 3). For the hardwood species, aspen and birch, there
average thickness (Table 3), which were higher for hard- was no such trend (Table 3). For SL19 and according to
wood species than for softwood species. The thickness dis- the SCAN method, the approx. accept fractions for aspen
tribution according to the ScanChip analyzer showed that and birch were: large accept 70 %, small accept 20 %, and
chipping of aspen, in particular, resulted in larger frac- total accept 90 %. The ScanChip analyzer showed similar
tions of thicker wood chips than the other species (Fig- results, although the fractions of large accept were some-
ure 4C). For all wood species, the setting SL19 showed a what lower and the fractions of small accept somewhat
more narrow size distribution than SL23 (Figure 4). higher.
For the Kraft pulping industry, the large size accept Although short average chips length would result in
fraction is particularly important. A decrease of the aver- abnormally large fractions of pin chips and fines, the high
age length of the wood chips might lead to a smaller frac- standard deviation for spruce and the setting SL23 made
tion of large accept chips, due to an average smaller di- the results from the setting SL19 more easily interpreted
agonal. Together with the thickness the diagonal will de- (Table 3). In summary, the SCAN size-fraction analysis
termine which slots the wood chips will pass defining the showed that for large-sized fractions, such as oversized
difference between large and small accept chips. For soft- and overthick chips, hardwoods exhibited higher values
wood species, pine and spruce, the fractions of large ac- than softwoods. In agreement with this, hardwood ex-224 | J. Gard Timmerfors et al.: Impact of wood qualities on industrial drum chipping
hibited lower values than softwood with respect to pin
chips.
The average values for length, width, and thickness,
as determined using the ScanChip analyzer, are shown
in Table 3, whereas the size distribution behind the aver-
age values is shown in Figure 4. For each setting length,
the values for average length were higher for the hard-
woods than for the softwoods (Table 3). This is supported
by Figure 4A. The figure also shows that the softwood
species exhibited very similar length distribution whereas
the hardwood species differed somewhat, especially for
SL23, where the curve for aspen shifted towards longer
lengths compared to the curve for birch.
Table 3 shows that for each setting, aspen wood chips
always exhibited the largest average width. The details are
shown in Figure 4B, which reveals that the width distri-
bution was more even for SL19 than for SL23. For SL19,
the width distribution of the softwoods were very similar,
and distinctly different from the hardwoods (Figure 4B).
As for length distribution of SL23, the curve for aspen
shifted towards higher values compared to the curve for
birch.
The average thickness determined using the ScanChip
analyzer was somewhat lower than for SCAN method.
However, the ScanChip values for average thickness agree
with the SCAN method data in the sense that for each
setting the chips from the hardwood species were thicker
than the chips from the softwood species (Table 3). Such
differences between the analysis methods have been no-
ticed previously in this study. The distribution can been
seen in Figure 4C. For SL19 the distribution was similar
for the four wood species, although more narrow for the
hardwoods. For SL23, birch, pine and spruce show sim-
ilar distributions, whereas aspen differs somewhat (Fig-
ure 4C).
A comparison of wood chips using six length set-
tings indicated that the average thickness of southern
red oak wood chips was larger than that of loblolly pine
wood chips (Twaddle 1997). This would agree with our re-
sults in the sense that hardwood gave thicker wood chips
than softwood. Pine also exhibited smaller variation in
thickness compared to three hardwood species (Twaddle
Figure 4: Analysis of size distribution of wood chips from different
wood species using the ScanChip analyzer. The figure shows the 1997), but no similar trend is visible in our data (Fig-
fractions of wood chips as a function of (A) length, (B) width, and ure 4C). As there were no measurements of the actual
(C) thickness. Aspen, SL19, solid light green line, filled squares length of the wood chips or of the average size (Twaddle
( ); aspen, SL23, dashed light green line, open squares ( ); birch, 1997) and as chipping technology and evaluation meth-
SL19, solid gray line, filled star ( ); birch, SL23, dashed gray line,
ods vary, the data in the two studies are difficult to com-
open star ( ); pine, SL19 solid brown line, filled circles ( ); pine,
pare.
SL23, dashed brown line, open circles ( ); spruce, SL23, solid dark
green line, filled hexagon ( ); spruce, SL23, dashed dark green line,
open hexagon ( ).J. Gard Timmerfors et al.: Impact of wood qualities on industrial drum chipping | 225
Funding: This research was supported by the Swedish
Conclusions Energy Agency (P40512-1), Bio4Energy (https://www.
bio4energy.se/), the Kempe Foundations, and the Indus-
The investigation of different wood qualities and wood
trial Doctoral School (IDS) of Umeå University.
species using the novel type of drum chipper resulted in
clear-cut differences with regard to the moisture content
Conflict of interest: The authors declare no conflicts of in-
of the wood and with regard to comparison of different
terests.
species of hardwood and softwood, whereas a comparison
of frozen and unfrozen softwood resulted only in subtle
differences. When fast-growing moist wood was chipped,
the average thickness increased, which was also the case References
for dry wood logs. When hardwood and softwood were
chipped using the same settings, the average thickness of Abdallah, R., Auchet, S., Méausoone, P.J. (2011) Experimental study
about the effects of disc chipper settings on the distribution of
hardwood chips was larger than that of softwood chips.
wood chip size. Biomass Bioenergy 35(2):843–852.
Thus, in order to maintain the same thickness, the knife
Brännvall, E. (2009) Wood handling. In: Pulping Chemistry and
settings would need to be changed when changing be- Technology, Eds. Ek, M., Gellerstedt, G., Henriksson, G., De
tween softwood and hardwood. Utilization of large quan- Gruyter, Berlin. pp. 13–34.
tities of dry wood or fast-growing moist wood would also Cáceres, C.B., Hernández, R.E., Koubaa, A. (2015) Effects of the
require a change in knife setting in order to maintain the cutting pattern and log provenance on size distribution of black
spruce chips produced by a chipper-canter. Eur. J. Wood Prod.
average thickness.
73(3):357–368.
As expected, larger fractions of pin chips and fines Curti, R., Marcon, B., Denaud, L., Collet, R. (2018) Effect of grain
were generated from drier wood qualities. In the compar- direction on cutting forces and chip geometry during green
ison of different wood species, the fraction of pin chips beech wood machining. BioResources 13(3):5491–5503.
and fines was low for hardwood species and particularly Ek, M., Gellerstadt, G., Henriksson, G. Pulp and Paper Chemistry
and Technology. Volume 1 – Wood Chemistry and Wood
for aspen. Further studies will be needed to evaluate the
Biotechnology. De Gruyter, Berlin, 2009. p. 35.
optimal settings for each wood quality and wood species,
Gard Timmerfors, J., Jönsson, L.J. (2019) Evaluation of novel drum
and to understand if unexpected results, such as the ab- chipper technology: Pilot-scale production of short wood
sence of increase in the fractions of pin chips and fines for chips. Tappi J. 18(10):585–592.
frozen wood, can be attributed to the new drum-chipping Gard Timmerfors, J., Sjölund, T., Jönsson, L.J. (2020) New
technology or to other factors. A direct comparison of drum-chipping technology for a more uniform size distribution
of wood chips. Holzforschung 74(2):116–122.
the results of chipping of different segments of the same
Grubii, V., Cáceres, C.B., Hernández, R.E., Blais, C. (2019) Effect
wood logs using traditional disc-chipping technology and of chipping edge inclination angle on size distribution of
the novel drum-chipping technology would be of interest. pulp chips produced by a chipper-canter. Wood Fiber Sci.
Studies of wood with structural differences, for example 51(4):402–415.
with regard to the occurrence of knots, would be of inter- Hart, P.W. (2009) Seasonal variation in wood: Perceived and real
impacts on pulp yield. Tappi J. 8(3):4–8.
est for understanding the formation of overthick and over-
Hartler, N. (1996) Achievements and significance of optimal chip
sized wood chips. Future work is also needed to address
quality. Tappi J. 79(2):259–264.
potential effects of damage caused by rot and insects on Hartler, N., Stade, Y. (1977) Chipper operation for improved chip
wood chip quality, impregnation, and cooking. quality. Sven. Papp.tidn. 80(14):447–453.
Hellström, L., Gradin, P., Carlberg, T. (2008) A method for
Acknowledgments: We are grateful to Sten Häggström, experimental investigation of the wood chipping process.
Nord. Pulp Pap. Res. J. 23(3):339–342.
Multi Channel Sweden AB, for help with wood chipping
Hernández, R., Passarini, L., Koubaa, A. (2014) Effects of
and for the supply of wood logs to the comparison of temperature and moisture content on selected wood
moisture content and frozen wood, and to Gunnar Kalén mechanical properties involved in the chipping process. Wood
and Markus Segerström at the BTC of the Swedish Univer- Sci. Technol. 48:1281–1301.
sity of Agricultural Sciences in Umeå for help with han- Marrs, G. (1989) Measuring chip moisture and its variation. Tappi J.
72(7):45–54.
dling of wood logs used in the tree species comparison. We
Pfeiffer, R., Collet, R., Denaud, L.E., Fromentin, G. (2015) Analysis of
also want to thank Metsä Board Husum for access to their
chip formation mechanisms and modelling of slabber process.
ScanChip system, and to Domsjö Fabriker AB for access to Wood Sci. Technol. 49:41–58.
the wood yard.226 | J. Gard Timmerfors et al.: Impact of wood qualities on industrial drum chipping
Sfeir, T.d.A., Pécora Junior, J.E., Ruiz, A., LeBel, L. (2021) Integrating Spinelli, R., Magagnotti, N., Paletto, G., Preti, C. (2011) Determining
natural wood drying and seasonal trucks’ workload restrictions the impact of some wood characteristics on the performance of
into forestry transportation planning. Omega 98:102135. a mobile chipper. Silva Fenn. 45(1):85–95.
https://doi.org/10.1016/j.omega.2019.102135. Twaddle, A. (1997) The influence of species, chip length, and ring
Skogsdata 2018, Sveriges officiella statistik (2018) Institutionen för orientation on chip thickness. Tappi J. 80(6):123–131.
skoglig resurshushållning, SLU, Umeå. Uhmeier, A. (1995) Some fundamental aspects of wood chipping.
Spinelli, R., Magagnotti, N. (2012) The effect of raw material, cut Tappi J. 78(10):79–86.
length, and chip discharge on the performance of an industrial
chipper. For. Prod. J. 62(7-8):584–589.You can also read


