ESG and investments implications
←
→
Page content transcription
If your browser does not render page correctly, please read the page content below
22 January 2020

ESG and investments implications

Peter Hermanrud              Fredrik Gundersen            SpareBank 1 Markets
Phone : (+47) 24 13 36 22    Phone : (+47) 24 14 36 28    Phone         : (+47) 24 14 74 18
Mobile : (+47) 95 18 48 86   Mobile : (+47) 45 45 29 30   Visit address : Olav Vs gate 5, 0161 Oslo
E-mail : ph@sb1markets.no    E-mail : fg@sb1markets.no    Post address : PostBox 1398 Vika, 0114 Oslo

Investment Summary

• ESG represents the biggest change in investor perspective since dot.com. You are not
  respectable if you don’t invest responsibly
• Managers of USD 12.1 tn have pledged to exit fossil shares. For comparison, the Global AUM
  is ~ $90 tn
• Virtue shares has been done great, matching Nasdaq during dot.com
• All Vice sectors (being excluded form benchmarks) have underperformed
• Except for the ‘outliers’ we see limited share price effect of ESG till now. Key reasons are
  inconsistent ratings, and the market is mainly rerating the ‘E’ in ESG
• We expect to see increasing diversity of valuation multiples based on emissions to
  production
ESG is increasingly important for shareholders
EY survey of 260 institutional investors: 50% of investors say they ‘rule out immediately’
investments that ‘disclose risks from climate change’. Up from 8% in 2017. Presumably includes
Energy shares?

Source: EY Survey (260 institutional investors globally), SB1 Markets                            3
Norwegian fund managers focus on all aspects of ESG. Here DNB
KLP, DNB and Storebrand abt. 3-5 dedicated ESG managers, around 10-20% of the team. But all
portfolio managers work with ESG issues

                                                                                              4
How do fund managers work with ESG issues?
Based on presentations by DNB, Storebrand and KLP

Activity             Example                                   End result
Reporting            Emissions/kg produced. Scope 3.           Better information and
                                                               decision support
Standard setting     Best practice emission / kg               Minimum requirements
Active ownership     Voting, election committee, dialogue      Company changes behavior,
                     with the companies                        or new board members
Investor             Carbon 100+ (40% of global AUM).          Changed reporting or
cooperation          Best effect when local and large owners   behavior
Exclusions           Exclude companies with unsustainable      Exclusion list, ref. NBIM.
                     business practices                        Offer no-carbon index funds
ESG integration      Cooperation between dedicated ESG         Lower valuation of weak-
                     analyst and fund manager                  ESG companies due to exp.
                                                               cost of future requirements
Thematic             Invest in companies that actively work    Storebrand Global ESG,
investments          for a more sustainable world              ESG+, Global Solutions
                                                                                             5
Litt om forskning på området
Samt ESG og eiendom

                               6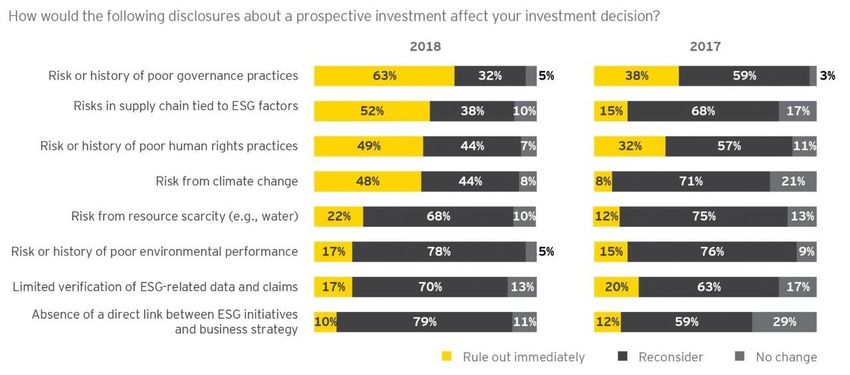
An increasing share of investors has pledged to exclude fossil fuels
1000 institutions with $12.1 tn in assets have pledged to cease new investment, divest within 3-
5 years and invest more in ‘climate solutions’. Global AUM is ~ $90 tn

                                                                                    » Black Rock to exit coal etc, launch index funds that
                                                                                      exclude fossil fuels and use as default in mixed
                                                                                      products ex-US retirement ($7tn, Jan 20). Joined…
                                                                                    » …Climate Action 100+ ($ 41tn incl Black Rock)
                                                                                      pushing for disclosure and emission reductions
                                                                                    » New York City: Decided to divest pension fund from
                                                                                      fossil fuels ($200bn, Jan 18)
                                                                                    » University of California: Divestment from the fossil
                                                                                      fuel industry (Sep 19)
                                                                                    » Ireland: National investment fund required to sell all
                                                                                      investments in coal, oil, gas and peat «as soon as is
                                                                                      practicable» (€ 8bn)
                                                                                    » University of Oslo: To stop all investments in fossil
                                                                                      fuel (NOK 1bn, Oct. 19)
                                                                                    » Impossible to find Norwegian Index Funds that track
                                                                                      full indexes: All exclude some shares
                                                                                    » Fossil free funds have assets of more than USD
                                                                                      100bn
               Increase since Sep 19                                                » NBIM to sell upstream E&P + coal, set aside $10bn
                                                                                      for renewables,
                                                                                    » EIB to invest $1000bn in renewables by 2030
Source: DivestInvest, The Guardian, British Columbia University, CNBC, Dagsavisen
                                                                                                                                               7
Banks ex-China no longer lend to coal, and increasingly exclude other fossil fuels
Lending policies in world’s 20 largest banks (EUR bn), SB1M interpretation
Company                                               Country     Loans (EURbn)       Coal   A&A offshore* Oil sand / shale Other upstream Gas               Peat Renewable
Industrial and Commercial Bank of China               China                1,990
China Construction Bank                               China                1,767
Bank of China Ltd                                     China                1,530
Agricultural Bank of China Ltd                        China                1,523
Banco Santander SA                                    Spain                  883
Mitsubishi UFJ Financial Group                        Japan                  869
HSBC Holdings PLC                                     UK                     866
JPMorgan Chase & Co                                   US                     851
Wells Fargo & Co                                      US                     842
Bank of America Corp                                  US                     831
BNP Paribas SA                                        France                 766
Mizuho Financial Group Inc                            Japan                  637
Sumitomo Mitsui Financial Group                       Japan                  632
Bank of Communications                                China                  630
ING Groep NV                                          Netherlands            592
Citigroup Inc                                         US                     586
Lloyds Banking Group PLC                              UK                     558
China Merchants Bank Co Ltd                           China                  509
UniCredit SpA                                         Italy                  472
Toronto-Dominion Bank                                 Canada                 468

International financial institutions / multilateral banks
                                            EIB
                                            World Bank
                                                                                                     = new policy favour lendinig in segment
                                                                                                     = new policy neutral
                                                                                                     = new policy partially exclude new lending in segment
Source: Company reports, World Bank, EIB, Bloomberg, Reuters, FT, TCFD, SB1 Markets                                                                                      8
                                                                                                     = new policy ban new lending in segment
                                                                                         * = Arctic and Antarctic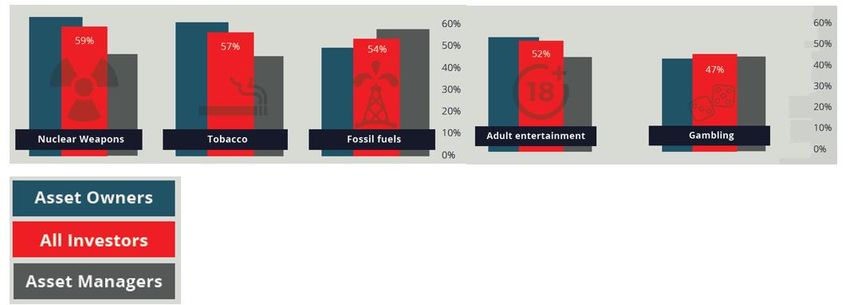
Share price

    Climate screening is not a Norwegian or U.S. phenomenon. Rather the contrary
    Norway, Saudi and the U.S. have a large proportion of deniers. Other survey shows Norwegians
    are least concerned about the consequences (Travel here now and you’ll understand why…).

    Source: Yougov.co.uk, SB1 Markets.                                                             9
Resulting in a lot of money chasing the same few “virtue shares”
While the horrendous Vice stocks get what they deserve…Greenwashing the key driver, but also
ESG Funds, retail momentum investors.

                                                               • Virtue: Based on Nordic companies
                                                                 with the strongest E profile (Actively
                                                                 doing good):
                                                                 Solar: Scatec Solar
                                                                 Wind Power: Bonheur, Ørsted,Eolus
                                                                 Wind Equipment: Vestas
                                                                 Hydrogen: NEL, Powercell
                                                                 Recycling, waste: Tomra, Scanship,
                                                                 Climeon
                                                               • Vice:
                                                                 Based on largest pure play
                                                                 companies, in or close to Norway:
                                                                 Coal: Yancoal and Whitehaven
                                                                 Betting: Kindred, Betsson and LVS
                                                                 Porn: RCI Hospitality
                                                                 Consumer banks: NOFI and KOMP
                                                                 Tobacco: S&P 500 Tobacco, Swedish
                                                                 Match
                                                                 Alcohol: Arcus
                                                                 Nuclear weapons: BWX
                                                                 Technologies
                                                                 Indexes are equally weighted and
                                                                 rebalanced quarterly                10
ESG
All virtue shares have been strong, all Vice shares weak
Green Virtue shares, red Vice (Sin) shares
Solar
Wind
Recirculation
Cleaning tech
Coal
Tobacco
Alcohol
Porn
Nuclear Weapons
Gambling
Nordic consumer banks
11The biggest change in investor perspective since dot.com has given similar rally
Like dot.com the rally started with fundamentals, but both may end in a bubble
12Initially, a self reinforcing prophecy: ESG funds are becoming winners
More money in ESG funds = More buyers of ESG shares = higher ESG share prices = better ESG
fund performance = even more money in ESG funds. Soon: “ESG not only morally sound, but
also more profitable”
“Sustainable funds more likely to be top performers, study shows”
13Next step, there will be winners and losers within each sector One winner in the ESG boom is the ESG rating agencies… ESG er ikke forward looking 14
But till now, the picture is too inconsistent to have an effect
But consensus will change here, important to follow the trend

                                                                  15
So we have seen no rerating of shares with high ESG score on Reuters
Key reason: Inconsistent ESG ratings, and market is chiefly rerating the ‘E’ in ESG, particularly
emissions.
Reuters ESG score methodology
Pillar Category Indicators Weight Pillar
OSEBX shares: Total return vs ESG score weight
100
Resource Use 19 11%
80
Environmental Emissions 22 12% 34%
Annual Total Return '18 and '19 %
60
Innovation 20 11%
40
Workforce 29 16%
20
Human rights 8 4.5%
0
0 20 40 60 80 100 Social Community 14 8% 36%
-20
-40 Product
12 7%
responsibility
-60 y = -0.2154x + 19.3
R² = 0.018 Management 34 19%
-80
Governance Shareholders 12 7% 31%
-100
ESG Score (Reuters) CSR strategy 8 4.5%
178 100% 100%
16ESG is affecting bonds too, but small effect till now (2 bps?)
Increasing funds allocated to green purposes – widening pricing spread in the future? The most
frequent green bond issuers in the Nordics at the moment are utilities, real estate and banks
250 25
Green bonds issued by corporates, governments and municipals
Global (USDbn) Nordic (USDbn)
200 20
150 15
100 10
50 5
0 0
2014 2015 2016 2017 2018 2019 2014 2015 2016 2017 2018 2019
Total YTD Total YTD
Norway 3.5 bn. Norwegian ISIN HY green bonds: Teekay, Småkraft, Stena Metall Finans, Scatec Solar, Vardar etc. Cicero
Source: Bloomberg. Criteria: Use of proceeds to be applied towards projects or activities that promote climate change mitigation or adaption, or other environmental sustainability purposes 17Some possible ‘Next Steps’
• Emergence of an ‘industry standard’ with respect to ESG reporting
• More visible price differentiation between companies within a sector based on
• - ESG scores, if investors agree on how scoring should work
• - Easily identifiable parameters such as GHG emissions / tonne produced
• More investors willing to invest in companies with low ESG score, but with an activist
approach with respect to ESG once they are owners
• Or of course, the current trend could level out and reverse (Cyclical ESG focus?)
18Oil E&P share implications
19Energy investors are demanding dividends now rather than investments…
Companies are paying dividends and buying each other rather than investing
E&P Majors capex vs dividends and buybacks
90
E&P Majors: EQNR, ENI, BP, Shell, Total, Repsol, Chevron,
Exxon, ConocoPhilips
80
200
70
Dividend and Buybacks USDbn
60
150
Investments USDbn
50
40
100
30
20
50
10
Reported Figures
0 0
sep. 12
sep. 13
sep. 14
sep. 11
sep. 15
sep. 16
sep. 17
sep. 18
TTM Dividends (lhs) TTM Buybacks (lhs) TTM Investments (rhs)
Source: Macrobond, OSE, SB1 Markets. 20Energy has become unusually cheap… Highest dividend yield. Lowest P/E and Shiller P/E compared to 15-year history Source: MSCI, SB1 Markets, Macrobond. 21
…but may well become cheaper if investors sell out as they promise
If 20% of funds become fossil free and 40% are indexed portfolios, remaining active managers
must have a massive overweight position in energy of 9% vs. 6% in the index. Even lower fossil
valuations than today?

                                                                Non-           All      SUM
                                                                fossil   Index other
                                                   Share of      20%     40%      40% 100%
                                                   assets
                                                   Fossil         0%      6%      9%      6%
                                                   weight
                                                   Sum            0%     2.4%    3.6%     6%

Source += The Economist                                                                          22
Hard to maintain oil production long term after 35% lower E&P spending
Most new production just replaces depletion. Depletion has increased due to shale and a larger
production base (8% to 9%). So needed new production is almost unchanged
Needed new oil production, mbd
10
9
Demand
8 growth
7
6
Mbd
5
4
Depletion
3
2011-
2 2016 Now Diff
1 Global E&P Capex, USD bn 861 559 -35%
0
2011-16 2020 Depletion 7.5-9% @ zero 7.5 9
capex, Mbbl
Demand growth, Mbd 2 0
Needed new oil, Mbd 9.5 9 -5% 23Historically, we have needed to spend more USD per new barrel, not less
Geology has trumped technology
24Project approvals + discoveries fell sharply from 2014. Effect visible from 2021
Similar decline for global exploration wells
Approved projects and oil discoveries, prod. at Global added oil production from new fields, ex shale, mbd
4000
peak, global ex shale (kbbl/d)
6000 20
3500
18
5000 3000
16
14 2500
4000
12
(kbbl/d)
2000
bn boe
kbbl/d
3000 10
1500
8
2000
6 1000
4
1000 500
Approved projects, lhs Oil discoveries, rhs 2
0
1999
2000
2001
2002
2003
2004
2005
2006
2007
2008
2009
2010
2011
2012
2013
2014
2015
2016
2017
2018
2019
2020
2021
2022
0 0
2005
2006
2007
2008
2009
2010
2011
2012
2013
2014
2015
2016
2017
2018
2019
Start up year Ramp up year 2 Ramp up year 3
Legge inn global exploraion wells
25Makro
Large changes in investor behavior – no change in oil demand!
Zero signs that climate actions have affected oil demand, at least yet. If anything, demand growth
has been higher than usual!
5% y = 0.637x - 0.0091
R² = 0.5027
4%
3% Last 4 years
Change oil demand
15
2% 16
18
19
1% 20E
17
0%
-1 % 2015-2018
1989-2014
-2 %
-1 % 0% 1% 2% 3% 4% 5% 6%
Global GDP growth
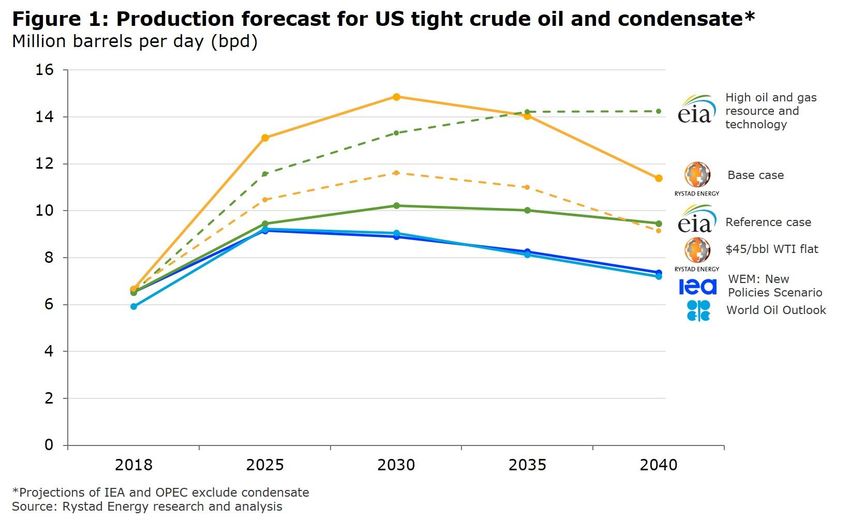
26Most long term projections expect oil demand to keep growing past 2030
Decline in OECD more than offset by continuing growth in China, India, Africa and other EMS
Global oil demand, mbd
120
IEA Current policies
OPEC forecast
IEA Stated policies
100
DNV-GL forecast
80
mbd
60
40
20
0
2012
2014
2015
2017
2018
2020
2021
2023
2024
2026
2027
2029
2030
2010
2011
2013
2016
2019
2022
2025
2028
27‘Win-Win’ for energy investors: Scarcity of oil gives high price
Leading to higher oil price, less oil consumption, great shareholder returns – and lower CO2
emissions!
28If fossil fuels are the new tobacco…
There will be a great investment opportunity. Now, or soon. Tobacco 22x vs S&P 3.2x!
“Vice” effect 2
*Morningstar Consumer Defensive index 29Property: Large tenants will not move to buildings with high emissions • Companies have for a few years focused somewhat on office emissions due to corporate image • As a new development, owners are now pushing for Scope 3 reporting – corporate emissions including indirect emissions from rented offices • Companies will increasingly commit themselves to declining scope 3 emissions • Commercial property is responsible for 40% of global GHG emissions • In the near future, moving to lower-emission buildings will no longer be ‘nice to do’ but ‘need to do’ • Emissions will clearly affect rental level and vacancy rate, particularly for large one-tenant buildings. More important in 2 years than today Source: SB1 Markets. 30
Expected share price
   development

                       31
ESG
ESG investors may end up helping save the world, but not their wallets
ESG Subsectors with low entry barriers will see low investment returns. If high barriers, high
growth and sustained margins
Share
price Phase 1 Phase 2 Phase 3
More money Stock offerings to Overcapacity
chasing same fund capex
stocks
Vice shares
Today
Virtue shares
Selling Takeovers, more Undercapacity
pressure dividends, less capex
Time
Source: SB1 Markets 32The Nordics are leading the way in repricing Virtue and Vice shares. But
others are following, and should become more similar to the Nordics
Share price performance 2018-2019
• Virtue share revaluation has been
most prominent in the Nordics.
Region Virtue Vice • Logically we should see Nordic
Virtue companies acquire peers in
Nordics the U.S.
Europe • Vice revaluation has been more
parallel, but more likely that U.S.
Vice companies will buy European
USA peers than Vice versa
33Largest valuation difference in the Nordics
Nordics in green are at top among the Virtue shares, bottom among the Vice shares
P/E 20E - Virtue Shares 50x
P/E 20E - Vice Shares
neg.neg.neg.neg.neg.neg.neg. 118x51x
50x 48x
45x
45x 43x
40x
40x
34x 35x
35x 32x
30x
30x 28x 27x 30x
25x 25x 24x
21x
18x 20x 20x 19x
20x 20x
17x
14x 14x
15x
11x 15x 14x 13x
9x 12x 12x 12x 11x
10x 11x 10x
10x 9x
8x 7x 7x 7x 7x
5x
5x
0x
Ballard Power Systems
Seche Env
EDP Renewables
Climeon
Eolus
NextEra
Orsted
Terna
Sinovel
Tomra
Nordex
Neoen
Renewi
NEL
Powercell
Terraform Power
SSO
Vestas
Brookfield Renewables
Scanship
ITM Power
0x
Green - Nordics Blue - Europe Grey - America (+Sinovel Asia) Green - Nordics Blue - Europe Grey - USA/Other
Source: SB1 Markets. 34Some investment ideas – Vice portfolio
• VICE
» Buy shares have been sold down on ESG criteria, have low P/E, are a small part of the world index
and have moderate expected changes in product demand
▪ ARCUS, NOFI, BETSSON, BWX Technologies, British American Tobacco, RCI Hospitality
» Await fossil fuel companies, since portfolio exclusions means almost all unrestricted investors must
have large overweight. We expect a great decade for Fossil shares, but maybe not 2020
• VIRTUE:
» Pick sector leaders, companies with business models that are hard to replicate (Benefit from higher
demand, margins not destroyed by keen competition (Vestas, NEL?)
» Avoid ‘me too’ investments - competitive auctions and winner’s curse will lead to poor profitability
(Ørsted?)
» Pick companies that look decent on P/E (Bonheur, Eolus?)
35Disclaimer
SpareBank 1 Markets AS (“SB1 Markets”)
This report originates from SB1 Markets’ research department. SB1 Markets is a limited liability company subject to the supervision of The Financial Supervisory Authority of Norway (Finanstilsynet). SB1 Markets
complies with the standards issued by the Norwegian Securities Dealers Association (VPFF) and the Norwegian Society of Financial Analysts.
No investment recommendation
Any views and opinions relating to securities mentioned in this report should be interpreted as general market commentary, and not as investment recommendations within the meaning of section 3-10 of the
Norwegian Securities Trading Act.
No personal recommendation
The information contained in this publication is general and should not be construed as a personal recommendation within the meaning of the Norwegian Securities Trading Act, section 2-3 (4). It does not provide
individually tailored investment advice regarding a particular financial situation, investment experience, risk profile or preferences of the persons who may receive this report. For tailored investment advice
regarding stocks mentioned in this publication, please consult our brokerage desk or your individual investment advisor.
Research for the purposes of unbundling
This report constitutes research material for the purpose of the inducement rules under MiFID II.
Conflicts of interest
SB1 Markets, affiliates and staff may perform services for, solicit business from, hold long or short positions in, or otherwise be interested in the investments (including derivatives) in any stock mentioned in this
publication. To mitigate possible conflicts of interest and counter the abuse of confidential information and insider knowledge, SB1 Markets has set up effective information barriers between divisions in possession
of material, non-public information and other divisions of the firm. Our research team is well versed in the handling of confidential information and unpublished research material, contact with other divisions, and
restrictions on personal account dealing. The views expressed in this report accurately reflect the analyst’s personal views about the companies and the securities that are subject of the report, and no part of the
research analyst’s compensation is related to the specific views expressed in this report.
Accuracy of sources
All opinions and statements in this publication are, regardless of source, given in good faith, and may only be valid as of the stated date of this publication and may be subject to change without notice. SB1 Markets
has taken all reasonable steps to ensure that the information contained in this report is true and not misleading. Notwithstanding such efforts, we make no guarantee as to its accuracy or completeness.
Risk information
Return on investments is inherently exposed to risks. The value of an investment position may both rise and fall during the investment period. If the return on investments is positive at one time, there is no
guarantee that it will remain such in future. In certain cases, losses may exceed the sum of the original investment.
Limitation of liability
Any use of information contained in this report is at your own individual risk. SB1 Markets assumes no liability for any losses caused by relaying on the information contained in this report, including investment
decision taken on the basis of this report.
Limitation on distribution
This publication is not intended for, and must not be distributed to, individuals or entities in jurisdictions where such distribution is unlawful.
36APPENDIX
37Hydro / Wind power producers: Large location based performance difference
All Nordics have performed great. Good to moderate in Europe and the U.S.
Mkt. Cap
Company Country (USDbn) P/E 19 P/E 20
NextEra USA 114.3 28x 26x
Terraform Power USA 3.5 neg. 60x
Brookfield Renewables Canada 14.4 62x 48x
Terna Energy Greece 0.9 17x 14x
Neoen France 2.4 62x 39x
EDP Renewable Portugal 9.5 25x 26x
SSO Norway 1.4 180x 27x
Orsted Denmark 38.5 41x 28x
BON Norway 0.9 neg. 31x
Eolus Sweden 0.3 16x 12x
38Similar trend within Hydrogen and cleaning Again the Nordics are clear winners while peers have moderate returns on average Source: SB1 Markets. 39
As well as for Wind power equipment manufacturers
Less stellar returns, but again the Nordic share has outperformed. Sinovel (China) weak

Source: SB1 Markets.                                                                      40
If you are after Financial gains, buy this portfolio
You may of course choose not to own some of these for moral reasons,

  Vice Portfolio             Ticker   Price
  BWX Technologies           BWXT          58.98
  Betsson                    BETS B         46.3
  Arcus                      ARCUS          36.2
  RCI Hospitality            RICK          18.33
  British American Tobacco   BATS           3050
  Norwegian Finans Holding   NOFI          90.05

Source: SB1 Markets                                                    41
P/E 20E Oil Majors                     P/E 20E Tobacco Shares
                                                                                                    P/E 20E Gambling shares
20.0x         18.6x                                   16.0x
                                                                                            25.0x
18.0x                                                 14.0x    13.6x
                                                                                                    21.3x
16.0x
                                                      12.0x                                 20.0x
14.0x                                                                              10.3x
                                11.4x       11.8x     10.0x
12.0x
                                                                                            15.0x
10.0x                                                  8.0x
 8.0x                                                                                       10.0x
                                                       6.0x
                                                                                                                              7.5x
 6.0x
                                                       4.0x
 4.0x                                                                                        5.0x
 2.0x                                                  2.0x

 0.0x                                                  0.0x                                  0.0x
                US               EU         Nordics             US                     EU            US                   Nordics

    Source: SB1 Markets.                                                                                                             42
Some investment ideas for corporates on how to maneuver in the Virtue space
Investment strategy suggestions for portfolio managers, corporate and PE
• Take advantage of high demand growth in Virtue sectors – buy companies with business
models that are hard to replicate
• Avoid ‘me too’ investments - competitive auctions and winner’s curse will lead to poor
profitability
• For corporates: Investments that have marginal profitability may prove profitable longer
term due to effect on corporate profile
• For corporates and PE: Carve out and spin off part og E - related activities, if any. Take
advantage of high willingness to invest in even early phase E-related activities, at high prices.
• For corporates: Report on key ESG platforms and get rating (MSCI, Sustainalytics)?
43More speculatively, 50% of investors say they expect to have exited Vice
sectors by 2030
Share of investors expecting to have ceased investments in potentially harmful sectors, by 2030
The future of ESG investing August 2018 (281 respondents) 44Extreme interest in Virtue companies, no interest in Vice shares
…
Virtue Ltd Company Presentation Vice Ltd Company Presentation
45Money flows into ESG funds, and out of ‘Vice shares’
And the pace is accelerating. Fossil free funds manage $100bn globally
Estimated Cumulative U.S. Sustainable Funds Flows
from 2009
50
Estimated Cumulative Flows (USDbn)
45
40
35
30
25
20
15
10
5
0
2009 2010 2011 2012 2013 2014 2015 2016 2017 2018 2019E
Source: Morningstar
46And well below
the average
last 15 years
Energy is by far the cheapest sector now…
Lowest vs historical average, both on CAPE forward P/E. Lowest CAPE overall
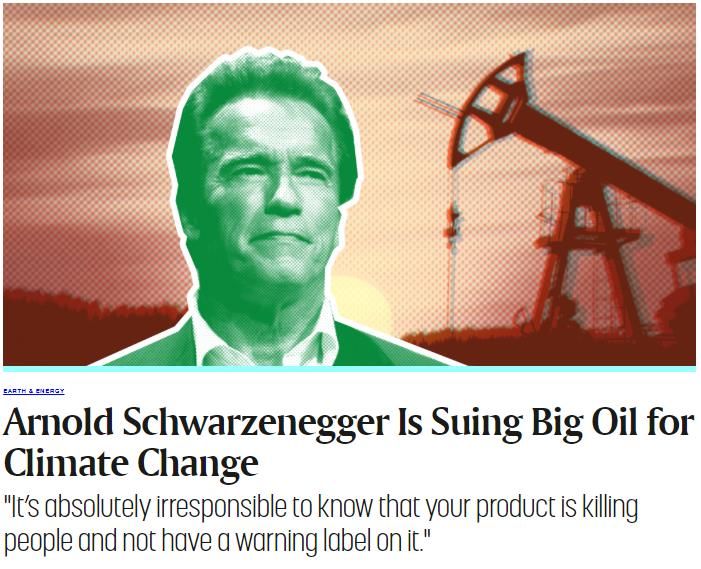
Source: MSCI, SB1 Markets, Macrobond. 47“Oil is the new tobacco” – Former California Governor Arnold Schwarzenegger
March 2019
«Schwarzenegger sees a direct parallel between what happened with
the tobacco industry and what is now happening with the oil
industry»
Source: Futurism, SB1 Markets 48The growth in Electric Vehicle sales is not a straight line
Dependent on subsidies for many years. Sometimes those subsidies are cut back again, like in
China now (World’s by far largest EV market)
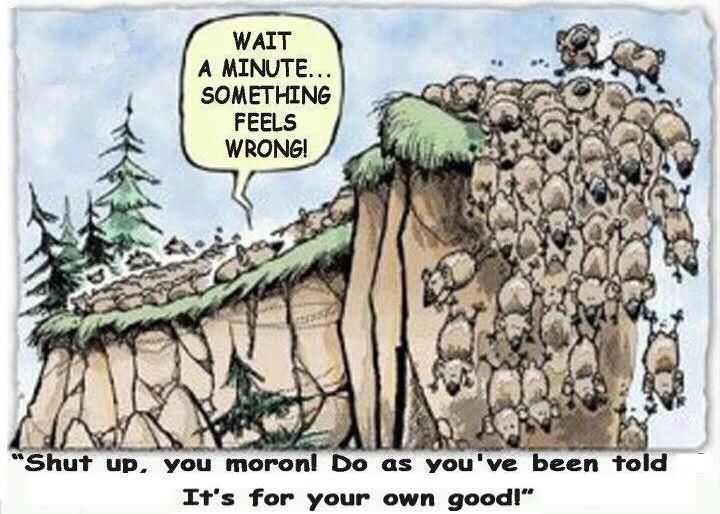
49‘Me too’ ESG investors may be heading for the cliff
‘Win-lose’ for some ESG investors
50Some ideas on how to maneuver in the Virtue space
Investment strategy suggestions for portfolio managers, corporate and PE
• Take advantage of high demand growth in Virtue sectors – buy companies with business
models that are hard to replicate
• Avoid ‘me too’ investments - competitive auctions and winner’s curse will lead to poor
profitability
• For corporates: Investments that have marginal profitability may prove profitable longer
term due to effect on corporate profile
• For corporates and PE: Carve out and spin off part og E - related activities, if any. Take
advantage of high willingness to invest in even early phase E-related activities, at high prices.
• For corporates: Report on key ESG platforms and get rating (Sustainalytics)?
51Disclaimer
SpareBank 1 Markets AS (“SB1 Markets”)
This report originates from SB1 Markets’ research department. SB1 Markets is a limited liability company subject to the supervision of The Financial Supervisory Authority of Norway (Finanstilsynet). SB1 Markets
complies with the standards issued by the Norwegian Securities Dealers Association (VPFF) and the Norwegian Society of Financial Analysts.
No investment recommendation
Any views and opinions relating to securities mentioned in this report should be interpreted as general market commentary, and not as investment recommendations within the meaning of section 3-10 of the
Norwegian Securities Trading Act.
No personal recommendation
The information contained in this publication is general and should not be construed as a personal recommendation within the meaning of the Norwegian Securities Trading Act, section 2-3 (4). It does not provide
individually tailored investment advice regarding a particular financial situation, investment experience, risk profile or preferences of the persons who may receive this report. For tailored investment advice
regarding stocks mentioned in this publication, please consult our brokerage desk or your individual investment advisor.
Research for the purposes of unbundling
This report constitutes research material for the purpose of the inducement rules under MiFID II.
Conflicts of interest
SB1 Markets, affiliates and staff may perform services for, solicit business from, hold long or short positions in, or otherwise be interested in the investments (including derivatives) in any stock mentioned in this
publication. To mitigate possible conflicts of interest and counter the abuse of confidential information and insider knowledge, SB1 Markets has set up effective information barriers between divisions in possession
of material, non-public information and other divisions of the firm. Our research team is well versed in the handling of confidential information and unpublished research material, contact with other divisions, and
restrictions on personal account dealing. The views expressed in this report accurately reflect the analyst’s personal views about the companies and the securities that are subject of the report, and no part of the
research analyst’s compensation is related to the specific views expressed in this report.
Accuracy of sources
All opinions and statements in this publication are, regardless of source, given in good faith, and may only be valid as of the stated date of this publication and may be subject to change without notice. SB1 Markets
has taken all reasonable steps to ensure that the information contained in this report is true and not misleading. Notwithstanding such efforts, we make no guarantee as to its accuracy or completeness.
Risk information
Return on investments is inherently exposed to risks. The value of an investment position may both rise and fall during the investment period. If the return on investments is positive at one time, there is no
guarantee that it will remain such in future. In certain cases, losses may exceed the sum of the original investment.
Limitation of liability
Any use of information contained in this report is at your own individual risk. SB1 Markets assumes no liability for any losses caused by relaying on the information contained in this report, including investment
decision taken on the basis of this report.
Limitation on distribution
This publication is not intended for, and must not be distributed to, individuals or entities in jurisdictions where such distribution is unlawful.
52APPENDIX 2
NOT FOR PUBLICATION
53Hvordan jobber fondsforvalterne med ESG?
Basert på presentasjoner fra DNB, Storebrand og KLP
Aktivitet Eksempler Mulig sluttresultat
Krav til rapportering Utslipp/kg produsert. Scope 3. Bedre informasjons- og
beslutningsgrunnlag
Standardsetting Best practise utslipp Krav til utslipp
Aktivt eierskap Stemmegiving, valgkomite, dialog Selskap endrer atferd, bytt
med selskapene styre om de ikke vil høre
Investorsamarbeid Carbon 100+ (40% av global AUM). Endret atferd eller
Best effekt når lokale og store eiere rapportering
Eksklusjoner Utelukk selskaper og bransjer som Eksklusjonslister a la NBIM.
ikke imøtegår minimumskriterier. No-carbon indeksfond
ESG integrering Samarbeid dedikert ESG analytiker og Lavere multipler for lav-ESG
fondsforvalter. selskaper pga. fremtidige
reguleringer
Tematiske Invester i selskaper som jobber aktivt Storebrand Global ESG, ESG+,
investeringer for en bedre verden Global Solutions
54Source: SB1 Markets. 55
• Nov 19: For finansiell institusjoner i EU skal det bli helt stopp på alle investeringer i kull i
  løpet av 10 år.
• As part of the European Green Deal, the Commission will start work immediately on a carbon
  border tax on polluting foreign firms in an effort to shelter EU businesses striving to become
  environmentally friendly.
• Von der Leyen has said the new tax will comply with World Trade Organization rules and start
  on a “number of selected industries.” In October, steel giant ArcelorMittal Europe came out
  in favor of a carbon border tax, calling it “effective and fair.”
• She will also reform the EU’s emissions trading system, which taxes polluting industries, and
  will work to include the maritime and aviation sectors as well as the traffic and construction
  sectors.
Oil demand, long term estimates

                        DNV GL

 IEA, DNV, Shale graf             57
Shale oil cannot supply all the oil we need – no growth from 2025
And all relevant research points to slower growth starting today
Mer om Shale 58Er egentlig renewables allerede en svær industri?
Investeringsnivå innenfor fornybar energi
• «Renewable Energy investment in 2018 hit USD 288.9 bn»
» 11% down vs. 2017 (Driven in part by falling solar costs)
» Investment in Europe rose 39% to USD 61.2 bn
» Does not include hydropower above 50MW (USD 16bn)
» Solar: USD 139.7bn
» Wind: USD 134.1bn
» Biomass and waste-to-energy: USD 8.7bn (54% incr. YoY)
• China led investments worldwide at USD 91.2bn (7th consecutive year) 37% down from 2017
• Both Europe and US up YoY
Source: https://www.unenvironment.org/news-and-stories/press-release/renewable-energy-
investment-2018-hit-usd-2889-billion-far-exceeding
• Sammenlignet med oljesektoren:
» IEA: USD 477bn upstream oil & gas supply investments 2018
» IEA: USD 249bn downstream, midstream and refining (oil & gas supply investments)
» Renewables IEA:
▪ Renewable power: USD 304bn
▪ Networks: USD 293bn
Source: https://www.iea.org/wei2019/
59• Virtue: Based on OSEBX companies with a strong ESG profile SSO (solar), NEL (Hydrogen), TOM (recycling), SSHIP (waste treatment), PCELL (Hydrogen), Orsted (Wind), Eolus (Wind), Vestas (Wind) Vice: Based on largest pure play companies, in or close to Norway: Niche banks: NOFI and KOMP – Tobacco: S&P 500 Tobacco Betting: Kindred, Betsson and Las Vegas Sands - Coal: Yancoal and Whitehaven - Porn: RCI Hospitality – Alcohol: Arcus – Nuclear weapons: BWX Technologies Source: SB1 Markets. 60
61
Til 1990 men rebasert til 2000

                                  Rebasert til 29000

Source: Bloomberg, SB1 Markets.                                    62
63
Source: Macrobond, OSE, SB1 Markets. 64
Share price

    The trend is not particularly strong in Norway

    Source: Macrobond, OSE, SB1 Markets.             65
You can also read