Commercial property prices: What should be measured?
←
→
Page content transcription
If your browser does not render page correctly, please read the page content below
Commercial property prices:
                         What should be measured?
                           Sebastian Keiler1, Deutsche Bundesbank

1     Introduction and motivation

The real estate sector plays an important role for the real economy, the financial system,
financial stability and not least the monetary transmission process. However, unlike the
case of residential property, official data on commercial property markets is hardly avail-
able. This asset class is usually defined through the intention to generate profit from its
possession. The focus is thus more investment-oriented than in the case of owner-
occupied residential property. Commercial objects are frequently categorised by their
main forms of usage. Common clusters include: office property, retail property, industrial
property and – if held for commercial purposes – residential property. Roughly 34% of all
fixed assets of German non-financial corporations were classified as real estate in 2010
(Deutsche Bundesbank 2012). Naturally, commercial property often serves as collateral;
around 50% of all loans in Germany are secured by mortgages.2 According to Bul-
wienGesa AG, a German real estate consulting firm, total market value of commercial
property excluding residential property held by investors accounted for over €2.2 trillion in
2011 – almost the same size as the economy’s activity in terms of gross domestic product
at current prices. The largest share is represented by industrial real estate amounting to
€1.1 trillion. Retail and office properties correspond to another roughly 50% of total com-
mercial property value.

The IMF included commercial property prices in its Financial Soundness Indicator set
(IMF 2006). In spite of this, due to limited data availability and methodological difficulties,
official indicators on commercial property have hardly been published yet. The IMF and
the Financial Stability Board brought up this issue again in their report on the financial
crisis and information gaps to the G-20 finance ministers and central bank governors and
recommended the collection of price indicators on commercial property (FSB 2009). As
one result, an international conference on commercial property price indicators was jointly
organised by the BIS, the ECB, Eurostat, the IMF and the OECD in June 2012 (ECB
2012). Eurostat envisaged the compilation of a “Handbook on Commercial Property Price
Indicators” with the intention of defining the methodological framework for reconciling the
efforts towards an indicator set at an international level, in order to eventually bridge the
data gap.

1   This paper represents the author’s personal opinions and does not necessarily reflect the views
    of the Deutsche Bundesbank or its staff. The author would like to thank Jens Mehrhoff for valu-
    able comments. All remaining errors are, of course, the author's sole responsibility.
2   The ratio is calculated as mortgage loans by banks in Germany to domestic non-financial enter-
    prises and households over total lending.

[What should be measured.docx]                                                         Page 1 of 14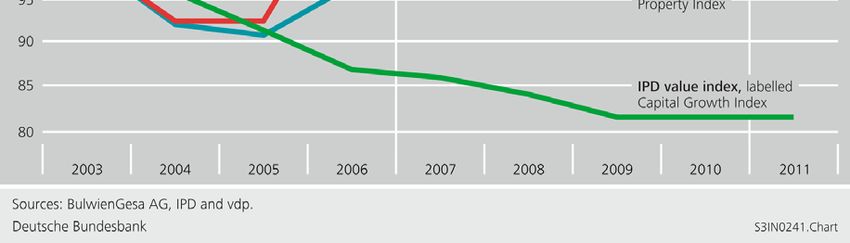
This paper argues that, despite the quest for swiftly disseminated indicators, it is of utmost
importance to set up a valid and reliable methodological framework first. The various data
users make substantially different demands on the index concepts. These, in turn, need to
be tailored for the distinctive purposes. In what follows, different approaches to the meas-
urement of commercial property prices are presented. Furthermore, the paper seeks to
work out a stylised framework for assessing performance-based measures in comparison
to price measures. Available price indicators for Germany are discussed and classified
according to statistical criteria in a separate section. The analysis then turns to gauging
the distortion that arises from treating performance based measures as price measures.
Selected data uses are briefly reviewed thereafter. The final section concludes and out-
lines the challenges ahead.

2    Measurement aims

A (commercial) property is a bundle of goods. To determine its value, one can take differ-
ent vantage points (Rosen 1974). From a producer’s perspective, the property value is
driven by the costs of purchasing the land and building the structure on that lot. From a
purchaser’s view, the value of a property is the sum of his willingness to pay for each
component, i.e. the land and the structure. From a commercial bank’s view, properties are
valued as collateral in order to reduce credit risk. Various professions and stakeholders
observe real estate. The perspectives vary and, therefore, property price indices need to
be tailored to the needs of data users. First, however, it is necessary to analyse the com-
position of real estate prices and possible indices derived from a land-structure split and
the decomposition of values into price and volume components.

2.1 Land-structure split

At the beginning we concentrate on two main components of any (commercial) real es-
tate. A developed property’s value is determined by the cost of the land and the cost of
the structure – the building itself. For example, for the purpose of National Accounts, land
values are commonly excluded since land does not represent a produced asset (Lequiller
and Blades 2006). Hence, a land-structure split as in Equation (1) is applied.

Property value = Land value + Structure value                                              (1)

Values of land and structures are driven by various factors and types of use. To begin
with, indicators based on the value of land are largely governed by location characteris-
tics. A specific lot obtains its value from various determinants such as the proximity to the
city centre, the economic structure of the surrounding area or its shape and size (Özdilek
2011). In comparison, the value of the structure is defined by the costs of producing the
characteristics such as office and retail space, technical facilities or logistic areas.

[What should be measured.docx]                                                   Page 2 of 14
However, both components are rather difficult to separate in practice. The value of com-
mercial property is determined by the (expected) income stream, i.e. the sum of the dis-
counted cash flow of the rents. Should this approach be applied to the structure value one
ignores that rents, too, are driven by location. Hence, a structure value thus determined
will also be influenced by land-specific characteristics. The issue of whether or not the
land value should be part of an index has also been addressed for owner-occupied hous-
ing as well (Eurostat 2011a).

In order to answer the question for the measurement aim, “what should be measured?”,
and to categorise available information on commercial property into a statistical frame-
work, it is not sufficient to differentiate between the land and the structure value. In fact, it
is necessary to reconsider implications from index theory for discriminating sharply be-
tween the value, the price, the volume and the quantity of commercial property.

2.2 Components of an index

The market value provides a nominal measure for commercial property. In what follows,
values might refer to those of structure and land, respectively, or both, i.e. the whole
property. If quantities (floor space or lot size in square metres, say) are available, dividing
the value in euro by that quantity yields a so-called unit value in euro per square metre.
Thus, the value can be split up as follows:

Value = Unit value × Quantity.                                                                    (2a)

However, the unit value in Equation (2a) depends on the quality of the building and not
just on floor space, or the location of the lot and not only its size. Since price indices aim
for a quality-adjusted indicator prices here denote a constant quality numéraire.3 As will be
discussed at great length in the next section, it is possible to decompose the value into a
constant-quality price and a volume measure that inherits quality changes:4

Value = Price × Volume.                                                                           (2b)

Therefore, an index for property prices in its pure form will reflect movements in prices
that are stripped of quality changes. The latter are included in the volume as shown in
Equation (2b). Eventually, the ultimate statistical goal is splitting up the value into a qual-

3   Valuers, however, have a different notation of the terms used in official statistics. The Royal
    Institution of Chartered Surveyors, for example, makes the following distinction between values
    and prices (RICS 1997): Where the value indicates an estimate of the obtainable price in the
    event of a transaction, the price reflects the actually observed amount of money at the time of
    the transaction.
4   At a given point in time, constant quality means some sort of average quality at a building level.
    For intertemporal price comparisons, this means that the quality of a particular building is held
    constant.

[What should be measured.docx]                                                           Page 3 of 14
ity-adjusted price, the quality component itself and a quantity measure independent of
quality.
Volume
Value = Price × Quality × Quantity (2c)
Unit Value
Following Equation (2c), the value is obtained via multiplying the constant-quality price of
a unit by a dimensionless mark-up (or mark-down) for the desired level of quality and the
nominal quantity of the structure or the land. This mark-up can reflect characteristics such
as the age of the building or its year of construction.
2.3 Aggregation of values and prices
So far the basic components of a specific property’s value (land and structure on the one
hand – price, quality and quantity on the other) have been introduced. The next step to-
wards the compilation of an index is the aggregation of values and their (price) compo-
nents. The first half of this process is described in Equation (3). For each time period t, the
summation runs over the distinct properties i.
i I
Valueti iI Priceti Quality ti Quantity ti (3)
This sum can be calculated over two different populations, denoted by the index set I in
the equation. Firstly, this is the building stock, i.e. all commercial properties in an economy
are at the centre of interest. Secondly, building flows, i.e. transactions of newly built, or
used and transferred commercial property, may be relevant for market analysis. The dis-
tinction between the two is essential. While flows tend to better depict market activity and
movements, stock-based figures reflect the endowment of the economy with commercial
property. In a stringent system of accounting the nominal stock at the beginning of the
period plus the net flow in this period yield the stock at the beginning of the subsequent
period. In order to obtain such equality, gross flows need to be adjusted for depreciation
or demolition of buildings, and for appreciation, i.e. renovations.
Then again, changes in nominal values of either the stock or flows are not the same as
changes in real terms. The difference is the price component – the second half of the ag-
gregation process. Yet, the construction of the price index at the aggregate level from in-
dividual data depends on its use. A Paasche-type price index will be the appropriate
measure for deflating value aggregates yielding Laspeyres-type volume measure, e.g. in
National Accounts in Europe (in the framework of chain indices). In spite of this, a
Laspeyres-type price index, as displayed in Equation (4), is more appropriate for analys-
[What should be measured.docx] Page 4 of 14ing “pure” price developments (European Commission 1995). Therefore, and in line with
other statistical price indices, a CPPI should adequately follow this method.
P L iI pti / p0i w 0i , i I
w 0i 1 (4)
The choice of what should be used for weighting price information (the w’s) has to be
governed by the actual application of the index. Transactions at market values can serve
as weights for a price index based on flows in order to reflect market movements across
regions, say. Transaction-weighted indices place a higher weight on more liquid markets.
Weights derived from economic activity such as regional income or output figures can
step in if information on transactions is not provided in sufficient detail. In contrast, for
price indices relating to the building stock weights linked to the nominal stock or the num-
ber of enterprises (in absence of precise data on the stock) will generally be more appro-
priate.
The observation of values and prices generally yields different results. The change in
market values between two consecutive periods does not necessarily reflect the pure, i.e.
quality-adjusted, change in prices. It is rather a mixtum compositum of quality changes
due to depreciation and renovation as well as the quality-adjusted change in prices; if
quantities remain the same. Let, for example, the population be equal in the two periods
under consideration. Due to depreciation the quality of all buildings will be lower on aver-
age. Ceteris paribus, it follows that in such a situation values decrease although quality-
adjusted prices have remained constant. The concepts developed in this section are
summarised in Table 1 (in the subsequent section).
2.4 Performance measures
Investment performance indicators serve the specific purpose to provide a benchmark for
investors and fund managers for commercial property investment portfolios. This is a very
different purpose than measuring the price changes of commercial property. In order to
clarify terminology and concepts this paper now turns to a definition of the key figures at
hand. The treatment here closely follows Investment Property Database (2011).
Departing from a real estate portfolio the capital growth (CG) between two periods is de-
fined as:
Vt Vt 1 Receiptst Expendituret
CGt , (5)
Vt 1 Expendituret
where Vt represents the portfolio value at time t. It is therefore the change in values plus
the sum of capital receipts from sales minus capital expenditures (e.g. for new objects)
[What should be measured.docx] Page 5 of 14divided by the capital employed (calculated as the value of the portfolio in period t-1 and
capital expenditure in period t).
The income return at a given period in time equals the net income, It, divided by the port-
folio value at time t-1 (again corrected for capital expenditure in period t).
It
IRt (6)
Vt 1 Expendituret
The total return (TR) is the sum of the two components:
TRt CGt IRt . (7)
The ongoing discussion on commercial property price indicators has brought to light that
different actors in the market have preferences regarding the measurement aim that poles
apart. While a substantial share of faction is in line with the well-reasoned tradition of offi-
cial statistics to measure pure price changes, another part of the interest group has sug-
gested performance indicators being most suitable for tracking the phenomenon at hand.
However, it appears that the pros and cons are not fully understood yet. Table 1 summa-
rises the measures outlined and provides uses for the distinctive concept.
Table 1: Different aggregates and the respective uses
Measurement aim Aggregate type Use for the concept
Transaction-based Nominal wealth traded on the market
Value
Stock-based Nominal wealth in the whole economy
Pure price movements
Transaction-based
Deflation
Price
Pure price movements
Stock-based
Deflation
Transaction-based Real wealth traded on the market
Volume
Stock-based Real wealth in the whole economy
Transaction-based Number of transactions
Quantity
Stock-based Physical stock of the economy
Total Return Benchmarking of return on investments
Performance
Cash Flow Return Benchmarking of return on investments
[What should be measured.docx] Page 6 of 14Strictly speaking the two “worlds” of price and performance figures are mutually exclusive.
There is no such thing as performance in the realm of prices; vice versa, prices only very
indirectly or only partly influence measures such as total return. Notwithstanding, the next
section provides a simplified model which formally treats prices and performance indica-
tors in a single, unified framework. This will allow a better understanding of the links be-
tween the two indicators and, most particularly, the limitations of performance measure-
ment.
3 A stylised framework
In the eventual case of the absence of price indicators the legitimate question arises
whether these performance indicators might be regarded as a “second best” approach to
price measurement. Assume, for the sake of exposition, that no change occurs in the
“quantity” component of commercial property. This means that the same objects can be
observed over time. This implies that neither new buildings are constructed nor that old
objects are demolished. It should be noted that this by no means rules out the cases of
depreciation due to ageing or appreciation in the form of investments in the stock. This
setup establishes the basis for what follows.
Let Pt be the price of a given building at time t – stripped of any quality change – and let
prices evolve at the time-varying asset inflation rate πt:
Pt Pt 1 (1 t ).
(8)
On the other hand, capital values are influenced by quality change in addition to pure
price change. Hence, define the growth of the capital value Vt at time t as the difference
between price change and net depreciation. The rate dt mirrors depreciation net of appre-
ciation and, thus, its sign is not necessarily determined a priori:
Vt Vt 1 (1 t ) (1 dt ). (9)
In the long run, the capital consumption should be amortised. Accordingly, the cash flow
It at time t of an object is linked to its value at time t-1 via the income return rt:
It Vt 1 rt . (10)
It immediately follows that:
It
rt IRt . (11)
Vt 1
While it is obvious that the price index captures t, what information can be revealed from
performance measures? An index based on the growth of capital values (CG) gauges
[What should be measured.docx] Page 7 of 14Vt
CGt 1 (1 t ) (1 dt ) 1 t dt . (12)
Vt 1
Using capital values, therefore, introduces quality aspects that, in turn, may lead to a bi-
ased measure of pure price change.
The total return (TR) is frequently used to assess the performance of an investment. Since
it assumes the cash flows being reinvested, the total return is sum of the capital growth
(capital gains/losses corrected for expenditures and capital receipts) and the income re-
turn:
TRt CGt IRt (1 t ) (1 dt ) 1 rt t dt rt . (13)
Depending on the prevailing circumstances, the total return can overshoot or undershoot
the true price development. What makes it even worse is its architecture being a mixture
of three independent measures. This will render it very hard for economic analysts – who
are used to price indices – to understand. As the empirical section shows, the picture
drawn from prices and performance indicators can be fundamentally different. Eventually,
this will lead to the wrong conclusions being drawn for policy making. Given the im-
portance of the real estate sector for the economy and financial stability, the stakes at risk
are potentially high for experiments.
4 Sources
The conceptual approach provided in the previous sections is confronted in practice with
available data sources. Data on commercial real estate is rather sparse and hardly avail-
able for some property types such as industrial property. This section seeks to classify the
data provider’s approaches within the taxonomy derived in sections 2 and 3. A straight-
forward categorisation is not always feasible since methodology for some indices is not
disclosed and the terminology differs between official statistics and real estate profession-
als.
For Germany, three index providers publish data at a national level. BulwienGesa AG, a
German real estate consulting firm, builds upon various data sources such as media cov-
erage, valuers and brokers. A second index is provided by vdp, the association of German
mortgage banks. They compile indices from transaction data enclosed to credit applica-
tions. Investment Property Databank (IPD) delivers so-called performance indices from
data supplied to their data base by institutional investors. The index approaches differ
across the firms and the nomenclature used cannot be seamlessly integrated into the
concepts discussed in section 2.
[What should be measured.docx] Page 8 of 14To begin with, vdp provides an index with a hedonic quality adjustment which is labelled
as capital value index. In the terminology of official statistics, however, it could be treated
as a price index. BulwienGesa AG offers data on capital values from a stratified sample.
Therefore, this indicator can also be compared to a constant-quality price index. Unfortu-
nately, the weighting schemes are not fully disclosed and the weighting methodology can-
not be classified into a standard framework. IPD compiles the indicator in its current form
from their data base with a changing composition via chaining and no quality adjustment.
Sticking to the methodology developed above this resembles an index for values but it is
based on a changing composition of the sample. Table 2 summarises the three data pro-
viders along with the main attributes of the respective indices.
Table 2: Data providers in Germany and the characteristics of their aggregates
BulwienGesa AG vdp IPD
Provider’s label German Property Index Capital value index Capital Growth Index
Germany, roughly 40% Germany, roughly 14%
Coverage 125 cities
of market value of market value
Quality adjustment Stratification Hedonic None
Office, Office,
Office,
residential, residential,
Property types residential (upcoming),
industry, industry,
retail (upcoming)
retail retail
Weighted average over Unweighted average of
Aggregation Not applicablea)
regions sample
Frequency Annual Annual/quarterly Annual
Time series start 1991 2003/2008 1995
Timeliness t+15 days t+40 days t+90 days
Transparency Limited Higher Lower
Origin of data Various sourcesb) Transactions Valuations
Constant-quality price Constant-quality price Chained nominal value
Classification
index type index type index type
a) The indices are constructed from time dummies. This method does not rely on weighting
schemes and aggregation.
b) BulwienGesa AG uses various sources such as media coverage, market reports, valuers,
internet platforms and others.
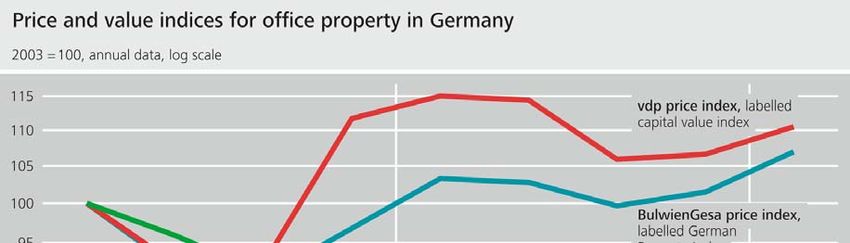
Thus, all three indices vary inter alia in market coverage and origin of data. Furthermore,
all providers construct their indices in a different way. In order to inspect the differences
between the index construction types further, Figure 1 depicts the three annual indices for
office properties. Regarding growth rates, the BulwienGesa AG price indicator and the vdp
time series show the same sign of change in almost every year over the whole 2003-2011
period. However, during 2006, for example, the BulwienGesa AG time series still shows
[What should be measured.docx] Page 9 of 14an upswing, while vdp figures flatten. Also the absolute magnitude of vdp growth rates
often exceeds those reported by BulwienGesa AG. The IPD index on a changing portfolio,
in comparison, shows a steady decline up to 2011. The diversity in operationalisation
complicates the comparison, particularly between IPD on the one hand and Bul-
wienGesa AG and vdp on the other. Price indices by BulwienGesa AG and vdp have an
inherently different interpretation than IPD’s value index. Due to depreciation without
renovation, nominal values from a constant sample are prone to show negative rates of
change on average. In contrast, price indices are not determined by age effects. This
mechanism may help exploring the patterns observed in the figure. Furthermore, the re-
sults emphasise the importance of index construction methodology.
A valuable source, though with less detailed data, is provided by the National Accounts.
National wealth accounts in Germany provide data on the nominal and real building stock
at replacement costs (Schmalwasser and Schidlowski 2006). By applying the perpetual
inventory method, the net stock at the beginning of the period is obtained as the sum of
the net stock from the beginning of the period before and the net fixed capital formation
during this period. National wealth accounts offer data on the gross and net stock of dwell-
ings and other buildings and structures. This source, therefore, does not allow a break-
down into types of usage. Aggregates include forms of usage such as undeveloped land
and property holders (e.g. the public sector) that may not be in the main focus of a CPPI.
5 Interpretation issues regarding the use of “total return” as a
price indicator
Section 3 has provided a formal treatment of performance based indicators. With this
framework at hand it is straightforward to analyse the components of the total return
[What should be measured.docx] Page 10 of 14based on the data illustrated in Section 4. The key ratios are presented in Table 3. Evi-
dently, the capital growth does not reflect pure price movements, since quality changes
(such as depreciation) are not excluded. As a consequence, the same holds for the total
return. In order to grasp the empirical magnitude of conceptual differences it is possible to
solve Equation 13 from Section 3 for the net depreciation rate dt – provided a measure for
the price movement is available. This yields:
TRt t rt
dt . (14)
1 t
The BulwienGesa price index offers a measure for π and enables to retrieve the left hand
side variable – displayed in Table 3 as well. From this calculation we infer that, on aver-
age, office buildings (including land) are depreciated at a net rate of 1.5 per cent a year.
After 50 years the object loses only a little more than 50% of its value based on this simply
derived depreciation rate. It should be noted that the calculation averages the depreciation
of the land (being in most cases 0% per definition) and the depreciation of the imposed
structure. Such a weighted average does not represent the actual depreciation rate from
accounting which refers to buildings only. For retail property, d almost doubles. Generally
speaking, retail property has shorter life spans and is therefore subject to higher write-offs.
Of course, a calculation based on this highly stylised mode will and must neglect several
aspects. Nevertheless, the results from these calculations emphasise the influence of de-
preciation on capital value based indices and of course – being a linear combination – the
total return. As the theoretical treatment already has shown, both, the total return as well
as the capital growth index are not capable to assess pure price movements. From depre-
ciation the capital growth is bound to underestimate asset inflation. For the total return, the
addition of cash flow returns causes it to overshoot true price developments. In sharp con-
trast, a price index allows for a direct judgement and reveals market movements stripped
of quality related influence.
Table 3: Key figures for IPD data and BulwienGesa price development in per cent (2001-
2011 average)
Variable Office Retail
1) –1.0 1.5
d 1.5 2.9
CG –2.4 –1.4
r 4.9 5.2
TR 2.4 3.7
1)
Derived from the BulwienGesa price index
[What should be measured.docx] Page 11 of 146 Selected data uses Data analysts eventually have to choose the most suitable aggregate by purpose of their research. Nominal aggregates – such as aggregated values – are probably best for com- parison with other figures in current prices. Nominal stock may best be compared to other economies at this level. Loan-to-value measures will be most appropriately calculated in nominal terms since loans are secured with buildings at market values. The nature of nominal values proposes the use of these figures for users such as banking supervisors. An economy’s real wealth development will be reflected with volume measures since these depict building values adjusted for price effects. Price developments are naturally reflected in the constant-quality price component. Indices constructed from this part will most probably be used by monetary transmission analysts. The challenge of separating fundamentally justified changes in prices from price bubbles is key for financial stability. 7 Conclusion It has become evident that different uses (e.g. monetary transmission analysis or banking supervision, National Accounts and Financial Accounts) require different concepts (unit value indices, nominal stocks, pure price indices). The question for the measurement aim matters greatly. Substantially different market movements are observed for Germany de- pending on whether prices or values are analysed (both are confusingly termed capital values by commercial data providers). Growth rates between 5% and 10% or declines of over 15% over an eight year period up to 2011 are currently being reported. In such a sur- rounding, statistics need to appropriately classify and describe existing indicators offered by real estate professionals. The detailed description of metadata enables data users to make informed choices on the most suitable indicator for the respective analysis. For international comparisons a stock-taking of existing sources and a classification ac- cording to common terms from index theory (price, unit value, value, volume) would be useful. Based on this inventory of indicators international aggregates can be calculated in the future. In conjunction with further information on statistical quality (coverage and the like) it might be possible to describe these indicators along with the relevant metadata. Testing the time series and comparing their features e.g. with macroeconomic develop- ments is indispensable. All in all, there is still a lot of hard work to do for statisticians in this field, but the way forward seems as promising as challenging. [What should be measured.docx] Page 12 of 14
8    References

Deutsche Bundesbank (2012) German enterprises’ profitability and financing in 2010,
Monthly Report, Vol. 64, No. 12, pp. 27-66.

European Central Bank (2012) Joint BIS - ECB - Eurostat - IMF - OECD international con-
ference      on       commercial        property      price      indicators,      URL:
http://www.ecb.europa.eu/events/conferences/html/20120511_cppi.en.html, retrieved on
25 June 2012.

European Commission (1996) European System of Accounts ESA 1995, Eurostat, Brus-
sels.

Eurostat (2011) Handbook on residential property price                     indices,   URL:
http://epp.eurostat.ec.europa.eu/portal/page/portal/hicp/methodology/
owner_occupied_housing_hpi/rppi_handbook, retrieved on 3 May 2012.

Eurostat (2011a) Draft technical manual on owner-occupied housing for Harmonised In-
dex of Consumer Prices, Version 1.9.1, Luxembourg.

Financial Stability Board (2009) The financial crisis and information gaps: Report to the G-
20 Finance Ministers and Central Bank Governors.

International Monetary Fund (2006) Financial Soundness Indicators: Compilation guide,
Washington.

Investment Property Database (2011) IPD Index Guide, 6th edition, London.

Jones Lang LaSalle (2012) Global transparency report, London, Chicago, Singapore.

Lequiller, F and Blades, D (2006) Understanding National Accounts, OECD, Paris.

Özdilek, Ü (2011) Seven major questions in the analysis of urban land values, American
Journal of Economics and Sociology, Vol. 70, No. 1, pp. 30-49.

Rosen, S (1974) Hedonic prices and implicit markets: Product differentiation in pure com-
petition, Journal of Political Economy, Vol. 82, No. 1, pp. 34-55.

Schmalwasser, O and Schidlowski, M (2006) Measuring capital stock in Germany,
Wirtschaft und Statistik, November Issue, Wiesbaden, pp. 1107-1123.

[What should be measured.docx]                                                Page 13 of 14
9    Annex I: Origin of data

IPD data
Voigtländer, M and Demary, M et al. (2010) Die Immobilienmärkte aus gesamtwirtschaftli-
cher Perspektive, edited by Deutscher Verband für Wohnungswesen, Städtebau und
Raumordnung e. V. and Gesellschaft für Immobilienforschung e. V., Berlin, Wiesbaden, p.
92.

Investment Property Databank (2010) IPD Germany annual Property Index: Results for
the year to 31st December 2009, IPD, London.

Investment Property Databank (2011) IPD Germany annual Property Index: Results for
the year to 31st December 2010, IPD, London.

BulwienGesa AG data
BulwienGesa AG (2011) RIWIS Online – Regional Property Market Information System,
URL: http://www.riwis.de/, retrieved on 15 May 2012.

vdp data
vdpResearch (2012) vdp Property price index, URL:
http://www.vdpresearch.de/iIDX/ZIPfiles/2012/Q1/20120515_Index_Q1_2012.xls,
retrieved on 15 May 2012.

[What should be measured.docx]                                            Page 14 of 14
You can also read