RESULTS FOR THE YEAR ENDED 28 FEBRUARY 2021 - Piet Mouton PSG Group CEO

Page created by Jimmie Coleman
 
CONTINUE READING
RESULTS FOR THE YEAR ENDED 28 FEBRUARY 2021 - Piet Mouton PSG Group CEO
RESULTS FOR THE YEAR ENDED
         28 FEBRUARY 2021
             Piet Mouton
            PSG Group CEO

1
RESULTS FOR THE YEAR ENDED 28 FEBRUARY 2021 - Piet Mouton PSG Group CEO
PSG Group – SOTP value
                                                                                            29 Feb 2020     28 Feb 2021    16 Apr 2021        1. PSG Alpha’s main investee companies have been presented
    Asset/(liability)                                                                                Rm              Rm             Rm           separately, with more information on each such investee’s
    PSG Konsult*                                                                                  6 399           7 282          7 995           valuation available on our website.
    Curro*                                                                                        2 604           3 588          4 051
                                                                                                                                              2. PSG Group was trading at a 31% discount to its SOTP value as
    Capitec*                                                                                     46 130           2 190          1 897
                                                                                                                                                 at 16 Apr 2021.
    Zeder*                                                                                        3 173           1 983          2 327
    PSG Alpha                                                                                     3 618           3 842          4 014        3. CGT has only been provided for on the retained Capitec
     CA&S**                                                                                       1 130           1 126          1 069           interest, with the remaining CGT exposure pursuant to the
     Evergreen^                                                                                     975             869            869           change in tax legislation pertaining to unbundling transactions
     Stadio*                                                                                        662             865          1 073           not deemed significant considering PSG Group’s current
     Energy Partners^                                                                               118             305            305           shareholding structure and the tax base cost of its listed
     Optimi^                                                                                        305             296            296           holdings.
     Other investments^                                                                             499             446            470
     Less: Minority shareholding held by PSG Alpha management                                       (71)            (65)           (68)                SHARE OF ASSETS - 16 APR 2021
    Dipeo^
    Other net assets                                                                                 879           2 020             2 385                                11%
     Cash^^                                                                                          187           1 646             1 886
     Pref investments and loans receivable^^                                                         542             733               749                                                35%
     Other^^ +                                                                                       150           (359)             (250)                       18%
    Total assets                                                                                  62 803         20 905             22 669
    Perpetual pref funding*                                                                       (1 463)        (1 132)            (1 186)                       10%
    Other debt^^                                                                                  (1 020)
    Total SOTP value                                                                              60 320         19 773             21 483                               8%        18%
    Shares in issue (net of treasury shares) (m)                                                   218.2          209.8              209.8      PSG Konsult   Curro   Capitec   Zeder   PSG Alpha   Other net assets
    SOTP value per share (R)                                                                      276.43          94.24             102.39
    Share price (R)                                                                               186.60          66.51              70.25

    * Listed on the Johannesburg Stock Exchange ** Listed on the Botswana Stock Exchange ^ Internal valuation ^^ Carrying value
    + The 28 Feb 2021 and 16 Apr 2021 balances include a capital gains tax provision in respect of the retained Capitec interest.

    Note: PSG Group's live SOTP containing further information is available at www.psggroup.co.za
2
     2
RESULTS FOR THE YEAR ENDED 28 FEBRUARY 2021 - Piet Mouton PSG Group CEO
TODAY

    Operating environment                      PSG Group                  Investee companies

•       Covid-19                      • Smaller following Capitec      • Significant effort to change the
•       Weak economy                    unbundling                       way in which they operated
•       Political uncertainty         • Continues to trade at a        • Most companies performed
•       Eskom                           significant discount to SOTP     admirably all things
•       Unreliable service delivery   • Investment holding company       considered
•       Ageing infrastructure           relevance?                     • All investees are well
•       Corruption                                                       capitalized and focused on
•       Mounting red tap                                                 growth

                                           Opportunity?
    3
RESULTS FOR THE YEAR ENDED 28 FEBRUARY 2021 - Piet Mouton PSG Group CEO
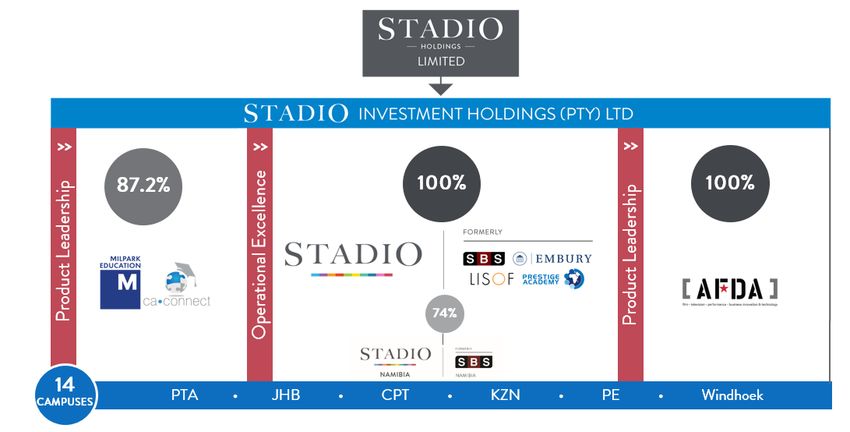
PSG Group’s objective remains unchanged:
     “To create wealth for shareholders on a per share basis”

    Grow the underlying
                                                  Pay dividends
        businesses            Sell/unbundle
                            investments when
                                opportune
                                     +
                          Other value-enhancing
                                techniques

4
RESULTS FOR THE YEAR ENDED 28 FEBRUARY 2021 - Piet Mouton PSG Group CEO
KEY TRANSACTIONS/EVENTS

•       Capitec unbundling
        - Significant theoretical value unlock of R59 per PSG Group share or R12.9bn based on PSG Group’s Feb 2020 SOTP value

•       Sold 3.3m Capitec shares at an average price of R1,061 per share during FY21

•       Settled all remaining term debt comprising redeemable prefs of R1bn

•       Zeder
        - Sold Pioneer Foods (R6.4bn) and Quantum Foods (R308m)
        - Settled all debt obligations (R1.5bn)
        - Paid special dividend (R3.9bn) and about to pay a further 20cps (R307m)
        - Repurchased Zeder shares (R426m)

•       R459m of PSG Group shares repurchased at an average price of R54.73 per share

•       Curro concluded a significant rights issue (R1.5bn)
        - Curro shares in issue increased by ~45%
        - PSG Group invested R1.05bn at R8.07 per share whereby its stake increased by ~5% to ~60%
        - Cobus Loubser (CEO Moresport, previously CFO) appointed as Curro CFO

•       Change in status to that of an Investment Entity
        - Performance of all investees based on fair value – valuation methodologies for unlisted investments
          have become very important
    5
RESULTS FOR THE YEAR ENDED 28 FEBRUARY 2021 - Piet Mouton PSG Group CEO
TOUGH OPERATING ENVIRONMENT

                                                                                                                                                                Annual GDP Growth                                                                                                                                                                                                                             o   The economy has shrunk to a level last
                                                                                                                                                                             5%                                                                                                                                                                                                                                   seen in 2013!
    8.0%
                                                                                            3.6%                                                                                                                                                                                                                                                                                                              o   Do our political leaders have the will
                                                                                                                                                                                                                                                                                2.3%
    6.0%                                                                                                                                                                                                                                                                                                                                                                                                          to do what is needed to pull this
                                                                                                                                                                                                                                                                                                                                                          0.7%                                                    country in the right direction?
    4.0%
                                                                                                                                                                                                                                                                                                                                                                                                              o   Covid-induced lockdowns and
                                                                                                                                                                                                                                                                                                                                                                                                                  restrictions remain a major issue to
    2.0%
                                                                                                                                                                                                                                                                                                                                                                                                                  economic recovery – a different
    0.0%                                                                                                                                                                                                                                                                                                                                                                                                          approach is required
                                                                                                                                                                                                                                                                                                                                                                                                              o   It is clear that the operating
 -2.0%
                                                                                                                                                                                                                                                                                                                                                                                                                  environment has been very tough
                                                                                                                                                                                                                                                                                                                                                                                                                  since the Global Financial Crisis – with
 -4.0%
                                                                                                                                                                                                                                                                                                                                                                                                                  the last 5 years having been extremely
 -6.0%                                                                                                                                                                                                                                                                                                                                                                                                            challenging to build businesses in SA

 -8.0%
                                                                                                                                                                                                                                                                                                                                                                                                       (7%)
                    Jul-96

                                                                                                              May-02

                                                                                                                                                                                                                          May-09
                             Feb-97
                                      Sep-97

                                                                                            Mar-01

                                                                                                                                Jul-03
                                                                                                                                         Feb-04
                                                                                                                                                  Sep-04

                                                                                                                                                                                                        Mar-08

                                                                                                                                                                                                                                            Jul-10
                                                                                                                                                                                                                                                     Feb-11

                                                                                                                                                                                                                                                                                                                                      May-16
                                                                                                                                                                                                                                                              Sep-11

                                                                                                                                                                                                                                                                                                                    Mar-15

                                                                                                                                                                                                                                                                                                                                                        Jul-17
                                                                                                                                                                                                                                                                                                                                                                 Feb-18
                                                                                                                                                                                                                                                                                                                                                                          Sep-18
                                                                 Jun-99

                                                                                                                                                                             Jun-06

                                                                                                                                                                                                                                                                                         Jun-13

                                                                                                                                                                                                                                                                                                                                                                                                     Jun-20
                                               Apr-98

                                                                                                                                                           Apr-05

                                                                                                                                                                                                                                                                       Apr-12

                                                                                                                                                                                                                                                                                                                                                                                   Apr-19
           Dec-95

                                                        Nov-98

                                                                                   Aug-00

                                                                                                                       Dec-02

                                                                                                                                                                    Nov-05

                                                                                                                                                                                      Jan-07
                                                                                                                                                                                               Aug-07

                                                                                                                                                                                                                                   Dec-09

                                                                                                                                                                                                                                                                                Nov-12

                                                                                                                                                                                                                                                                                                           Aug-14

                                                                                                                                                                                                                                                                                                                                               Dec-16

                                                                                                                                                                                                                                                                                                                                                                                            Nov-19
                                                                          Jan-00

                                                                                                                                                                                                                                                                                                  Jan-14
                                                                                                     Oct-01

                                                                                                                                                                                                                 Oct-08

                                                                                                                                                                                                                                                                                                                             Oct-15
     Source: Statistics South Africa and Bloomberg

6
PSG Group share price vs SOTP value per share
                             PSG Group share price vs SOTP value per share
    350                              (29 Feb 2016 - 16 Apr 2021)
                                                                                                                  Discount
    300

    250                                                                                             Latest discount ~31%
    200                                                                                             12-month average discount ~34%
    150
                                                                                                            Liquidity (per annum)
    100                                                                                   102.39
                                                                                                    28 Feb 2021              126%
     50                                                                                   70.25
                                                                                                    29 Feb 2020               49%
     -                                                                                              28 Feb 2019               47%
         Feb-16   Feb-17          Feb-18            Feb-19             Feb-20    Feb-21             28 Feb 2018               69%
                                   SOTP value (R)    Share price (R)
                                                                                                    28 Feb 2017               30%
                                                                                                    29 Feb 2016               50%
                     PSG Group premium/(discount) to the SOTP value (%)
                                 (29 Feb 2016 - 16 Apr 2021)
 10%

    0%

(10%)

(20%)

(30%)                                                                                       (31%)

(40%)

(50%)
7   Feb-16        Feb-17          Feb-18            Feb-19              Feb-20    Feb-21
Why are holding companies trading at such material discounts?

Permanent capital:
     •   PSG Group’s strategy has always been to create shareholder wealth
         -   We are not and have never been focused on the size of our group, but rather on per share wealth creation
     •   PSG Group is a long-term investor – not a permanent investor

Fee/cost structures:
     •   PSG Group management does not charge a fee to manage its underlying assets
     •   Our head office costs to manage PSG Group and PSG Alpha’s investments (post Capitec unbundling):
         -   Relative to SOTP ~0.36%
         -   Relative to Market Capitalisation ~0.51%

Poor investment decisions by holding companies:
     •   Capitec was an exceptional investment
     •   By and large our investment portfolio (excluding Capitec) also outperformed the JSE All Share Index having delivered ~15%
         per annum since Feb 2010

Too many listed entry points:
     •   This is a legacy issue and will be very difficult to address in the short term

 8
Why are holding companies trading at such material discounts?
Change in tax legislation pertaining to unbundlings:
     •   Most investment holding companies used to argue that it was not necessary to raise a CGT liability as one could unbundle assets on
         a tax-neutral basis:
         -    On the proviso that the investment being unbundled needs to be listed
         -    It remains difficult to determine the CGT liability (if any) as it is dependent on the unbundling company’s shareholding on the
              date of unbundling – currently, only the PIC’s shareholding creates a potential issue for PSG Group

The tax trap:
                                                 R
Capital invested                                100.00
Investment via holding company
Growth                                  50.0%    50.00
Less : CGT                              22.4%   (11.20)
Sub-total                                        38.80           •   Obviously a very simplistic way of looking
Less : DWT                              20.0%     (7.76)             at the issue
Growth (net of CGT and DWT)                      31.04           •   Ignores the value-add provided by
Investment in own name                                               investment holding companies
Growth                                           50.00
Less : CGT                              18.0%     (9.00)
Growth (net of CGT)                              41.00
Improvement when invested in own name            32.1%

 9
PSG FINANCIAL SERVICES (“PSL”)
PERPETUAL PREFERENCE SHARES
        (“PSL PREFS”)
HISTORY OF PERPETUAL PREFS
                                                                                                                                                                                       1. From the outset, most of the
                                                                                                                                                                                          listed perpetual prefs were trading
                 1
120                                                                                                                                                                                       at or above the R100 nominal
                                 2                                                                                                                                                        value (or equivalent) per share
100                                                                                                                                                                                         - To some extent the market
                                                                                                                                            4                               5                  might have misunderstood
                                                                                                                                                                                               the product - viewing it as
 80
                                                                                  3                                                                                                            more of an equity than a debt
                                                                                                                                                                                               instrument
 60
                                                                                                                                                                                       2. The Global Financial Crisis brought
                                                                                                                                                                                          new insight and investors realised
 40                                                                                                                                                                                       there was potential risk (credit,
                                                                                                                                                                                          market, etc.) in perpetual prefs
 20

  0
     Nov/04 Nov/05 Nov/06 Nov/07 Nov/08 Nov/09 Nov/10 Nov/11 Nov/12 Nov/13 Nov/14 Nov/15 Nov/16 Nov/17 Nov/18 Nov/19 Nov/20

                                                                                    Average*            PSG

      * The average is based on the listed perpetual prefs of ABSA, FirstRand, Standard Bank, PSL, Invicta, Netcare, Sasfin and Discovery. The analysis is based on dirty pricing or
      actual pricing and thus the share prices would increase over time as dividends accumulate at the respective Prime-linked dividend rates and decrease once a dividend is
      declared and the share commences trading ex-dividend (for this analysis it is immaterial).

      For comparative purposes all the prefs were rebased to a nominal value of R100 per share, with ABSA being the only pref requiring adjustment as it has a nominal value of
11    R1,000 per share. The R100 (or equivalent) is relevant as it is the value on which the pref dividend amount is calculated.
HISTORY OF PERPETUAL PREFS

                 1
120
                                 2                                                                                                                                                     3. With effect from 1 Apr 2012, the tax
                                                                                                                                                                                          legislation changed from STC (10%)
100
                                                                                                                                            4                               5
                                                                                                                                                                                          to dividend withholding tax (“DWT”)
                                                                                                                                                                                          (15%)
 80
                                                                                  3                                                                                                    4. On 22 Feb 2017, DWT increased from
                                                                                                                                                                                          15% to 20%
 60                                                                                                                                                                                    5. Covid-19 caused a ~20% decline in
                                                                                                                                                                                          most perpetual pref prices
 40

 20

  0
     Nov/04 Nov/05 Nov/06 Nov/07 Nov/08 Nov/09 Nov/10 Nov/11 Nov/12 Nov/13 Nov/14 Nov/15 Nov/16 Nov/17 Nov/18 Nov/19 Nov/20

                                                                                    Average*            PSG

      * The average is based on the listed perpetual prefs of ABSA, FirstRand, Standard Bank, PSL, Invicta, Netcare, Sasfin and Discovery. The analysis is based on dirty pricing or
      actual pricing and thus the share prices would increase over time as dividends accumulate at the respective Prime-linked dividend rates and decrease once a dividend is
      declared and the share commences trading ex-dividend (for this analysis it is immaterial).

      For comparative purposes all the prefs were rebased to a nominal value of R100 per share, with ABSA being the only pref requiring adjustment as it has a nominal value of
12    R1,000 per share. The R100 (or equivalent) is relevant as it is the value on which the pref dividend amount is calculated.
EFFECT OF THE CHANGE IN TAX LEGISLATION

                                                              DWT
                                                STC         15%            20%    Difference
Nominal value (R/share)                      100.00      100.00         100.00
PSL pref dividend rate                         75%       83.33%         83.33%
Prime interest rate (assumed)                  10%          10%            10%
Dividend (R/share)                             7.50         8.33           8.33
DWT rate                                                    15%           20%
Effective dividend (net of DWT) (R/share)                   7.08          6.67
Price to be in the same position (R/share)   100.00        94.44         88.89        11.11

• The effect of the change in tax legislation from STC (a 10% tax on the company declaring
  a dividend) to DWT has been very negative for holders of perpetual prefs
• Initially most of the issuers gave the perpetual pref shareholders the tax saving relief, i.e.
  the 10% STC saving for the company. For instance, the PSL pref dividend rate of 75% of
  Prime was increased to 83.33% of Prime
• Ignoring the perceived credit rating of perpetual prefs, holders of perpetual prefs are
  worse off by 11%

13
ARE PERPETUAL PREFS (“PPS”) DEBT OR EQUITY FROM THE HOLDER’S PERSPECTIVE?

• Initially when PPS were issued many holders might have viewed the product as equity with a
  higher dividend payout ratio
• With the Global Financial Crisis, the market started to understand the product better and the
  prices dropped significantly, thereby increasing the yield. The market now understands that PPS
  rank behind senior debt, but ahead of equity. PPS holders are also not totally in control of the
  level of gearing which a company can introduce over and above the gearing pertaining to the
  PPS – which could add additional risk
• The reality is that the product is more like sub-debt/mezzanine debt and as a result, PPS simply
  provide a higher return

14
ARE PPS DEBT OR EQUITY FROM THE ISSUER’S PERSPECTIVE?

• One can argue it several ways, but ultimately it is sub-debt/mezzanine debt
• There is merely one advantage – if the company has a very bad year with severe cashflow
  constraints, it does not automatically put the company into default if it is unable to service the
  PPS dividend. This is a significant advantage, but only if the PPS issuer is very aggressively
  geared (including the PPS)
• PPS still rank ahead of equity on liquidation
• Any senior debt provider will look at the serviceability of such debt when granting funding. In
  other words, the debt provider will take the payment obligations in respect of the PPS into
  consideration when they provide senior debt

15
YIELDS AND RECENT MARKET PERFORMANCE
HISTORICAL GROSS YIELDS OF SELECT PEER PREFS LISTED ON THE JSE vs PSL PREFS
     12.0%

     10.0%
                                                                                                                                             9.5%                          PSL’s historical yield is in line with the
      8.0%                                                                                                                                                                 average yield of other listed perpetual
                                                                                                                                                                    #
                                                                                                                                                                                             prefs
      6.0%                                                                                                                                                 11.7%
                                                                                              10.2%                10.4%                10.5%
                                                          8.8%              9.3%
      4.0%          8.4%              8.4%

      2.0%
                                                                                                                                                                           If the PSL prefs are repurchased at R81
                                                                                                                                                                             per share, the PSL pref shareholders
      0.0%                                                                                                                                                                 can enhance their yield from the 9.3%
               FIRSTRAND LTD       ABSA BANK       STANDARD BANK      PSG FINANCIAL        DISCOVERY           GRINDROD                INVESTEC       Potential yield on
                                                                        SERVICES           HOLDINGS                                                    new investment          currently achieved to c. 11.7%, by
                     Note – the above analysis has                            Average of the peers
                                                                                                                                                                                   reinvesting in other prefs
                    been based on dirty share prices
                                                                                                           # - (R81 x assumed average 9.5% yield) / R65.88 = 11.7%

RELATIVE DIRTY SHARE PRICE PERFORMANCE OF THE SELECT PEER PREFS vs PSL PREFS SINCE 1 JAN 2020
          Company              FIRSTRAND       ABSA BANK         STANDARD         PSG          DISCOVERY        GRINDROD           INVESTEC         Avg excluding
                                   LTD                             BANK        FINANCIAL       HOLDINGS                                                  PSL
                                                                                SERVICES
                                                                                                                                                                               PSL’s relative pref share price
Share price - 8 April 2021     R      66.55    R       615.00    R   69.00     R      66.50    R       77.00   R           66.80   R       63.50
                                                                                                                                                                           performance since 1 Jan 2020 is in line
Share price change since
1 January 2020
                                       -22%              -17%         -22%             -20%             -19%                -15%            -20%             -19%           with the average of the select peers

          Investec announced on 17 Feb 2021 that it had repurchased 3.43% of its issued pref share capital in terms of a general authority
              to repurchase. No other recent SENS announcements were noted regarding the repurchase of prefs by the select peers.

16
PROPOSED REPURCHASE AND DELISTING OF PSL PREFS THROUGH A SCHEME OF
ARRANGEMENT

Offer Price:
•    A clean offer price per PSL pref share of R81 (i.e. excl. any accrued pref dividend), payable in cash
•    Represents a premium of ~23% to the clean price of R65.88 on 8 Apr 2021
•    Irrevocables and letters of support representing ~40% of the PSL prefs in issue have already been obtained from PSL pref
     shareholders in support of the repurchase
Rationale:
•    The group has surplus cash available
•    The underlying businesses are well capitalized
•    Share price of the PSL prefs not likely to increase from current levels for the foreseeable future
•    This creates an opportunity for PSL pref shareholders to enhance their returns by reinvesting the cash received at a premium
     pursuant to the scheme of arrangement into other perpetual prefs with potentially better liquidity and credit ratings, should
     they wish to

17
Recurring headline earnings per share decreased by 24%

Covid-19 had a significant negative impact:
•    Steep decline in pre-school learner numbers
•    Ancillary revenue was down significantly and likely to remain under pressure
•    Bad debts and fee discounts increased materially
•    Fixed-cost business - negative impact on margin

Covid-19 positives:
•    Curriculum: remote and online learning solutions deployed with specifically developed material and electronic delivery
     ›   Launched Curro Online
•    Innovative digital marketing and branding campaigns
•    Improved Grade 12 results in both IEB and NSC examinations
•    R1.5bn rights issue concluded to bolster balance sheet/reduce debt given uncertainty and to have a war chest available for opportunities

2021 – the year ahead:
•    Like-for-like organic learner growth of 12%
     › Despite terminating contracts with ±3,200 learners due to outstanding accounts in Jan 2021
     › Average learners per campus 870 vs 800
•    Acquired St George’s Preparatory in PE (300 learners) – considering other acquisitions
•    Launched Curro Choice – offering a wider range of subjects through digital innovation

19
Recurring headline earnings per share increased by 10%

Wealth management:                                              Share of recurring headline earnings

•        AUM: ↑ 20% to R233bn
•        Net inflows of R14bn
                                                                               64%
•        Advisers: ↑ 4 to 563
•        Recurring headline earnings: ↑ 19% to R448m

Insure:
•        Gross written premium: ↑ 1% to R6.8bn
•        Advisers: ↓ 7 to 369
                                                                               21%
•        Western National:
     ›      Underwriting margin increased from 13.6% to 15.3%
     ›      Shareholders’ investment income: ↑ 85% to R52.8m
•        Recurring headline earnings: ↑ 24% to R151m

Asset management:
•        AUM: ↓ 4% to R35.3bn                                                  15%
•        Net outflows of R5bn
•        Recurring headline earnings: ↓ 28% to R105m

21
FINANCIAL RESULTS
SOTP                                                                                                                                                               FY2021
The SOTP value per share decreased due to the payment of the R2.30 per share special dividend pursuant to the
Pioneer Foods disposal, but upward valuations of most investee companies as a result of improved earnings
performance.
                                                                                          29-Feb-20                                28-Feb-21
                                                                                                     Share of                               Share of
 Company                                                                       Interest           Rm   Assets               Interest    Rm Assets
 Pioneer Foods                                                                      28.6%      6,348            54.2%                  -         -             -
 Quantum Foods                                                                      32.1%        188             1.6%                  -         -             -
 Zaad                                                                               95.7%      2,034            17.4%            97.0%       2,010         30.2%
 The Logistics Group                                                                98.6%      1,028             8.8%            98.5%       1,325         19.9%
 Capespan                                                                           96.7%        999             8.5%            96.0%       1,117         16.8%
 Kaap Agri                                                                          41.0%        723             6.2%            42.3%       1,102         16.5%
 Other                                                                                           301             2.6%                          232         3.5%
 Cash & cash equivalents                                                                          83             0.7%                          876         13.1%
 TOTAL ASSETS                                                                                 11,704                                         6,662
 Debt funding                                                                                (1,500)                                             -
 SOTP                                                                                        10,204                                          6,662
 Number of shares in issue (net of treasury) (million)                                         1,710                                         1,538
 SOTP value per share (Rand)                                                                     5.97                                          4.33

Note: It should be noted that these valuations are not necessarily indicative of the values at which Zeder would consider selling any of its investments                    23
PROSPECTS AND STRATEGY
•   Grow and support existing portfolio
     ─ Agricultural conditions remain favourable
     ─ Covid-19 implications and impact continuously being evaluated
     ─ Change in accounting status to Investment Entity which provides much more relevant valuation information

•   Strategic review
     ─ Cautionary announcement released on SENS on 14 Apr 2021
     ─ Material change to the size and composition of the Zeder group (as a result of the Pioneer Foods and Quantum
       Foods disposals, as well as the special dividend paid)
     ─ Zeder board recently received third party approaches on various portfolio investments
     ─ Being evaluated and potential strategic shift towards additional value-unlocking opportunities
     ─ This strategy does not have a specific timeline and will be executed in an appropriate and responsible manner
     ─ As a result of approaches being evaluated, Zeder will not pursue share buy-backs at this time
     ─ Overall strategy remains to create value for shareholders
     ─ Zeder will communicate more detail to the market on progress made from time to time

                                                                                                                       24
25
PSG Alpha - historical financial performance

                                                                                          SOTP value per share (R)
         3.50

         3.00                                                                                                 2.90 *                   CAGR: 10.9% (6-year period)

         2.50                                                                                                                             2.40

         2.00                                                                                                                                                        1.80                         1.86
                                                                                   1.62
         1.50                                           1.21
                             1.00
         1.00

         0.50

            -
                            FY15                       FY16                        FY17                       FY18                       FY19                        FY20                         FY21

         * The FY18 and FY19 SOTP values were significantly impacted by the higher Stadio share price at the time. Post unbundling from Curro, investor sentiment drove Stadio’s share price to
         R6.75 as at 28 Feb 2018. The price has normalised since.

     •          SOTP value per share increased by 3.3% during the year under review, despite the effects of COVID-19 on the portfolio

     •          PSG Alpha’s current SOTP value is R3.9bn

     •          PSG Alpha does not employ any gearing, nor are there any operating costs at its level seeing that it is carried by PSG Group

26
PSG Alpha – SOTP value
                                                SOTP value - 28 Feb 2021
                                               100% of           PSG Alpha
                           Shareholding        investee           interest
     Investments                %                 Rm                 Rm          Basis of valuation
     CA&S                           48.8%             2 306              1 126   Listed (BSE / 4AX)
     Evergreen                      50.0%             1 737                869   NAV (excluding deferred tax)
     Stadio                         43.2%             2 002                865   Listed (JSE)
     Energy Partners                57.2%               534                305   EV/EBITDA valuation
     Optimi                         92.3%               321                296   PE valuation
     Other investments                                                     446

     Total SOTP value                                                   3 907

      • PSG Alpha generally values its investments conservatively

      • It should be noted that these valuations are not necessarily indicative of the values at which PSG Alpha would
        consider selling any of its investments

27
49%
Business overview

•    CA&S Group is the parent company of a collection of FMCG businesses that operate across the
     southern Africa region
•    CA&S Group delivers various FMCG related route-to-market services to blue chip manufacturers. The
     service offering includes selling, merchandising, warehousing, distribution, shopper promotions,
     training and debtor administration
•    Listed on the Botswana Stock Exchange (BSE) and 4AX in South Africa

29
Business model
                                       ZAMBIA
• The CA&S businesses provide          • Expo Africa
                                       • Promexs
  various services to the principles
  it represents. They earn a           NAMIBIA
  combination of service fees and      • Wutow
                                       • Expo Africa
  commission                           • PacknStack                                           MOZAMBIQUE
                                       • SMC Brands                                           • Expo Africa
• Local knowledge, understanding
                                       BOTSWANA                                         ZIMBABWE
  and customer relationships           • CA Sales & Distribution                        • Bull Red Distribution
  combined with regional               • Expo Africa                                    • Expo Africa
                                       • Kalahari Training Institute
  connectivity and shared collective   • PEO Promotions
                                       • SMC Brands                                KINGDOM OF ESWATINI
  expertise give CA&S Group            • Smithshine Enterprises                    • Expo Africa
  a powerful competitive advantage                                                 • Logico
                                                                                   • SMC Brands
  in the region                        SOUTH AFRICA
                                                                        LESOTHO
                                       • PacknStack
                                       • Retail Development Solutions   • Expo Africa
                                       • Expo Africa                    • SMC Brands
                                       • MACmobile                      • Whitakers

30
Basis of valuation: Listed share price

•    Valuation of CA&S for PSG Alpha’s SOTP is based on the closing share price in Pula on the Botswana Stock
     Exchange (BSE) translated to Rand at the ruling spot exchange rate
•    Such closing share price of R5.10 as at 28 Feb 2021 represented a 9.9x historic PE ratio based on CA&S’s headline
     earnings of 51.43cps for its financial year ended 31 Dec 2020
                                                        Historic headline earnings (YE: Dec)                                                           FY20 (Dec Y/E) commentary:
                                 250                                                                                              60.00
                                                                                                       230                 232
                                                                                                                                                       •   The business delivered satisfactory
                                                                                                                                  50.00
                                                                                                                                                           results, especially in the second half
                                 200
                                                                                          179                                                              of the year which was less affected
                                                                                                                                                           by Covid-19
        Headline earnings (Rm)

                                                                                                                                  40.00
                                 150                                      137                          157
                                                                                                                           177                         •   HEPS marginally increased by 0.2%

                                                                                                                                          HEPS (cps)
                                                                106                                                               30.00                    to 51.43 cents for the year
                                                                                          134
                                 100             87
                                                                          105                                                     20.00
                                                                                                                                                       •   Organic revenue growth and cost
                                       52                        86
                                                                                                                                                           savings were offset by reduced
                                 50              66                                                                                                        income from liquor sales (Covid-19
                                                                                                                                  10.00
                                                                                                        73
                                        40
                                                                                          46
                                                                                                                            55                             restrictions)
                                                                           32
                                        12       21              20
                                  -                                                                                               -
                                       FY14     FY15           FY16       FY17           FY18          FY19                FY20

                                              H1 Headline earnings (Rm)    H2 Headline earnings (Rm)          HEPS (cps)

31
50%
Business overview

•    Evergreen Lifestyle is an integrated developer, owner and operator of retirement lifestyle villages
•    The primary business goal is to grow its portfolio of retirement units
•    Evergreen Lifestyle aims to further entrench its position as the leading retirement brand in South Africa by
     providing a superior lived experience to its residents, supported by excellent healthcare
•    Occupation of the units is sold on a life right basis (right of tenure) in exchange for an interest-free loan, while
     ownership of the properties remains with Evergreen Lifestyle

33
Business model

Income from investment property
•    Fair value gains on new developments (units)
       › Normal property development margins realised on completion of new units
•    Fair value gains on existing units
       › Ownership of the units remains with the developer under the life right model
       › Long-term property appreciation is linked to the general residential property sector

Other income and expenses
•    General overhead and head office costs
•    Net income/loss from village operations (levy income less expenses)
       › Villages initially make operational losses until they reach scale
•    Net income or loss from healthcare services
       › Currently expenses exceed income, but expected to reverse with greater scale

34
Basis of valuation: NAV excluding deferred tax
Valuation detail
Historical financials (YE: Feb)                                      FY18            FY19           FY20           FY21 Comments
Unit overview1
Units with life right agreements (#)                                   486            557            702             784
Units not yet under life right agreements (#)                           15             47            245             191
Total units                                                            501            604            947             975

Assets                                                                 Rm             Rm              Rm             Rm
 Units with life right agreements                                    1 249          1 526           1 880          2 034   Valued at market value with reference to active sales of life rights 2
 Units not yet under life right agreements                               29           127             657            410   Valued at market value with reference to active sales of life rights
 Work in progress                                                      483            607             333            374   Valued at cost
 Vacant land                                                           142            534             860            807   Valued at cost
 Deferred tax asset                                                    -               36              53              2   Carrying value
 Net cash / working capital / PPE                                        19           257              41            270   Carrying value
Total assets                                                         1 922          3 088           3 823          3 898
Liabilities
  Life right loans                                                     755          1 011           1 309          1 479   Carrying value 3      • Fair value losses on completed units
  Development facilities                                                 78           347             460            504   Carrying value          of ~R150m were recognized in FY21
  Corporate overdraft facility                                         -              -                 6             95   Carrying value          given sales values achieved
  Deferred tax liability                                               109            145             192             87   Carrying value          (approximately 6% reduction on a
  Other / working capital                                              264              62             72             82   Carrying value          value basis)
Total liabilities                                                    1 206          1 564           2 039          2 248                         • This is due to the current weak
NAV                                                                    715           1 523          1 784          1 650                           residential property sector that
Add back: Deferred tax liability 4                                     109             145            192             87                           influences prospective purchasers’
Total                                                                  825           1 669          1 977          1 737                           ability to afford the product
PSG Alpha valuation for SOTP purposes (50% interest)                   412            834             988            869
Note 1: The unit overview includes 100% of the units at the Evergreen Val de Vie (a joint venture), while the NAV includes only the 50% economic interest in Evergreen Val de Vie.
Note 2: Independent valuer values all operational villages on 3-year rotational basis (i.e. each village valued at least once every three years).
Note 3: Loans are interest free and only repayable on resale of the unit to a new life right holder.
Note 4: The deferred tax liability relates mainly to fair value gains recognised on investment property; however, since the business intends to hold the units indefinitely, the deferred tax liability has
been disregarded for valuation purposes.
35
Overview of current and future retirement villages
                                                                Retirement units

                                                Completed units (cumulative)

                                                                                                                                               Total
       Province              Village   Feb-19             Feb-20               Feb-21           In construction       Land banked units   opportunities on
                                                                                                                                            owned land

                    Bergvliet                    78                100                  100                       -                   -                100
                    Muizenberg                  260                260                  260                       -                   -                260
                    Diep River                   57                 57                     57                     -                   -                 57
                    Lake Michelle                31                 31                     31                     -                 110                141
     Western Cape
                    Noordhoek                    46                150                  150                   96                     24                270
                    Val de Vie                    2                111                  139                   60                    409                608
                    Sitari                         -                  -                     -                     -                 370                370
                    Somerset West                  -                  -                     -                     -                 340                340
       Gauteng      Broadacres                  130                238                  238                       -                 108                346
                    Umhlanga                       -                  -                     -                     -                 640                640
         KZN        Hilton                         -                  -                     -                     -                 900                900
                    Zimbali                        -                  -                     -                     -                 750                750
     Eastern Cape   Westbrook                      -                  -                     -                     -                 800                800

                    Total                       604                947                  975                  156                  4 451              5 582

                                                         Care units (monthly fees apply)

     Western Cape   Muizenberg                   32                 32                     32                     -
       Gauteng      Broadacres                   32                 32                     32                     -
                    Total                        64                 64                     64                     -

36
43%
Business overview

Stadio Holdings is building a ‘credible private higher education’ business for 100,000+ students
 •   Vision: “To be a leading higher education provider, offering qualifications aligned with the needs of societies, students, and the world
     of work”

Through several acquisitions in 2017 to 2019, Stadio Holdings created a base to build from. Key metrics for the business
include:
 •   ~35,000 students
 •   95 accredited qualifications (35 in pipeline)
 •   14 existing campuses, with the first mega multi-faculty campus under construction in Centurion
 •   82% distance learning, 18% contact learning (on-campus) students – similar ratio expected in future
 •   Services school leavers, adults and corporates

38
Business model

•    Provides quality, relevant higher education to school leavers and adult learners

•    Multi-mode (distance learning and face-to-face), multi-faculty (wide range of qualifications), multi-campus (across South
     Africa)

•    Stadio Holdings to invest in:
     › Consolidation of one Stadio brand – have completed merger of four of the brands into one and will focus on aligning
       processes and structures to benefit from marketing, operational and regulatory efficiencies of operating as one
     › Greenfield multi-faculty campuses – 3,000 to 5,000 students capacity campus in progress in Centurion (land secured
       in Durbanville)
     › Distance learning logistics centre in Krugersdorp
     › New IT systems (CANVAS, CRM, ERP, SIMS)
     › Accredited qualifications in all modes of learning delivery (e.g. first online SAICA-accredited Post Graduate Diploma in
       Accounting, BA Law, Doctorates in Management and Policing, etc.)
     › Centre for lifelong learning (e.g. short courses and non-accredited courses)

39
3 Distinct Institutions

40
Basis of valuation: Listed share price

•    Stadio Holdings has been listed on the JSE since Oct 2017
•    Its 28 Feb 2021 closing share price of R2.38 represents a 16.8x historic PE ratio based on Stadio’s FY20 core
     headline earnings of 14.2cps

                                                                         Historic core headline earnings (YE: Dec)
                                                     140                                                                                         20.00

                                                                                                                              117                18.00
                                                     120
                                                                                                                                                 16.00
                       Core headline earnings (Rm)

                                                     100                                                                                         14.00
                                                                                              88
                                                                                                                             60

                                                                                                                                                         Core HEPS (cps)
                                                                                                                                                 12.00
                                                     80          70
                                                                                                                                                 10.00
                                                                                              42
                                                     60
                                                                                                                                                 8.00
                                                                 38

                                                     40                                                                                          6.00

                                                                                                                              57                 4.00
                                                                                              46
                                                     20
                                                                 32                                                                              2.00

                                                      -                                                                                          -
                                                               FY18                          FY19                            FY20

                                                           H1 Core headline earnings (Rm)   H2 Core headline earnings (Rm)     Core HEPS (cps)

41
(previously FutureLearn)

                           92%
Business overview

•     The Optimi group provides education products and services across four divisions: Home, Workplace, Classroom and
      College. Together, these divisions service over 200,000 learners per annum with accessible, simple and affordable
      learning and teaching solutions

•     Optimi's offerings include the SA market leader in home-schooling Impaq (Optimi Home), leading adult education and
      training provider Mediaworks (Optimi Workplace), leading provider of e-learning solutions ITSI (Optimi Classroom) and
      vocational distance education CollegeSA (Optimi College)

Home education and               Classroom and extra-class           Accredited qualifications and   Workforce and community
supplementary learning.          teaching and learning solutions.    short courses.                  education and training.
▪ >26 000 learners               ▪ >1 600 schools                    ▪ >6 000 students               ▪ >350 organisations
▪ >2 700 facilitators            ▪ >50 other learning institutions
 43
Business model

•    Optimi provides various education products and services, using their proprietary GuidED™ learning
     model as the foundation of its brand promise and offerings

•    Optimi’s GuidED™ learning model provides learners and facilitators with individualised guidance
     throughout their learning journey to achieve their learning goals:
       •   integrating five core elements needed for effective learning and facilitation, namely guidance,
           content, application, engagement, and formal assessment
       •   based on the latest research in the science of learning, including neuroscience, cognitive science,
           pedagogy, and psychology
       •   delivered using Optimi’s technology ecosystem that ensures an integrated and visible learning
           experience while enabling efficient and effective learning delivery
       •   supported by Optimi’s centralised services that aim to lower the cost of learning through
           centralisation and automation

44
Basis of valuation: PE multiple

•    The average PE multiple of three listed education companies is used as a reference point and applied to Optimi's
     recurring earnings*

•    The average PE ratio of 13.7x is considered fair considering Optimi's growth prospects and market leading positions

     (YE: Dec)                                                                  FY17        FY18       FY19       FY20
     Optimi PE valuation                                                         Rm          Rm         Rm         Rm
     Optimi Group revenue including acquisitions (Rm)                          119.0       211.5      357.4      389.4
     Recurring earnings (Rm)                                                     9.9        13.7       16.2       23.4
     PE multiple (times)                                                                                          13.7
     Valuation (Rm)                                                                                              320.7

     * Note that Curro has temporarily been excluded from such average given its current high PE multiple with its
       FY20 earnings having been significantly impacted by Covid-19

45
57%
Business overview
• Energy Partners is a fully integrated private utility business that sells solar energy, cooling and heating to commercial and
  industrial clients
• The primary business focus is to grow the investment portfolio of energy assets
• By owning the assets, Energy Partners secures recurring income and a greater share of the lifetime value of the assets

     Divisions retained                       Brief rationale

                                              Large scope for photovoltaic solar plants (both as cash and PPA* projects) given the cost advantages
                    Solar
                                              compared to grid alternatives

                                              Significant potential to design, build, own and operate industrial and commercial refrigeration plants exists in
               Refrigeration                  South Africa where value can be unlocked through the funding model, exceptional design, execution and
                                              operation of assets
                                              The potential exists to design, build, own and operate boilers in South Africa where we have offered clients
                   Steam                      savings through superior design, control and operations. Assets are typically large and attractive on a PPA
                                              model

                                              The support required to track asset performance and bill utilities is invaluable to our three divisions building
      Energy Intelligence Solutions
                                              assets, as well as to large corporates like Netcare and Pick n Pay

     *Power Purchase Agreement, where Energy Partners owns the asset

47
Business model and basis of valuation
The business model comprises two components:
1. Operations business
         • Constructs and sells energy installations to external customers or to the Energy Partners investment business*
                *Inter-company transactions occur on an arms-length basis

2. Investment business
         • Owns energy-related assets with long-term off-take agreements with private sector clients

Basis of valuation – EV/EBITDA multiple:

•    The following EBITDA multiples are used to value the respective components of the business:
     ›     Operations business - 6.0x
     ›     Investment business - 10.0x

•    The following adjustments are made in the interest of accuracy:
     ›     The EBITDA from assets commissioned in the last 12 months is annualised (otherwise the debt would be overstated)
     ›     Available cash and the cost of work-in-progress assets are added to the valuation
     ›     All debt is deducted from the valuation
     ›     Inter-company transactions are not eliminated for valuation purposes (the two businesses are valued independently)
     ›     Loss-making operating divisions are valued at zero (these are expected to become profitable or will be closed otherwise)
48
Basis of valuation: EV/EBITDA multiple (continued)

     Historical financials (YE: Jan) (Rm)                                  FY17     FY18     FY19    FY20     FY21     3yr CAGR
     Cumulative commissioned energy assets (owned by EP)                   52.3     99.7    158.9    252.6    344.8         51%
     Work-in-progress energy assets                                         -        6.9     15.0     47.9     85.7        132%
     Total capital value of energy assets                                  52.3    106.5    173.9    300.5    430.5         79%

     EBITDA from Investments (last 12 months annualised)                    7.2     16.6     28.5     35.3     49.8         44%
     EBITDA from Continued Operations (rolling 12 months actual)            5.2     33.8      7.5     16.4     14.7       (24%)

     Enterprise value                                                                                          586.5
     Net cash / (debt)                                                                                       (138.5)
     Add work-in-progress asset value                                                                          85.7
                                        1
     Equity value as at 31 January 2021                                                                       533.7
     No of issued shares (m)                                                                                  2.239
     R/share valuation                                                                                        238.3

     Average yield on assets                                             13.8%    16.7%    17.9%    14.0%    14.4%

     Note 1: Energy Partners adopted the valuation methodology in FY21

49
Other investments
 Investment   %           Focus                                                         Comments

                                        •   Established a joint venture in USA with Taiki International (Japanese cosmetics manufacturer) to
                   Nanofiber material
              61                            produce and sell nanofiber-based cosmetic facial masks and related products
                   science
                                        •   Developed and commercialised face masks using replaceable nanofiber inserts (Covid-19 related)
                   Improve new car      •   Systems approach and digital marketing proving successful
              76   purchase             •   Carter owns the #1 and #2 Renault dealerships in South Africa; looking for opportunity to add more
                   experience               brands through acquisition(s)
                                        •   51% black-owned mining services business
                   Mining support
              44                        •   Specialises in structural support and outsourced mining services in the platinum mining industry
                   services
                                        •   Looking to diversify geographically and into related commodities

              49   LBO specialist       •   Diversified portfolio of five investments

50
PSG Group’s underlying investees’ websites
• Most of PSG Group’s major underlying investees presented their results recently

• For more information, please visit the respective companies’ websites:
     ›   PSG Konsult: www.psg.co.za
     ›   Curro: www.curro.co.za
     ›   Zeder: www.zeder.co.za
         ‐   Kaap Agri: www.kaapagri.co.za
     ›   PSG Alpha investments:
         ‐   CA&S: www.casholdings.co.za
         ‐   Evergreen: www.evergreenlifestyle.co.za
         ‐   Stadio: www.stadio.co.za
         ‐   Optimi: www.optimi.co.za
         ‐   Energy Partners: www.energypartners.co.za

51
Questions?
You can also read