Wells Fargo VIRTUAL 2020 Industrials Conference - Frank C. Sullivan Chairman and CEO Matthew T. Ratajczak Vice President - Global Tax and ...
←
→
Page content transcription
If your browser does not render page correctly, please read the page content below

Wells Fargo VIRTUAL
       2020 Industrials Conference

                         Frank C. Sullivan
                      Chairman and CEO
                    Matthew T. Ratajczak
Vice President – Global Tax and Treasurer

                             May 6, 2020

             RPM International Inc.
Forward-Looking Statements & Regulation G

This presentation contains “Forward-Looking Statements” as defined in the Private Securities Litigation Reform Act of
1995. These statements relate to our plans, expectations, estimates and beliefs of future events or our future financial
performance and involve known and unknown risks, uncertainties and other factors that may cause our actual results,
levels of activity, performance or achievements to be materially different from those expressed or implied by any
forward-looking statements. In some cases, you can identify forward-looking statements by terminology such as
“may,” “will,” “could,” “would,” “should,” “expect,” “plan,” “anticipate,” “target,” “project,” “intend,” “believe,”
“estimate,” “predict,” “potential,” “pro forma,” “seek” or “continue” or the negative of those terms or other
comparable terminology. Actual results may differ materially from expectations and are subject to certain risks and
uncertainties such as those described in RPM’s periodic reports and statements filed with the Securities and Exchange
Commission and available through the company’s website, www.rpminc.com. For example, the situation with COVID-
19 is changing rapidly and cannot be predicted, but has already had impacts on our business. These impacts and other
events related to COVID-19 have negatively affected, and could continue to negatively affect, our business, plans,
performance, and anticipated financial results. We do not undertake any obligation to publicly update or revise any
forward-looking statements to reflect future events, information or circumstances that arise after the date of this
presentation.

This presentation includes certain company data that do not directly conform to generally accepted accounting
principles, or GAAP, and certain company data that has been restated for improved clarity, understanding and
comparability, or pro forma. All non-GAAP data in this presentation are indicated by footnote. Tables reconciling such
data with GAAP measures are available through our website, www.rpminc.com under Investor
Information/Presentations.

                                                                                Wells Fargo VIRTUAL 2020 Industrials Conference 5/6/20   2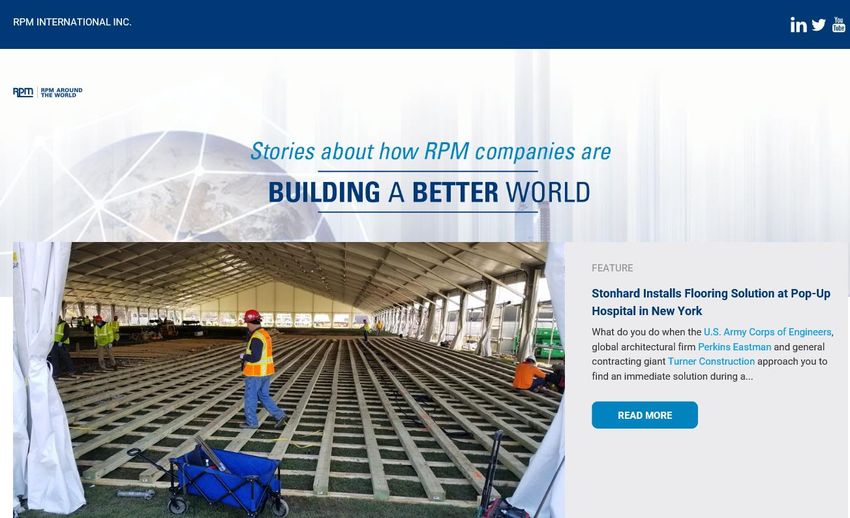
RPM At A Glance

                               A world leader in specialty coatings,
                         sealants, building materials and related services.
                                           Q U I C K FA C T S
MANUFACTURING FACILITIES IN 26 COUNTRIES                                                         DIVIDEND RECORD
                                           FOUNDED:                          1947

                                           HEADQUARTERS:

                                           STOCK LISTING:
                                                                      Medina, OH

                                                                            NYSE
                                                                   (Symbol: RPM)
                                                                                                    46
                                                                                                  consecutive years
                                                                                                 of dividend increases
                                           FISCAL 2019 SALES:         $5.6 Billion
                                                                                                   STOCKHOLDERS
                                                                171 countries and              (percent of total shares)
                                           SALES LOCATIONS:
                                                                       territories
                                                                                       Institutional: 81%       Individual: 19%
                                           EMPLOYEES:                      15,000       693 Institutions       139,431 Individuals

                                                                           Wells Fargo VIRTUAL 2020 Industrials Conference 5/6/20    3
Operating Groups Drive Growth & Efficiency
Through Four Reportable Segments

              CONSTRUCTION                                         PERFORMANCE
                PRODUCTS GROUP                                       COATINGS GROUP
         Proforma Sales: $1.9 billion - 34%                  Proforma Sales: $1.1 billion - 20%

                 CONSUMER                      FY19 SALES:
                                                                       SPECIALTY
                      GROUP                                          PRODUCTS GROUP
                                              $5.6 BILLION
         Proforma Sales: $1.9 billion - 34%                  Proforma Sales: $0.7 billion - 12%

   Entrepreneurial Approach to Customers with Leading Brands Driving Innovation and Growth
  Center-Led in Operations and Administration, Driving Efficiency and Continuous Improvement
                          Value of 168: Transparency, Trust & Respect

                                                                   Wells Fargo VIRTUAL 2020 Industrials Conference 5/6/20   4
Construction Products Group
$1.9 billon Fiscal 2019 Proforma Sales

                       GLOBAL BRANDS

                                                             REGIONAL BRANDS

                                         Wells Fargo VIRTUAL 2020 Industrials Conference 5/6/20   5
Construction Products Group
Target Markets

           6 sides of the Building    •   Bridge                 • Tunnel
             + Floor (seamless)       •   Rail                   • Water
            + Fire protection         •   Transit                • Power
            + Concrete                •   Highway

        BUILDING ENVELOPE                  INFRASTRUCTURE
       Air | Moisture | Thermal      Concrete | Concrete Protection

                                           Wells Fargo VIRTUAL 2020 Industrials Conference 5/6/20   6
Performance Coatings Group
$1.1 billon Fiscal 2019 Proforma Sales

       COATINGS               FLOOR SYSTEMS                    INFRASTRUCTURE                              FRP GRATING
      PROTECTIVE COATINGS    SANITARY FLOORS FOOD & BEVERAGE   RESURFACING & REPAIRING BRIDGES       FIBERGLASS REINFORCED PLASTIC GRATINGS

      FIREPROOFING SYSTEMS   FLOORS FOR COMMERCIAL SPACES      BUILDING MAINTENANCE SERVICES                     RAILINGS

                                                                                        Wells Fargo VIRTUAL 2020 Industrials Conference 5/6/20   7
Performance Coatings Group
Target Markets

                             Manufacturing
                             Metals & Mining
                             Pulp & Paper
                             Technology

                             Bridge & Highway
                             Water Wastewater
                             Transportation
                             Marine

                             Commercial Spaces
                             Food & Beverage
                             Pharmaceutical
                             Healthcare

                             Offshore Oil & Gas
                             Petrochemical
                             Power
                             Renewable Energy
                                                  Wells Fargo VIRTUAL 2020 Industrials Conference 5/6/20   8
Consumer Group
   $1.9 billon Fiscal 2019 Proforma Sales

#1 Supplier in the       #1 Caulk &         Fastest Growing     #1 Primer Brand                   #1 Brand of Wall
  Small Project       Sealant Supplier      Supplier of Wood      in Customer                       Repair and
 Paint Category       in North America      Finishes in North     Satisfaction                    Spackle in North
   Worldwide                                     America             among                            America
                                                                Professionals in
                                                                 North America

                                                                   Wells Fargo VIRTUAL 2020 Industrials Conference 5/6/20   9
Consumer Group
Target Markets

• User Targets: DIY/Makers, Professionals, Industrial
• Understanding targets’ needs and unmet needs drives innovation machine
• Over 30,000 user insights have been gained in the past 24 months alone

     DIY               DIY              MAKERS          PROFESSIONALS                      INDUSTRIAL

                                                          Wells Fargo VIRTUAL 2020 Industrials Conference 5/6/20   10
Specialty Products Group
$0.7 billon Fiscal 2019 Proforma Sales
#1 Supplier of World Leading #1 in North Global Market
Daylight Manufacturer of America for Leader in Water-
Fluorescent Professional Professional Based, Antifouling
Colorants Restoration and Touch-up and Paints for the
Worldwide Cleaning Solutions Repair Products Marine Industry
for Furniture and
Cabinetry
Wells Fargo VIRTUAL 2020 Industrials Conference 5/6/20 11Specialty Products Group
Target Markets
Food, Pharma, Packaging, Safety Agriculture,
Cosmetics Equipment, Forestry, Lumber
Apparel
Furniture and Appliance, Auto, Marine, Fuel, Restoration &
Cabinetry Marine, Furniture Cleaning
Construction Protection, Equipment &
Cosmetics Chemicals
Wells Fargo VIRTUAL 2020 Industrials Conference 5/6/20 12Positioning RPM for the Next Level of Growth
STRONG HISTORY OF 2020 MAP BUILDING A
ENTREPRENEURIAL TO GROWTH BETTER RPM
GROWTH CONTINUES
Extraordinary Transforming RPM into a Combining
72-year history more connected and entrepreneurial legacy
of growth, innovation efficient company and the discipline of
and value creation with focused on operational continuous
the reputation as best excellence and improvement driving
home for entrepreneurial continuous improvement operational excellence
companies
Wells Fargo VIRTUAL 2020 Industrials Conference 5/6/20 132020 MAP to Growth
PURPOSE VISION
To position RPM for sustained, profitable growth To transform RPM into a more connected
creating superior value for its customers, and efficient company focused on
entrepreneurs, associates and shareholders. operational excellence and continuous
improvement, while maintaining the
strengths of its entrepreneurial culture.
GOALS
By May 31, 2021, RPM is
targeting improvements to:
• $6.25 bb Revenues
• $1.0 bb Adj. EBIT on an
annualized run rate
• $1.5 bb Return of Capital
Maintain Entrepreneurial Align to Increase Operational
Growth Culture Execute Efficiency
Wells Fargo VIRTUAL 2020 Industrials Conference 5/6/20 142020 MAP to Growth: Wave 1 Exceeds Initial Target by 23%
Annualized Run Rate
to Benefit 2022:
$106 MM EBIT
WAVES PLAN
MAP 2020 $106
Annualized Run Rate
Annualized to Benefit 2021:
$101 MM EBIT
Run Rate
Annualized Run Rate
$ in millions to Benefit 2020:
$290
$102 MM $101
$83 MM EBIT
EBIT
$41
MANUFACTURING $38
$36
PROCUREMENT $20
$25 $25
G&A
INITIAL UPDATED TARGET TARGET TARGET
TARGET TARGET
WAVE 1 WAVE 2 WAVE 3
Sept 2018 – May 2019 June 2019 – May 2020 June 2020 – Dec 2020 TOTAL
• Wave 1 completed ahead of initial target by 23%, or $19 mm
• Procurement and G&A ahead of plan; manufacturing on plan
• $7 mm originally targeted in manufacturing reclassified to G&A
• Some Wave 2 savings captured early
• Remain confident in total targeted savings of $290 mm
Wells Fargo VIRTUAL 2020 Industrials Conference 5/6/20 15Fiscal 2020 Third-Quarter Reported Results
SEGMENT RESULTS
CONSTRUCTI ON PRODUCTS GROUP
Feb. 29 Feb. 28
Three months ended
2020 2019 %
($ in millions, except per share amounts) Sales $372 $355 +4.7%
EBIT1 $1.7 $(1.5) +207.6%
C O N S O L I D AT E D PERFORM ANC E COATIN GS GROUP
Feb. 29 Feb. 28
Feb. 29 Feb. 28 Three months ended
2020 2019 %
Three months ended
2020 2019 %
Sales $256 $253 +1.0%
Sales $1,174 $1,141 +2.9% EBIT1 $22 $14 +53.3%
CONSUM ER GROUP
EBIT1 $44 $26 +68.0%
Feb. 29 Feb. 28
Three months ended
2020 2019 %
Net Income $12 $14 (16.5)%
Sales $399 $378 +5.4%
Diluted EPS $0.09 $0.11 (18.2)% EBIT1 $30 $25 +17.6%
SPECIALT Y PRODUCTS GROUP
Feb. 29 Feb. 28
Three months ended
2020 2019 %
Sales $147 $154 (4.1)%
EBIT1 $13 $16 (18.9)%
• 2020 MAP to Growth operating improvement program fuels excellent third-quarter operating leverage, enabling RPM to continue to outpace the
earnings growth of its peers.
• Also positively impacting results were the benefits of pricing and moderating raw material costs.
• Solid top-line growth was achieved during the third quarter, which typically generates RPM’s most modest results each year because it falls
during the winter months, when painting and construction activity slow.
• Market share gains and pricing contributed to organic sales growth of 3.0%. This was partially offset by foreign currency translation of 0.8%,
while acquisitions contributed 0.7% to sales.
• (1) EBIT is a non-GAAP financial measure. Refer to Appendix for reconciliations between GAAP and non-GAAP measures.
Wells Fargo VIRTUAL 2020 Industrials Conference 5/6/20 16Fiscal 2020 Third-Quarter Adjusted Results
SEGMENT RESULTS
CONSTRUCTI ON PRODUCTS GROUP
Feb. 29 Feb. 28
Three months ended
2020 2019 %
Sales $372 $355 +4.7%
($ in millions, except per share amounts)
EBIT1 $6.0 $(0.3) +1,917.8%
C O N S O L I D AT E D EBIT Margin1 1.6% (0.1)% nm
Feb. 29 Feb. 28 PERFORM ANC E COATIN GS GROUP
Three months ended
2020 2019 %
Feb. 29 Feb. 28
Three months ended
2020 2019 %
Sales $1,174 $1,141 +2.9%
Sales $256 $253 +1.0%
EBIT1 $60 $46 +30.4% EBIT1 $24 $18 +33.2%
EBIT Margin1 5.1% 4.1% +100 bps EBIT Margin1 9.5% 7.2% +230 bps
CONSUM ER GROUP
Diluted EPS1 $0.23 $0.13 +76.9%
Feb. 29 Feb. 28
Three months ended
2020 2019 %
Sales $399 $378 +5.4%
EBIT1 $32 $27 +19.2%
EBIT Margin1 8.1% 7.1% +100 bps
SPECIALT Y PRODUCTS GROUP
Feb. 29 Feb. 28
Three months ended
2020 2019 %
• During Q3 2020, Adjusted EBIT and Adjusted Diluted EPS reflects
restructuring and other charges, all of which have been incurred Sales $147 $154 (4.1)%
in relation to RPM’s 2020 Margin Acceleration Plan initiatives.
• (1) Adjusted EBIT and Adjusted Diluted EPS are non-GAAP EBIT1 $18 $20 (13.1)%
financial measures. Refer to Appendix for reconciliations EBIT Margin1 11.9% 13.1% (120) bps
between GAAP and non-GAAP measures.
Wells Fargo VIRTUAL 2020 Industrials Conference 5/6/20 17Fiscal 2020 Year-to-Date Reported Results
SEGMENT RESULTS
CONSTRUCTI ON PRODUCTS GROUP
Feb. 29 Feb. 28
Nine months ended
2020 2019 %
Sales $1,408 $1,340 +5.0%
($ in millions, except per share amounts)
EBIT1 $146 $103 +40.8%
PERFORM ANC E COATIN GS GROUP
C O N S O L I D AT E D
Feb. 29 Feb. 28
Feb. 29 Feb. 28
Nine months ended
2020 2019 %
Nine months ended
2020 2019 %
Sales $846 $842 +0.5%
Sales $4,048 $3,963 +2.1% EBIT1 $84 $45 +84.2%
CONSUM ER GROUP
EBIT1 $329 $237 +38.9% Feb. 29 Feb. 28
Nine months ended
2020 2019 %
Net Income $195 $133 +46.4% Sales $1,329 $1,281 +3.8%
Diluted EPS $1.50 $1.00 +50.0% EBIT1 $124 $118 +4.3%
SPECIALT Y PRODUCTS GROUP
Feb. 29 Feb. 28
Nine months ended
2020 2019 %
Sales $466 $500 (6.9)%
EBIT1 $55 $66 (16.3)%
• For the nine-month period, organic sales increased of 2.0%. This was partially offset by foreign currency translation of 1.2%, while acquisitions
contributed 1.3% to sales.
• (1) EBIT is a non-GAAP financial measure. Refer to Appendix for reconciliations between GAAP and non-GAAP measures.
Wells Fargo VIRTUAL 2020 Industrials Conference 5/6/20 18Fiscal 2020 Year-to-Date Adjusted Results
SEGMENT RESULTS
CONSTRUCTI ON PRODUCTS GROUP
Feb. 29 Feb. 28
Nine months ended
2020 2019 %
Sales $1,408 $1,340 +5.0%
($ in millions, except per share amounts)
EBIT1 $155 $113 +36.5%
C O N S O L I D AT E D EBIT Margin1 11.0% 8.5% +250 bps
Feb. 29 Feb. 28 PERFORM ANC E COATIN GS GROUP
Nine months ended
2020 2019 %
Feb. 29 Feb. 28
Nine months ended
2020 2019 %
Sales $4,048 $3,963 +2.1%
Sales $846 $842 +0.5%
EBIT1 $407 $326 +24.7% EBIT1 $98 $79 +23.9%
EBIT Margin1 11.6% 9.4% +220 bps
EBIT Margin1 10.0% 8.2% +180 bps
CONSUM ER GROUP
Diluted EPS1 $1.94 $1.49 +30.2%
Feb. 29 Feb. 28
Nine months ended
2020 2019 %
Sales $1,329 $1,281 +3.8%
EBIT1 $149 $122 +21.6%
EBIT Margin1 11.2% 9.5% +170 bps
SPECIALT Y PRODUCTS GROUP
• During fiscal year 2020, Adjusted EBIT and Adjusted Diluted EPS Nine months ended
Feb. 29 Feb. 28
%
reflects restructuring and other charges, all of which have been 2020 2019
incurred in relation to RPM’s 2020 Margin Acceleration Plan Sales $466 $500 (6.9)%
initiatives.
• (1) Adjusted EBIT and Adjusted Diluted EPS are non-GAAP EBIT1 $69 $75 (8.0)%
financial measures. Refer to Appendix for reconciliations EBIT Margin1 14.9% 15.1% (20) bps
between GAAP and non-GAAP measures.
Wells Fargo VIRTUAL 2020 Industrials Conference 5/6/20 19Select Cash Flow Items
($ in millions)
SUMMARIZED CASH FLOW AND FREE CASH FLOW METRICS
Feb. 29 Feb. 28 FY20 vs FY19
Nine months ended
2020 2019 Source / (Use)
Net Income $196 $134 $ 62
Stock-based Compensation $ 19 $ 21 ($ 2)
Depreciation & Amortization $114 $108 $ 6
Working Capital $138 ($ 95) $233 *
Accrued Compensation & Benefits ($ 39) ($ 33) ($ 6)
Restructuring Charges, Net of Payments $ ---- $ 9 ($ 9)
Decrease in Other Liabilities ($ 69) ($ 21) ($ 48) **
All Other Items $ 22 $ 22 $ ----
Cash From Operating Activities $381 $145 $236
Capital Expenditures ($105) ($ 84) ($ 21)
Cash Dividends ($139) ($136) ($ 3)
Free Cash Flow Source / (Use) $137 ($ 75) $212
* Cash conversion cycle improved by 13.0 days period-over-period
• DIO improved by 1.5 days; DSO improved by 2.3 days; DPO improved by 9.2 days
** Principally due to higher period-over-period global income tax payments and other income tax items
Wells Fargo VIRTUAL 2020 Industrials Conference 5/6/20 20RPM is Positioned to Grow in New Markets and Product Channels
$ in billions
Pleasure Marine Cleaners,
Powder Coatings, $1.1 Coatings, $0.50 $6 Caulks, Sealants &
Cleaning/Restoration, Adhesives, $5
$0.25
Fluorescent Colorants, Wood Wood Care, $3
$0.150 Coatings, $10 Primers, $3
Food Coatings, $5
Small Project Paints, $3
Industrial
Coatings, $12
RPM Global
Polymer Flooring, $6 Addressable
High-Performance
Market Sealants, $29
Infrastructure Coatings,
$5 $134 bb**
FRP, $1
Construction
Adhesives, $9
EIFS North America,
$0.27
Commercial Roofing,
Below-Grade Cement and Concrete $17
Waterproofing, $1 Additives , $17
*Sources: Adhesive Sealant Council, Fredonia, MarketsandMarkets, Stratview
Research, EIMA Members, Fior Markets, Powder Coatings Institute, Orr &
Boss Consulting, Global Market Insights and company estimates and
Management’s estimates.
** figures may not add due to rounding
Wells Fargo VIRTUAL 2020 Industrials Conference 5/6/20 21Construction Products Group
Innovative New Products
Insulated Concrete Forms Level Top PC-AGG POWERply Endure
Enable the construction of An easy-to-use, self-leveling BIO Adhesive
stronger, highly energy resurfacing compound A two-part, bio-based roofing
efficient concrete structures designed for new or worn adhesive that is quick-drying
capable of withstanding concrete substrates. and virtually odorless.
hurricanes.
Wells Fargo VIRTUAL 2020 Industrials Conference 5/6/20 22Performance Coatings Group
Innovative New Products
Carboquick 200 Soilok Hygienic Systems
This fast-cure, high-build This grout can stabilize soil, Seamless flooring, walls and
polyaspartic coating provides shut off water intrusion and curbs unite to ensure dirt and
corrosion protection, plus contain hazardous material bacteria have no place to
long-term weatherability. spills to prevent them from harbor and grow in food and
spreading below ground and beverage environments.
into water sources.
Wells Fargo VIRTUAL 2020 Industrials Conference 5/6/20 23Consumer Group
Innovative New Products
Turbo Spray Mold Killing Primer DynaFlex Ultra
Delivers protection 4X faster The first and only EPA- An advanced exterior sealant
than traditional aerosols in a registered primer that kills formulated for exterior
large, easy-to-use can that existing mold, mildew and applications with weather
includes a 10”-wide fan spray odor causing bacteria; can be max technology that is crack-
tip to coat surfaces in fewer painted directly over mold. proof and resists UV fading.
passes.
Wells Fargo VIRTUAL 2020 Industrials Conference 5/6/20 24Specialty Products Group
Innovative New Products
TRU-CORE for VerdeCoat 3-in-1 Repair Stick
Engineered Woods A new “green” barrier coating Offers complete wood repairs
Fully penetrates wood from specially formulated for with a single product, filling,
the inside out with anti- packaging using ingredients leveling and color
fungal, anti-insect and other approved for direct food replacement all in one.
protectants. contact.
Wells Fargo VIRTUAL 2020 Industrials Conference 5/6/20 25Accelerating Acquisition Pace
✓ Successful, niche businesses with ★ Achieve revenue synergies
leading brands
★ New channels
✓ Above average gross profit margins
★ New geographies
CRITERIA ✓ 70% product line integrations BENEFITS
★ New technologies
✓ 30% stand-alone with entrepreneurial
leadership that stays ★ Great home for entrepreneurs
Wells Fargo VIRTUAL 2020 Industrials Conference 5/6/20 26Intercompany Connections Drive Value Creation
Rust-Oleum and Tremco
Leveraging third-party Consumer
Group MRO channel network
Tremco and Fibergrate
Connect to bring new rooftop
safety solutions to market
Dryvit and Euclid Chemical
Shared technology speeds
cure times of NewBrick product
Wells Fargo VIRTUAL 2020 Industrials Conference 5/6/20 27International Expansion Opens New Markets
Sales by Region
$ in millions CONSOLIDATED
2019 – $5,565
2002 – $1,960
OUTSIDE NA
2019 – $1,498
2002 – $235
EUROPE
2019 – $1,029 – 18%
2002 – $158 – 8%
NORTH AMERICA
2019 – $4,067 – 73%
2002 – $1,725 – 88%
AFRICA/MIDDLE EAST
2019 – $72 – 2%
2002 – $24 – 1% ASIA/PACIFIC
2019 – $178 – 3%
2002 – $20 – 1%
SOUTH AMERICA
2019 – $219 – 4%
2002 – $33 – 2%
Wells Fargo VIRTUAL 2020 Industrials Conference 5/6/20 28RPM Facility Closures: COVID-19
REPORT DATE: CLOSURE STATUS: FACILITY TYPE:
April 29, 2020 Closure – Gov’t Shutdown Manufacturing
Open/Reopened Other Office/Facility
tremco illbruck
Cologne, Germany
Kirker
Rust-Oleum Ross-Shire, Scotland Carboline
Somerset, NJ, USA Lier, Norway
USL Group
Pettit Dryvit
Euclid Washington, England
Rockaway, NJ, USA Radziejowice, Poland
Saint-Hubert, Québec, Canada
Mameco tremco illbruck
Cleveland, OH, USA NUDURA Dijon, France API S.p.A.
Granby, Québec, Canada Genoa, Italy
Carboline
Dryvit
Green Bay, WI, USA Groupo PV
Carboline North Kingstown, RI, USA
Firelanz Vallirana, Spain
St. Louis, MO, USA Kirker
Paterson, NJ, USA Sevilla, Spain
DAP
Pacific, MO, USA Carboline Stonhard StonCor
New Orleans, LA, USA Carboline Maple Shade, NJ, USA Dubai, UAE Flowcrete
Greensburg, PA, USA Delhi, India
Flowcrete
Euclid Mumbai, India
Euclid Santo Domingo, Dominican Republic Flowcrete
Flowcrete Bangkok, Thailand
Guatemala City, Guatemala Euclid Bangalore, India
Euclid Rust-Oleum Puerto Rico Flowcrete
San José, Costa Rica Tocancipá, Colombia Flowcrete Kuala Lumpur, Malaysia
Euclid Euclid Toxement Chennai, India
Panama City, Panama Bogota, Colombia Carboline
Euclid Chennai, India
Guayaquil, Ecuador
Rust-Oleum Viapol
Miraflores, Peru Candeias, Brazil
Viapol StonCor
Rust-Oleum Gauteng, South Africa Agpro
Cacapava, Brazil Morrells Auckland, New Zealand
São Paulo, Brazil Johannesburg, South Africa Rust-Oleum
Johannesburg, South Africa
StonCor
Rust-Oleum Buenos Aires, Argentina Kop-Coat
Santiago, Chile Rotorua, New Zealand
Rust-Oleum
Buenos Aires, Argentina
Wells Fargo VIRTUAL 2020 Industrials Conference 5/6/20 29RPM is Building a Better World
From homes and
to infrastructure,
workplaces,
…RPM’s products are trusted by consumers
and precious and professionals worldwide to beautify
landmarks… structures, protect them from harsh
environments, prolong their lifecycles and
enhance their sustainability.
Wells Fargo VIRTUAL 2020 Industrials Conference 5/6/20 30Coronavirus: Stonhard Installs Flooring Solution
at New York Pop-Up Hospital
Wells Fargo VIRTUAL 2020 Industrials Conference 5/6/20 31Nudura ICFs Part of First Net Zero Energy Public School in U.S.
Wells Fargo VIRTUAL 2020 Industrials Conference 5/6/20 32Nudura ICF Home Withstands Hurricane
Wells Fargo VIRTUAL 2020 Industrials Conference 5/6/20 33Appendix
Reconciliations of
Non-GAAP Measures
to GAAP Measures
RPM International Inc.Non-GAAP Financial Measures
The following are the non-GAAP financial measures used in this presentation:
• EBIT is defined as earnings (loss) before interest and taxes. Management uses EBIT, as defined, as a
measure of operating performance, since interest expense, net, essentially relates to corporate functions,
as opposed to segment operations. Tables reconciling this non-GAAP data with GAAP measures are
available in the appendix of this presentation.
• Adjusted EBIT is defined as earnings (loss) before interest and taxes, adjusted for items that management
does not consider to be indicative of ongoing operations. Management uses Adjusted EBIT, as defined, as
a measure of operating performance, since interest expense, net, essentially relates to corporate
functions, as opposed to segment operations. Tables reconciling this non-GAAP data with GAAP measures
are available in the appendix of this presentation.
• Adjusted Diluted EPS is provided for the purpose of adjusting diluted earnings per share for items
impacting earnings that are not considered by management to be indicative of ongoing operations. For
example, investment returns including realized net gains and losses on sales of investments and unrealized
net gains and losses on equity securities are excluded from the calculation of Adjusted Diluted EPS due to
their inherent volatility. Management does not consider these gains and losses, which cannot be
predicted with any level of certainty, to be reflective of the company's core business operations.
Wells Fargo VIRTUAL 2020 Industrials Conference 5/6/20 35Adjustments Detail
(a) Inventory-related charges reflect the following in fiscal 2020: charges recorded in cost of goods sold that reflect product line and SKU
rationalization at our Consumer segment, as well as inventory write-offs in connection with restructuring activities at our Construction
Products, Performance Coatings, and Specialty Products segments. Following are the inventory-related charges in fiscal 2019: charges
reflecting a true-up of fiscal 2018 inventory write-offs at our Consumer Segment during the first quarter of fiscal 2019 and inventory write-
offs and disposals at our Construction Products and Performance Coatings segments.
(b) Reflects restructuring charges, including headcount reductions, closures of facilities and related costs, and accelerated vesting of equity
awards in connection with key executives, all in relation to our 2020 Margin Acceleration Plan (“2020 MAP to Growth”).
(c) Includes accelerated depreciation and amortization expense related to the shortened useful lives of facilities and equipment, ERP systems,
and intangible that are currently in use, but are in the process of being retired associated with various 2020 MAP to Growth initiatives
including facility closures, exiting a business, and ERP consolidation.
(d) Reflects the increase in our allowance for doubtful accounts deemed uncollectible as a result of a change in market and leadership
strategy, offset by subsequent collections.
(e) Includes implementation costs associated with the current phase of our ERP consolidation plan.
(f) Comprises professional fees incurred in connection with our restructuring plan as well as the negotiation of a cooperation agreement and
related fees incurred in connection with hosting an investor conference, all of which have been incurred in relation to our 2020 MAP to
Growth.
(g) Acquisition costs reflect amounts included in gross profit for inventory step-ups as well as an inventory write-off recorded during the
second quarter of fiscal 2019.
(h) Reflects the loss on redemption of our convertible notes incurred during the second quarter of fiscal 2019.
(i) Includes adjustments to the fair value of contingent earnout obligations recorded during the second quarter of fiscal 2019.
(j) Reflects other expense associated with a change in ownership of a business in South Africa, as required by local legislation in order to
qualify for doing business in South Africa.
(k) Reflects unusual compensation costs recorded during fiscal 2020 that resulted from executive departures related to our 2020 MAP to
Growth, including stock and deferred compensation plan arrangements.
(l) Reflects the gain or loss incurred upon divestiture of businesses and/or assets.
(m) Reflects charges related to the discontinuation of a product line targeting OEM markets and related prepaid asset and inventory write-off.
This resulted from of ongoing product line rationalization efforts in connection with our 2020 MAP to Growth.
(n) Investment returns include realized net gains and losses on sales of investments and unrealized net gains and losses on equity securities,
which are adjusted due to their inherent volatility. Management does not consider these gains and losses, which cannot be predicted with
any level of certainty, to be reflective of the company's core business operations.
Wells Fargo VIRTUAL 2020 Industrials Conference 5/6/20 36EBIT* (Non-GAAP Measure): RPM Consolidated
(As Reported)
($ in thousands, except per share and percent data)
(Unaudited)
Three months ended
February 29, 2020 February 28, 2019
Net Income $ 12,090 $ 14,496
Provision (Benefit) for Income Taxes 4,218 (10,032)
Income Before Income Taxes 16,308 4,464
Interest Expense 23,972 26,525
Investment (Income) Loss, Net 3,836 (4,726)
EBIT* (non-GAAP measure) 44,116 26,263
Inventory-related charges (a) 483 1,856
Restructuring expense (b) 7,662 8,679
Accelerated expense - other (c) 1,706 (1,107)
Receivable write-offs (d) (440) 57
ERP consolidation plan (e) 2,445 1,558
Professional fees (f) 3,196 7,805
Acquisition-related costs (g) 271 60
Unusual costs triggered by executive departures (k) 87 1,680
Divestitures (l) 925 (497)
Adjusted EBIT** $ 60,451 $ 46,354
Net Sales $ 1,173,976 $ 1,140,630
EBIT* as a % of Net Sales (non-GAAP measure) 3.8% 2.3%
Adj. EBIT** as a % of Net Sales (non-GAAP measure) 5.1% 4.1%
*EBIT is defined as earnings (loss) before interest and taxes. Management uses EBIT, as defined, as a measure of operating performance,
since interest expense, net, essentially relates to corporate functions, as opposed to segment operations.
**Adjusted EBIT is provided for the purpose of adjusting for one-off items impacting revenue and/or expenses that are not considered by
management to be indicative of ongoing operations.
NOTE: Refer to the Adjustments Detail slide in the appendix of this presentation for all adjustments detail.
Wells Fargo VIRTUAL 2020 Industrials Conference 5/6/20 37EBIT* (Non-GAAP Measure): RPM Consolidated
(As Reported)
($ in thousands, except per share and percent data)
(Unaudited) Nine months ended
February 29, 2020 February 28, 2019
Net Income $ 195,907 $ 133,855
Provision for Income Taxes 65,002 29,140
Income Before Income Taxes 260,909 162,995
Interest Expense 78,630 74,058
Investment (Income), Net (10,354) (126)
EBIT* (non-GAAP measure) 329,185 236,927
Inventory-related charges (a) 9,290 9,787
Restructuring expense (b) 19,591 36,479
Accelerated expense - other (c) 10,170 5,225
Receivable write-offs (d) 2,787 6,784
ERP consolidation plan (e) 8,689 3,408
Professional fees (f) 16,122 17,293
Acquisition-related costs (g) 854 2,991
Convertible debt extinguishment (h) - 3,052
Fair value adjustments to acquisition earnout (i) - 2,395
Loss on South Africa Business EE (j) - 540
Unusual costs triggered by executive departures (k) 726 1,680
Divestitures (l) 661 (497)
Discontinued product line (m) 8,618 -
Adjusted EBIT** $ 406,693 $ 326,064
Net Sales $ 4,048,033 $ 3,963,150
EBIT* as a % of Net Sales (non-GAAP measure) 8.1% 6.0%
Adj. EBIT** as a % of Net Sales (non-GAAP measure) 10.0% 8.2%
*EBIT is defined as earnings (loss) before interest and taxes. Management uses EBIT, as defined, as a measure of operating performance,
since interest expense, net, essentially relates to corporate functions, as opposed to segment operations.
**Adjusted EBIT is provided for the purpose of adjusting for one-off items impacting revenue and/or expenses that are not considered by
management to be indicative of ongoing operations.
NOTE: Refer to the Adjustments Detail slide in the appendix of this presentation for all adjustments detail.
Wells Fargo VIRTUAL 2020 Industrials Conference 5/6/20 38Reconciliation of "Reported" to "Adjusted" EPS
(Unaudited)
Three months ended
February 29, 2020 February 28, 2019
Reconciliation of Reported Earnings per Diluted Share to Adjusted
Earnings per Diluted Share (All amounts presented after-tax):
Reported Earnings per Diluted Share $ 0.09 $ 0.11
Inventory-related charges (a) - 0.01
Restructuring expense (b) 0.05 0.05
Accelerated expense - other (c) 0.01 (0.01)
ERP consolidation plan (e) 0.01 0.01
Professional fees (f) 0.02 0.04
Unusual costs triggered by executive departures (k) - 0.01
Divestitures (l) 0.01 -
Investment returns (n) 0.04 (0.01)
Discrete tax adjustment (o) - (0.08)
Adjusted Earnings per Diluted Share (p) $ 0.23 $ 0.13
(o) Represents discrete tax adjustments due to U.S. income tax reform.
(p) Adjusted EPS is provided for the purpose of adjusting diluted earnings per share for items impacting earnings that are not
considered by management to be indicative of ongoing operations.
NOTE: Refer 7 for all adjustment
slideAdjustments
Refer to the detail
Detail slide in the appendix of this presentation for all adjustments detail.
Wells Fargo VIRTUAL 2020 Industrials Conference 5/6/20 39Reconciliation of "Reported" to "Adjusted" EPS
(Unaudited)
Nine months ended
February 29, 2020 February 28, 2019
Reconciliation of Reported Earnings per Diluted Share to Adjusted
Earnings per Diluted Share (All amounts presented after-tax):
Reported Earnings per Diluted Share $ 1.50 $ 1.00
Inventory-related charges (a) 0.06 0.07
Restructuring expense (b) 0.12 0.21
Accelerated expense - other (c) 0.06 0.03
Receivable write-offs (d) 0.02 0.05
ERP consolidation plan (e) 0.05 0.02
Professional fees (f) 0.09 0.10
Acquisition-related costs (g) 0.01 0.02
Fair value adjustments to acquisition earnout (i) - 0.01
Unusual costs triggered by executive departures (k) - 0.01
Discontinued product line (m) 0.05 -
Investment returns (n) (0.02) 0.05
Discrete tax adjustment (o) - (0.08)
Adjusted Earnings per Diluted Share (p) $ 1.94 $ 1.49
(o) Represents discrete tax adjustments due to U.S. income tax reform.
(p) Adjusted EPS is provided for the purpose of adjusting diluted earnings per share for items impacting earnings that are not
considered by management to be indicative of ongoing operations.
NOTE: Refer to the Adjustments Detail slide in the appendix of this presentation for all adjustments detail.
NOTE: Refer to slide 7 for all adjustment detail
Wells Fargo VIRTUAL 2020 Industrials Conference 5/6/20 40EBIT** (Non-GAAP Measure): Construction Products Segment
(As Reported)
($ in thousands and percent data)
(Unaudited)
Three months ended
February 29, 2020 February 28, 2019
(Loss) Before Income Taxes $ (478) $ (4,025)
Add: Interest Expense, Net* 2,130 2,489
EBIT** (non-GAAP measure) 1,652 (1,536)
Inventory-related charges (a) 76 158
Restructuring expense (b) 3,053 2,056
Accelerated expense - other (c) 942 (1,890)
Receivable write-offs (d) (33) -
ERP consolidation plan (e) 267 702
Professional fees (f) 78 118
Acquisition-related costs (g) - 60
Adjusted EBIT*** $ 6,035 $ (332)
Net Sales $ 372,082 $ 355,332
EBIT** as a % of Net Sales (non-GAAP measure) 0.4% (0.4%)
Adj. EBIT*** as a % of Net Sales (non-GAAP measure) 1.6% (0.1%)
*Interest expense, net includes the combination of interest (income) expense and investment (income) expense, net.
**EBIT is defined as earnings (loss) before interest and taxes. Management uses EBIT, as defined, as a measure of operating performance,
since interest expense, net, essentially relates to corporate functions, as opposed to segment operations.
***Adjusted EBIT is provided for the purpose of adjusting for one-off items impacting revenue and/or expenses that are not considered by
management to be indicative of ongoing operations.
NOTE: Refer to the Adjustments Detail slide in the appendix of this presentation for all adjustments detail.
Wells Fargo VIRTUAL 2020 Industrials Conference 5/6/20 41EBIT** (Non-GAAP Measure): Construction Products Segment
(As Reported)
($ in thousands and percent data)
(Unaudited)
Nine months ended
February 29, 2020 February 28, 2019
Income Before Income Taxes $ 139,324 $ 96,375
Add: Interest Expense, Net* 6,231 6,968
EBIT** (non-GAAP measure) 145,555 103,343
Inventory-related charges (a) 346 707
Restructuring expense (b) 6,005 8,813
Accelerated expense - other (c) 1,582 (1,823)
Receivable write-offs (d) - -
ERP consolidation plan (e) 621 1,094
Professional fees (f) 157 118
Acquisition-related costs (g) 548 1,168
Adjusted EBIT*** $ 154,814 $ 113,420
Net Sales $ 1,407,697 $ 1,340,122
EBIT** as a % of Net Sales (non-GAAP measure) 10.3% 7.7%
Adj. EBIT*** as a % of Net Sales (non-GAAP measure) 11.0% 8.5%
*Interest expense, net includes the combination of interest (income) expense and investment (income) expense, net.
**EBIT is defined as earnings (loss) before interest and taxes. Management uses EBIT, as defined, as a measure of operating performance,
since interest expense, net, essentially relates to corporate functions, as opposed to segment operations.
***Adjusted EBIT is provided for the purpose of adjusting for one-off items impacting revenue and/or expenses that are not considered by
management to be indicative of ongoing operations.
NOTE: Refer to the Adjustments Detail slide in the appendix of this presentation for all adjustments detail.
Wells Fargo VIRTUAL 2020 Industrials Conference 5/6/20 42EBIT** (Non-GAAP Measure): Performance Coatings Segment
(As Reported)
($ in thousands and percent data)
(Unaudited)
Three months ended
February 29, 2020 February 28, 2019
Income Before Income Taxes $ 22,240 $ 14,365
Add: Interest Expense (Income), Net* (123) 62
EBIT** (non-GAAP measure) 22,117 14,427
Inventory-related charges (a) 123 911
Restructuring expense (b) 1,362 2,805
Accelerated expense - other (c) 476 18
Receivable write-offs (d) (407) (6)
ERP consolidation plan (e) 151 -
Professional fees (f) 275 -
Acquisition-related costs (g) 83 -
Adjusted EBIT*** $ 24,180 $ 18,155
Net Sales $ 255,686 $ 253,225
EBIT** as a % of Net Sales (non-GAAP measure) 8.7% 5.7%
Adj. EBIT*** as a % of Net Sales (non-GAAP measure) 9.5% 7.2%
*Interest expense (income), net includes the combination of interest expense (income) and investment expense (income), net.
**EBIT is defined as earnings (loss) before interest and taxes. Management uses EBIT, as defined, as a measure of operating performance,
since interest expense, net, essentially relates to corporate functions, as opposed to segment operations.
***Adjusted EBIT is provided for the purpose of adjusting for one-off items impacting revenue and/or expenses that are not considered by
management to be indicative of ongoing operations.
NOTE: Refer to the Adjustments Detail slide in the appendix of this presentation for all adjustments detail.
Wells Fargo VIRTUAL 2020 Industrials Conference 5/6/20 43EBIT** (Non-GAAP Measure): Performance Coatings Segment
(As Reported)
($ in thousands and percent data)
(Unaudited)
Nine months ended
February 29, 2020 February 28, 2019
Income Before Income Taxes $ 83,617 $ 44,990
Add: Interest Expense (Income), Net* (20) 401
EBIT** (non-GAAP measure) 83,597 45,391
Inventory-related charges (a) 3,190 7,472
Restructuring expense (b) 5,210 8,840
Accelerated expense - other (c) 2,296 5,684
Receivable write-offs (d) 2,732 6,721
ERP consolidation plan (e) 648 348
Professional fees (f) 582 -
Acquisition-related costs (g) 118 1,823
Fair value adjustments to acquisition earnout (i) - 2,395
Loss on South Africa Business EE (j) - 540
Divestitures (l) (264) -
Adjusted EBIT*** $ 98,109 $ 79,214
Net Sales $ 845,639 $ 841,605
EBIT** as a % of Net Sales (non-GAAP measure) 9.9% 5.4%
Adj. EBIT*** as a % of Net Sales (non-GAAP measure) 11.6% 9.4%
*Interest expense (income), net includes the combination of interest expense (income) and investment expense (income), net.
**EBIT is defined as earnings (loss) before interest and taxes. Management uses EBIT, as defined, as a measure of operating performance,
since interest expense, net, essentially relates to corporate functions, as opposed to segment operations.
***Adjusted EBIT is provided for the purpose of adjusting for one-off items impacting revenue and/or expenses that are not considered by
management to be indicative of ongoing operations.
NOTE: Refer to the Adjustments Detail slide in the appendix of this presentation for all adjustments detail.
Wells Fargo VIRTUAL 2020 Industrials Conference 5/6/20 44EBIT** (Non-GAAP Measure): Consumer Segment
(As Reported)
($ in thousands and percent data)
(Unaudited)
Three months ended
February 29, 2020 February 28, 2019
Income Before Income Taxes $ 29,798 $ 25,272
Add: Interest Expense, Net* 57 119
EBIT** (non-GAAP measure) 29,855 25,391
Inventory-related charges (a) 198 787
Restructuring expense (b) 1,016 1,229
Accelerated expense - other (c) - -
Receivable write-offs (d) - 63
ERP consolidation plan (e) 72 -
Professional fees (f) 80 -
Divestitures (l) 925 (497)
Discontinued product line (m) $ - $ -
Adjusted EBIT*** $ 32,146 $ 26,973
Net Sales $ 398,743 $ 378,313
EBIT** as a % of Net Sales (non-GAAP measure) 7.5% 6.7%
Adj. EBIT*** as a % of Net Sales (non-GAAP measure) 8.1% 7.1%
*Interest expense, net includes the combination of interest expense (income) and investment expense (income), net.
**EBIT is defined as earnings (loss) before interest and taxes. Management uses EBIT, as defined, as a measure of operating performance,
since interest expense, net, essentially relates to corporate functions, as opposed to segment operations.
***Adjusted EBIT is provided for the purpose of adjusting for one-off items impacting revenue and/or expenses that are not considered by
management to be indicative of ongoing operations.
NOTE: Refer to the Adjustments Detail slide in the appendix of this presentation for all adjustments detail.
Wells Fargo VIRTUAL 2020 Industrials Conference 5/6/20 45EBIT** (Non-GAAP Measure): Consumer Segment
(As Reported)
($ in thousands and percent data)
(Unaudited)
Nine months ended
February 29, 2020 February 28, 2019
Income Before Income Taxes $ 123,413 $ 118,078
Add: Interest Expense, Net* 219 417
EBIT** (non-GAAP measure) 123,632 118,495
Inventory-related charges (a) 5,668 1,608
Restructuring expense (b) 3,422 2,429
Accelerated expense - other (c) 5,624 -
Receivable write-offs (d) 55 63
ERP consolidation plan (e) 197 -
Professional fees (f) 385 -
Divestitures (l) 925 (497)
Discontinued product line (m) $ 8,618 $ -
Adjusted EBIT*** $ 148,526 $ 122,098
Net Sales $ 1,328,974 $ 1,280,931
EBIT** as a % of Net Sales (non-GAAP measure) 9.3% 9.3%
Adj. EBIT*** as a % of Net Sales (non-GAAP measure) 11.2% 9.5%
*Interest expense, net includes the combination of interest expense (income) and investment expense (income), net.
**EBIT is defined as earnings (loss) before interest and taxes. Management uses EBIT, as defined, as a measure of operating performance,
since interest expense, net, essentially relates to corporate functions, as opposed to segment operations.
***Adjusted EBIT is provided for the purpose of adjusting for one-off items impacting revenue and/or expenses that are not considered by
management to be indicative of ongoing operations.
NOTE: Refer to the Adjustments Detail slide in the appendix of this presentation for all adjustments detail.
Wells Fargo VIRTUAL 2020 Industrials Conference 5/6/20 46EBIT** (Non-GAAP Measure): Specialty Segment
(As Reported)
($ in thousands and percent data)
(Unaudited)
Three months ended
February 29, 2020 February 28, 2019
Income Before Income Taxes $ 12,942 $ 16,115
Add: Interest Expense (Income), Net* 24 (135)
EBIT** (non-GAAP measure) 12,966 15,980
Inventory-related charges (a) 86 -
Restructuring expense (b) 999 2,564
Accelerated expense - other (c) 160 765
ERP consolidation plan (e) 1,955 856
Professional fees (f) 1,169 -
Acquisition-related costs (g) 188 -
Adjusted EBIT*** $ 17,523 $ 20,165
Net Sales $ 147,465 $ 153,760
EBIT** as a % of Net Sales (non-GAAP measure) 8.8% 10.4%
Adj. EBIT*** as a % of Net Sales (non-GAAP measure) 11.9% 13.1%
*Interest expense (income), net includes the combination of interest expense (income) and investment expense (income), net.
**EBIT is defined as earnings (loss) before interest and taxes. Management uses EBIT, as defined, as a measure of operating performance,
since interest expense, net, essentially relates to corporate functions, as opposed to segment operations.
***Adjusted EBIT is provided for the purpose of adjusting for one-off items impacting revenue and/or expenses that are not considered by
management to be indicative of ongoing operations.
NOTE: Refer to the Adjustments Detail slide in the appendix of this presentation for all adjustments detail.
Wells Fargo VIRTUAL 2020 Industrials Conference 5/6/20 47EBIT** (Non-GAAP Measure): Specialty Segment
(As Reported)
($ in thousands and percent data)
(Unaudited)
Nine months ended
February 29, 2020 February 28, 2019
Income Before Income Taxes $ 55,031 $ 66,049
Add: Interest Expense (Income), Net* 6 (332)
EBIT** (non-GAAP measure) 55,037 65,717
Inventory-related charges (a) 86 -
Restructuring expense (b) 3,707 6,312
Accelerated expense - other (c) 476 1,364
ERP consolidation plan (e) 7,223 1,966
Professional fees (f) 2,148 -
Acquisition-related costs (g) 188 -
Unusual costs triggered by executive departures (k) 473 -
Adjusted EBIT*** $ 69,338 $ 75,359
Net Sales $ 465,723 $ 500,492
EBIT** as a % of Net Sales (non-GAAP measure) 11.8% 13.1%
Adj. EBIT*** as a % of Net Sales (non-GAAP measure) 14.9% 15.1%
*Interest expense (income), net includes the combination of interest expense (income) and investment expense (income), net.
**EBIT is defined as earnings (loss) before interest and taxes. Management uses EBIT, as defined, as a measure of operating performance,
since interest expense, net, essentially relates to corporate functions, as opposed to segment operations.
***Adjusted EBIT is provided for the purpose of adjusting for one-off items impacting revenue and/or expenses that are not considered by
management to be indicative of ongoing operations.
NOTE: Refer to the Adjustments Detail slide in the appendix of this presentation for all adjustments detail.
Wells Fargo VIRTUAL 2020 Industrials Conference 5/6/20 48EBIT* & EBITDA (Non-GAAP Measures)
*EBIT is defined as earnings before interest and taxes, while EBITDA is
(In thousands) defined as earnings before interest, taxes, depreciation and
2015 (2) 2016 2017 2018 2019
amortization. We evaluate the profit performance of our segments
Net income $ 228,328 $ 357,458 $ 184,671 $ 339,257 $ 267,687 based on income before income taxes, but also look to EBIT as a
Add: Provision (benefit) for income taxes 224,925 126,008 59,662 77,791 72,158 performance evaluation measure because interest expense is
Add: Interest expense 87,615 91,683 96,954 104,547 102,392 essentially related to acquisitions, as opposed to segment operations.
We believe EBIT is useful to investors for this purpose as well, using
Add: Investment expense (income), net (18,577) (10,365) (13,984) (20,442) (730)
EBIT as a metric in their investment decisions. EBIT should not be
Add: 2020 MAP to Growth related initiatives 58,080 106,475
considered an alternative to, or more meaningful than, income before
Add: Acquisition-related charges 5,385 income taxes as determined in accordance with GAAP, since it omits the
Add: Convertible debt extinguishment 3,052 impact of interest and taxes in determining operating performance,
Add: Loss on South Africa Business 540 which represent items necessary to our continued operations, given our
Add: Unusual costs triggered by executive departures 10,520 level of indebtedness and ongoing tax obligations. We evaluate our
Add: Charge to exit Flowcrete China 4,164 liquidity based on cash flows from operating, investing and financing
activities, as defined by GAAP, but also look to EBITDA as a
Add: Charge to exit Flowcrete Middle East 12,275
supplemental liquidity measure, because we find it useful to
Add: Goodwill and other intangible asset impairments 188,298
understand and evaluate our capacity, excluding the impact of interest,
Add: Severance expense 15,001 taxes, and non-cash depreciation and amortization charges, for
Adjusted EBIT * (non-GAAP measure) 522,291 564,784 542,877 563,397 567,479 servicing our debt and otherwise meeting our cash needs, prior to our
Add: Amortization 36,988 44,307 44,903 46,523 47,699 consideration of the impacts of other potential sources and uses of cash
such as working capital items. We believe that EBITDA is useful to
Adjusted EBITA * (non-GAAP measure) 559,279 609,091 587,780 609,920 615,178 investors for these purposes as well. EBITDA should not be considered
Add: Depreciation 62,188 66,732 71,870 81,976 94,043 an alternative to, or more meaningful than, cash flows from operating
activities, as determined in accordance with GAAP, since it omits the
Adjusted EBITDA * (non-GAAP measure) 621,467 675,823 659,650 691,896 709,221
impact of interest, taxes and changes in working capital that
Deduct: Interest expense (87,615) (91,683) (96,954) (104,547) (102,392) use/provide cash (such as receivables, payables, and inventories) as
Deduct: Investment expense (income), net 18,577 10,365 13,984 20,442 730 well as the sources/uses of cash associated with changes in other
balance sheet items (such as long-term loss accruals and deferred
Deduct: Provision (benefit) for income taxes (224,925) 126,008 (59,662) (77,791) (72,158)
items). Since EBITDA excludes depreciation and amortization, EBITDA
Add: Changes in operating assets, liabilities and other 2,944 6,209 (130,891) (139,617) (242,460) does not reflect any cash requirements for the replacement of the
Cash from operating activities $ 330,448 $ 474,706 $ 386,127 $ 390,383 $ 292,941 assets being depreciated and amortized, which assets will often have to
Net sales $4,594,550 $4,813,649 $4,958,175 $5,321,643 $5,564,551 be replaced in the future. Further, EBITDA, since it also does not reflect
the impact of debt service, cash dividends or capital expenditures, does
Adjusted EBITA * as % of net sales (non-GAAP measure) 12.2% 12.7% 11.9% 11.5% 11.1% not represent how much discretionary cash we have available for other
Adjusted EBITDA * as % of net sales (non-GAAP measure) 13.5% 14.0% 13.3% 13.0% 12.7% purposes. Nonetheless, EBIT and EBITDA are key measures expected by
and useful to our fixed income investors, rating agencies and the
banking community of all of whom believe, and we concur that these
measures are critical to the capital markets' analysis of (i) our segments
1. Proforma, excluding one-time charges detailed in noted additions above. core operating performance, and (ii) our ability to service debt, fund
2. Reflects adjustments related to the recognition of ASC 740-30 tax liability for the potential repatriation of capital expenditures and otherwise meet cash needs, respectively. We
foreign earnings and related impact on NCI Net Income. also evaluate EBIT and EBITDA because it is clear that movements in
these non-GAAP measures impact our ability to attract financing. Our
underwriters and bankers consistently require inclusion of these two
measures in offering memoranda in conjunction with any debt
underwriting or bank financing.
Wells Fargo VIRTUAL 2020 Industrials Conference 5/6/20 49You can also read