Robots, labor markets, and universal basic income - UCL ...
←
→
Page content transcription
If your browser does not render page correctly, please read the page content below

ARTICLE
                  https://doi.org/10.1057/s41599-020-00676-8              OPEN

                  Robots, labor markets, and universal basic income
                  Antonio Cabrales1,2, Penélope Hernández2,3 & Angel Sánchez                             2,4,5,6 ✉

                  Automation is a big concern in modern societies in view of its widespread impact on many
                  socioeconomic issues including income, jobs, and productivity. While previous studies have
                  concentrated on determining the effects on jobs and salaries, our aim is to understand how
1234567890():,;

                  automation affects productivity, and how some policies, such as taxes on robots or universal
                  basic income, moderate or aggravate those effects. To this end, we have designed an
                  experiment where workers make productive effort decisions, and managers can choose
                  between workers and robots to do these tasks. In our baseline treatment, we measure the
                  effort made by workers who may be replaced by robots, and also elicit firm replacement
                  decisions. Subsequently, we carry out treatments in which workers have a universal basic
                  income of about a fifth of the workers’ median wages, or where there is a tax levy on firms
                  who replace workers by robots. We complete the picture of the impact of automation by
                  looking into the coexistence of workers and robots with part-time jobs. We find that the
                  threat of a robot substitution does not affect the amount of effort exerted by workers. Also,
                  neither universal basic income nor a tax on robots decrease workers’ effort. We observe that
                  the robot substitution tax reduces the probability of worker substitution. Finally, workers that
                  benefit from managerial decisions to not substitute them by more productive robots do not
                  increase their effort level. Our conclusions shed light on the interplay of policy and workers
                  behavior under pervasive automation.

                  1 Departamento de Economía, Universidad Carlos III de Madrid, 28903 Getafe, Spain. 2 Unidad Mixta Interdisciplinar de Comportamiento y Complejidad

                  Social (UMICCS), UC3M-UV-UZ, Getafe, Spain. 3 LINEEX/Departament d’Economía, Universitat de València, València, Spain. 4 GISC/Departamento de
                  Matemáticas, Universidad Carlos III de Madrid, 28911 Leganés, Spain. 5 Instituto de Biocomputación y Física de Sistemas Complejos, Universidad de
                  Zaragoza, 50015 Zaragoza, Spain. 6 UC3M Santander Institute for Big Data (IBiDat), Universidad Carlos III de Madrid, 28903 Getafe, Spain.
                  ✉email: anxo@math.uc3m.es

                  HUMANITIES AND SOCIAL SCIENCES COMMUNICATIONS | (2020)7:185 | https://doi.org/10.1057/s41599-020-00676-8                                             1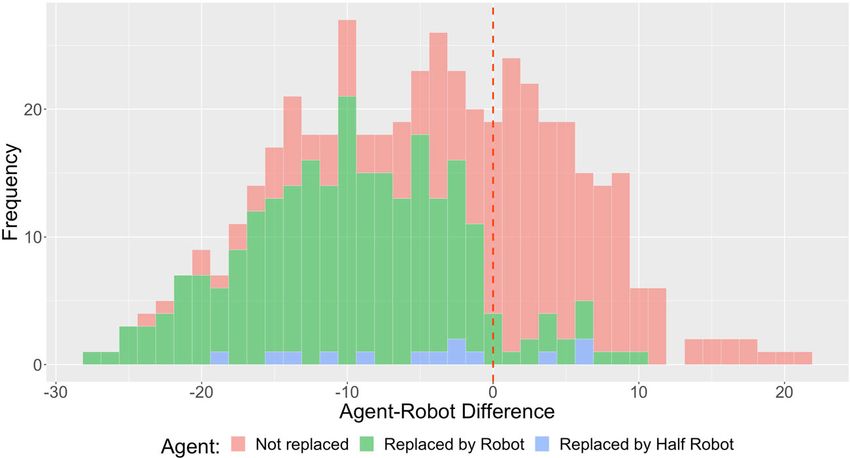
ARTICLE                               HUMANITIES AND SOCIAL SCIENCES COMMUNICATIONS | https://doi.org/10.1057/s41599-020-00676-8

T
Introduction
        he rapidly growing wave of automation is submitting our          accordance with its intended goal. Interestingly, workers that are
        society to large changes of profound consequences.               not substituted by a more productive robot do not increase their
        Undoubtedly, the availability of a cheaper, more efficient        effort subsequently, as theories of reciprocal altruism would
workforce of robots will affect every aspect of our socioeconomic        suggest. In light of these results, the issue on the impact of
life, from welfare to job opportunities and conditions through           establishing universal income or robot taxes need further con-
markets and businesses. In this context, there is a growing con-         sideration both by researchers and policy makers.
cern about optimal policy responses to the challenges associated
with those social and economic effects. Indeed, there is an
emerging research field on this topic showing the impacts of              Experimental design and methods
automation on society. For instance, Frey and Osborne (2013)             To address the issue of the impact of automation on productivity
estimate that 47% of current US jobs are at risk from automation.        under different policies, we recruited 900 individuals to take part
The World Bank (2016) also estimates that about 57% of current           in an experiment with 9 treatments. The sample were 59% female,
jobs in the whole OECD could be automated in the coming                  and 98% university students. The mean age was 21, with a
decades. On the other hand, Arntz et al. (2016) argue that these         minimum of 19 and a maximum of 30. In our recruitment we
figures could be overestimated in so far as they do not take into         tried to recruit students from diverse fields to be representative of
account the fact that workers will specialize in hard-to-automate        future graduate labor markets. Instructions in Spanish, exactly as
jobs; in that case, we would experience a lower, but still very          they were provided to the participants, and their translation into
relevant, loss of 9% of jobs within OECD countries. This and             English, are provided in the Supporting Information.
related research points to the sizable effects that automation may          The experiment was designed as follows: We begin by asking
have on the job market.                                                  the participants to work on a set of tasks (counting letters in a text
   A specially relevant question has been posed by Acemoglu and          and adding up integer numbers, see SI) and as a result they
Restrepo (2017) who analyzed the impact of robots and auto-              receive a monetary payment as a function of their performance.
mation on jobs and salaries. They estimate that for each extra           Except in the control treatment, after this first stage participants
robot per 1000 workers, jobs will decrease between 0.18% and             may go to a second one or they may be substituted by a robot in a
0.34% and salaries will also decrease between 0.25% and 0.5%.            manner we discuss below. If they do proceed to the second stage,
Further, the study (Autor and Salomons, 2018) considered the             they perform a similar task and accumulate their corresponding
impact of automation on employment and salaries with data from           payment, their earnings from the experiment being the sum of the
19 developed countries over four decades. They find a net positive        money obtained in the two stages plus a show up fee. If they are
effect on employment, even if the direct effect on the affected          substituted, they neither perform any task nor receive any pay-
sector is negative. On the other hand, the net effect on salaries is     ment from this second stage. In the control treatment, partici-
negative. For this reason, they argue that policies should concern       pants always proceed to the second stage. All this is made known
themselves with the distributional aspects of technological change       to the participants from the beginning.
rather than with job losses.                                                Preliminary pilots and the control treatments were used to
   These previous studies have concentrated on determining the           obtain the effort distribution in the first task, from which random
effects on jobs and salaries. To shed light on the impact of             robots were sampled in the rest of the treatments as we discuss in
automation from a complementary viewpoint, we here aim to                the following. The replacement of robots by workers is done in
understanding the effects of automation on productivity, and also        two different forms, giving rise to two corresponding treatments:
to determining the effects of some proposed policies, such as taxes      exogenous and endogenous. In the exogenous treatment, a robot
on robots or universal basic income, on productivity and on              is randomly selected to be compared with every worker. Robots
firms’ decisions. Addressing these issues from a standard                 are individually and randomly associated to each different indi-
empirical methodology is not possible, as those policies have not        vidual. Then, the output of the participant is compared with that
been trialed in the field. Also, productivity is notoriously difficult     of its assigned robot, which is random but on average superior to
to measure under standard field conditions because of lack of             that of an average participant (calibrated in pilots prior to the
control. Therefore, we have designed an experiment in which              experiment, as well as with the control treatment). If the assigned
workers make productive effort decisions, and managers can               robot has higher productivity than the participant, with prob-
choose between workers and robots to do these tasks. In our              ability 90% the latter is substituted and does not proceed to the
baseline treatment, we measure the effort made by workers who            second stage.
may be replaced by robots who are on average more productive                In the endogenous treatment, the participants are randomly
than themselves, and we also monitor firm replacement decisions.          classified as type A or type B independently of their performance
Once the baseline results are established, we look at how they           in the first stage. Subjects of type B play the role of employees and
change when workers can access a universal basic income of               subjects of type A play the role of managers. Each A subject has
about a fifth of the workers’ median wages, as in a pilot experi-         several B subjects of whom she is responsible. Before the second
ment in Finland (Kangas et al., 2019). We then go on to study the        stage starts, A subjects decide, knowing the production of each of
effect of taxes imposed on firms that replace a worker by a robot.        the B subjects she manages, and the productivity of a randomly
In a last treatment, we consider a situation in which workers and        assigned robot, if the subject is replaced or not. Managers also
robots coexist with the option of choosing to work part-time.            work during the second stage so participants in the lab can not
   Our specifically designed experimental setup allows us to draw         identify who is a manager. A subjects earn the result of their own
several conclusions that can be relevant for policy making on this       production plus an amount that is proportional to the production
issue. First, and contrary to what standard theoretical arguments        of their teams, while B subjects only receive the earnings from
would predict, the threat of a robot substitution does not affect        their own effort. In addition to these treatments, both in the
the amount of effort exerted by workers. Second, neither universal       exogenous and endogenous condition we have a number of ses-
basic income, nor the tax levied on firms when they replace a             sions in which all participants receive a universal basic income
worker by a robot decrease workers’ effort, again in contradiction       that is independent of their productivity. The value of the
with theoretical predictions. Third, the robot substitution tax          universal basic income used in the experiment is obtained
does indeed reduce the probability of worker substitution in             dividing by 5 the median output in the control treatment.

2                        HUMANITIES AND SOCIAL SCIENCES COMMUNICATIONS | (2020)7:185 | https://doi.org/10.1057/s41599-020-00676-8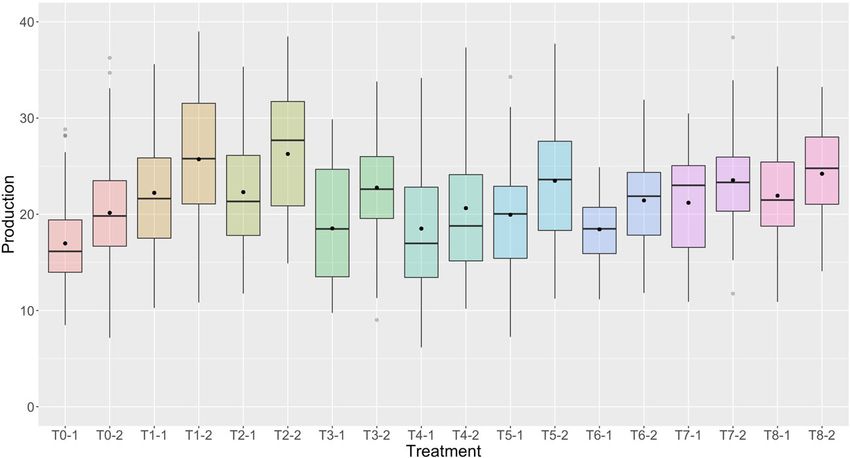
HUMANITIES AND SOCIAL SCIENCES COMMUNICATIONS | https://doi.org/10.1057/s41599-020-00676-8                                                      ARTICLE

This computation follows the spirit of the pilot experiment in              there is virtually no time between periods in our experiment. In
Finland where median salary is about 3000 euros a month and the             addition, we consider that the probability that an agent is not
amount of basic income in the experiment was about 600 euros                replaced by a robot in the second stage is a function of her output
(Kangas et al., 2019). Therefore, given that median output of               in the first one, pðbi ei1 Þ. With this, and including when present
subjects’ work in the control treatment was 16.15 euros, we                 the amount of universal basic income, B, the total utility is
introduced a basic income of 3.4 euros in our experiment. For
                                                                                               1                       1
comparison, the median earnings of participants in our experi-                     U bi ei1  e2i1 þ U         bi ei2  e2i2 pðbi ei1 Þ þ B
                                                                                               2                       2
ment were approximately 12 euros, so the basic income was a
significant contribution when applicable, but not the main one. In           The maximization of this utility as a function of the effort exerted
the endogenous treatment, we also carried out sessions in which             in the first period, ei1, requires
the replacement of a worker by a robot was subjected to a tax.
                                                                                                 U 0 bi ei1  12 e2i1 ðbi  ei1 Þ
Finally, another variant of the endogenous treatment allowed                                                                                ð1Þ
managers to offer workers in their team a part-time contract.                        þ U 0 bi ei2  12 e2i2 pðbi ei1 Þ þ B p0 ðbi ei1 Þbi ¼ 0
Details of the implementation of the tax and on the part-time               which can be written compactly as
contract are included in the SI. The combination of all these
treatments allows us to study the independent or combined                                                         F ðei1 ; BÞ ¼ 0
effects of the different policies (tax, basic income, and part-time         This means that we can write
work) both when the replacement is endogenous and when it is
                                                                                                                ∂ei1 ðBÞ   F
exogenous (where that is relevant).                                                                                      ¼ B                                 ð2Þ
   In summary, the nine treatments considered were the following                                                  ∂B       F ei1
ones:
                                                                            with
●   T0, Baseline (control group): 60 subjects.
                                                                                                     00     1 2
●   T1, Endogenous without basic income and no tax: 120 sub-                            FB ¼ U      bi ei2  ei2 pðbi ei1 Þ þ B p0 ðbi ei1 Þbi                ð3Þ
                                                                                                            2
    jects.
●   T2, Endogenous with basic income and no tax: 120 subjects.                                00
                                                                                F ei1    ¼ U bi ei1  12 e2i1 ðbi  ei1 Þ2  U 0 bi ei1  12 e2i1
●   T3, Endogenous without basic income and tax: 120 subjects.                                   00
●   T4, Endogenous with basic income and tax: 120 subjects.                                  þU bi ei2  12 e2i2 pðbi ei1 Þ þ B ðp0 ðbi ei1 Þbi Þ2            ð4Þ
●   T5, Endogenous without tax and option to work part-time:                                                                      00
                                                                                              þU 0 bi ei2  12 e2i2 pðbi ei1 Þ þ B p ðbi ei1 Þb2i
    120 subjects.
●   T6, Endogenous with tax and option to work part-time:                   Clearly F ei1 < 0 to satisfy second order conditions for max with
    120 subjects.                                                           respect to ei1 Then the sign of ei1 ðBÞ is the sign of FB so that
●   T7, Exogenous without basic income: 60 subjects.                        ei1 ðBÞ < 0 if U is concave. This leads to as to a first hypothesis
●   T8, Exogenous with basic income: 60 subjects.                           based on our theoretical approach:
   The presentation of our design would be incomplete without a
discussion of the limitations of our approach. Obviously, a lab             Hypothesis 1. Effort in the first period decreases with the amount
                                                                            of universal basic income B.
experiment does not reproduce totally real life. At the lab we are
making a stylised projection of the decision frame similar to the              Now, to consider the effect of the probability of being replaced,
                                                                            pðbi ei1 Þ; suppose that pðbi ei1 Þ depends parametrically on a
one that people should face in normal life. This process of
abstraction allows to disentangle the significance of few variables          parameter q. So we have pðbi ei1 ; qÞ: Then the first order condition
instead and of a total representation of real decision; however, it         (Eq. 1) can be written compactly as
can be argued that it is too far away from the real context to draw                                              F ðei1 ; B; qÞ ¼ 0
conclusions. However, the large body of literature on experimental
                                                                            so that
economics has shown that the results from the lab do offer
insights about human behavior in daily life contexts (Levitt and                                               ∂ei1 ðB; qÞ    Fq
                                                                                                                           ¼                                 ð5Þ
List, 2007). In any event, most of the information available on the                                                ∂q         F ei1
issue of interest here comes from surveys which are even further
separated from the respondent’s actual situation. Another feature           with

to take into account is about the monetary incentives that                              00                1 2
experimental subjects could take. While this amount may be                   Fq ¼ U               bi ei2  ei2 pðbi ei1 ; qÞ þ B pbei1 ðbi ei1 ; qÞpq ðbi ei1 ; qÞbi
                                                                                                          2
regarded as small, it is typically calculated so average earnings are
around 15 euros per hour of participation, so it is quite a fair                                                                                              ð6Þ
payment for general participants. Finally, the amount of the                                  00
sample might be a problem, but in our case we have 900 indivi-                   F ei1 ¼ U bi ei1  12 ei1 ðbi  ei1 Þ2  U 0 bi ei1  12 ei1
                                                                                                               2                                   2

duals which should be enough to detect the effects under scrutiny.                         00                                                        2
                                                                                         þU bi ei2  12 e2i2 pðbi ei1 ; qÞ þ B pbei1 ðbi ei1 ; qÞbi

                                                                                         þU 0 bi ei2  12 e2i2 pðbi ei1 Þ þ B pðbei1 Þ2 ðbi ei1 ; qÞb2i
Theoretical framework
In order to provide a reference frame for our experiments, we                                                                                                 ð7Þ
begin by developing a theory of the experiment we have just                 Clearly F ei1
ARTICLE HUMANITIES AND SOCIAL SCIENCES COMMUNICATIONS | https://doi.org/10.1057/s41599-020-00676-8
In summary, our theoretical framework suggests that basic output of subjects in the first phase for treatments with and
income makes workers exert a lower amount of effort, and also without basic income and suggests there are no differences. The
that, when a tax makes her less likely to be replaced, she also t-test for differences in means again confirms there are no sta-
decreases her effort level. We will turn to the comparison of these tistical differences in output between the two types of treatments.
predictions, which on the other hand are quite reasonable in On the other hand, the bottom panel of Fig. 3 presents the
principle, with the results of the experiment. production of participants in the first phase of endogenous
treatment without basic income and without tax with the output
Results of the first phase without basic income and with tax. The amount
Our first result is that the threat of substitution by robots does not implemented as tax in the experiment was 3.4, to be compared
change the productivity of workers, in contradiction with with the average points earned in the baseline production phase
hypothesis 2. Figure 1 shows the production of the first phase for of 17. As with the basic universal income, there are no statistical
all participants in each of the 9 treatments. As can be seen from differences between the output of subjects when there is a tax and
the graph, even if the dispersion varies across treatments, the when there is not. Indeed, Fig. 3 has the same shape as the
means and medians are located almost perfectly on a horizontal, previous one, showing the similarity between the treatments with
straight line. A t-test of difference in means also shows there are and without taxes.
no statistical differences between the outputs of the first phase in Another conclusion that arises from our experimental data is
the different treatments. In particular, there is no difference that a tax on the substitution of workers reduces the likelihood
between the output in the first phase of the baseline treatment, that workers are replaced. It has to be borne in mind that one of
when workers cannot be substituted by robots, and all the other the policies that have been suggested in this situation of auto-
treatments, when the substitution is possible. Hence, we conclude mation (Abbott and Bogenschneider, 2018; Guerreiro et al., 2017)
that there is no effect on effort on the threat of robot substitution. consists precisely in the application of a tax when a human job is
It is important to note for reference that the amount of points replaced by a robot. We measure the impact of the tax using a
earned during this phase is approximately 17 points averaging regression analysis. One of the variables is a dummy for the
over all treatments. presence (or not) of a tax (variable TAXYes), whereas another is a
Looking now at the production in the second phase, depicted dummy for the presence of basic income (variable RBYes), and
in Fig. 2, corresponding to those workers who were not sub- finally we include a dummy for gender (variable SexMMale). The
stituted by robots, we observe an increase in the average output of results from the logit regression are shown on Table 1. The
13.5% with respect to phase 1, with the maximum growth taking negative sign of the variable TAXYes shows that the probability of
place in the treatment without basic income or tax at 18.5%, and replacement is lower when there is a tax. Another variable takes
the minimum growth, 9.5%, for the exogenous treatment without into account the difference in productivity between the robot and
basic income. The increase is quite homogeneous between the human (variable I(ProdRob-Prod1)): its coefficient is positive,
treatments as can be seen from Fig. 2. which means that the higher the productivity difference between
Regarding the effects of universal basic income or taxes, from robot and human, the higher the replacement probability. The
Fig. 1 we can conclude that the output in the first phase of those ratio between the coefficients of the two variables is roughly 4.5,
treatments is statistically the same as that observed in the baseline indicating the productivity differential necessary to compensate a
treatment. This implies that there is no disincentive to effort unit tax for the use of a robot. The 95% confidence interval of the
arising from either basic income or the tax on robots. This is in ratio of coefficients (found via bootstrapping) is (1.06, 8.18).
stark contrast with hypothesis 1 from the standard theoretical We have also considered the possibility that workers that have
benchmark discussed in the previous section. As far as the uni- not being replaced by a robot because of a managerial decision
versal basic income is concerned, further support comes when increase their effort in return. There is a wide literature in
data are aggregated, as shown in Fig. 3, which compares the anthropology, sociology and behavioral economics, (see, e.g.,
Fig. 1 First phase production by treatment. Production is computed as the number of earned points during the first phase of the experiment, and the
horizontal axis indicates the different treatments carried out. Treatments are labeled as follows: T0, Baseline; T1, Endogenous without universal basic
income and tax; T2, Endogenous M2 with universal basic income and without tax; T3, Endogenous M2 without universal basic income and with tax; T4,
Endogenous M2 with universal basic income and tax; T5, Endogenous M3 without universal basic income and tax; T6, Endogenous M3 without universal
basic income and with tax; T7, Exogenous without universal basic income, and T8, Exogenous with universal basic income. Boxes show the mean of the
distribution as a dot and the median as a line, while the box itself indicates the second and third quartiles. Dots are outliers, defined as points beyond 1.5 the
interquartile range, and whiskers show the range of points that are not outliers.
4 HUMANITIES AND SOCIAL SCIENCES COMMUNICATIONS | (2020)7:185 | https://doi.org/10.1057/s41599-020-00676-8HUMANITIES AND SOCIAL SCIENCES COMMUNICATIONS | https://doi.org/10.1057/s41599-020-00676-8 ARTICLE
Fig. 2 Comparison of the production in the two phases by treatment. Production is computed as the number of earned points during the two phases of
the experiment, and the horizontal axis indicates the different treatments carried out. Labels are as in Fig. 1, and the additional 1 or 2 refer to the first and
the second parts of the experiment. Boxes are as in Fig. 1.
Fig. 3 Comparison of aggregated outputs in treatments with and without basic income or tax. Top: Output in the first phase for treatments with basic
income and without basic income. Bottom: Output in the first phase of treatments with and without tax, when there is no basic income. Boxes and labels
are as in Fig. 1.
Table 1 Results from the logit model. p-value of 0.6825. This shows that workers do not reciprocate
their managers when they have not been replaced by a robot.
A more detailed study of the individual behavior of type
Estimate Std error z value Prð>jzjÞ
A subjects, i.e., of managers does not reveal distinct patterns of
Intercept −0.38940 0.29910 −1.302 0.1929 behavior. Table 2 collects the rates of substitution for the different
I(ProdRob-Prod1) 0.14342 0.02095 6.846 7.58e–12*** sub-cases of the endogenous treatment. One would expect that
TAXYes −0.64306 0.31249 −2.058 0.0396*
managers would replace the worker every time that the robot is
RBYes 0.10227 0.30313 0.337 0.7358
SexMMale 0.29599 0.30890 0.958 0.3380
more efficient, and never replace her otherwise. However, in some
cases, reaching about 40% in the condition with tax, the manager
Significance: ***0,001; **0,01; *0,05. does not do that, showing probably some concern for the welfare
of the worker. The opposite situation is perhaps more puzzling.
When the worker is more efficient, she is sometimes replaced,
Cabrales and Ponti, 2015), suggesting that we may expect a about 15% of the time, reaching an astonishing 30% when there is
beneficial act to be reciprocated. Thus, managers not replacing neither income nor tax. Another way of looking at these data is
workers when the randomly assigned robot is more productive the plot in Fig. 5. As can be seen, in the positive side of the
could be interpreted as one of those actions that deserve a reci- horizontal axis, corresponding to workers being more efficient
procation, and indeed, the worker can do so by making more that their candidate replacing robot, the pink column, repre-
effort. One would also expect this to happen only in endogenous senting no replacement, is dominant. On the negative side, when
treatments, as workers should not feel the need to reciprocate a the robot is better than the workers, the bars are predominantly
decision made by machines. Figure 4 shows, however, that there green, which indicates that the worker is replaced. Nevertheless,
are no significant differences in phase 2 for workers that are the pink bars are equally distributed for not so large negative
chosen not to be substituted in exogenous versus endogenous differences. One would think the replacement is guided by a
treatments. The t-test of equality in means accepts the null with a threshold strategy, but for this to be true, the pink bars on the
HUMANITIES AND SOCIAL SCIENCES COMMUNICATIONS | (2020)7:185 | https://doi.org/10.1057/s41599-020-00676-8 5ARTICLE HUMANITIES AND SOCIAL SCIENCES COMMUNICATIONS | https://doi.org/10.1057/s41599-020-00676-8
negative side would have to be decreasing and even disappear as workers’ productivity, and also to find out whether different
the difference becomes larger which is not the case until the policies are relevant in this area. We have found that workers do
difference becomes very large. Finally, as one can see in Fig. 5, the not produce more when they can be substituted by robots and
cases of part time or shared jobs (light blue) are scarce, and do that the two policies considered (universal basic income or tax on
not show any specific pattern. robots) do not affect the workers’ productivity. Of these two
policies, a tax levied on robots does reduce the probability of
worker replacement, although the behavior of managers in our
Discussion experiment is not easy to understand. Finally, the possibility of
In this work, we report the results of an experiment designed to part-time jobs is practically never used in our setup.
test the effect of the possibility of being replaced by a robot on the Let us first discuss some of these results in light of our theo-
retical framework. Our first result runs contrary to our Hypoth-
esis 2. It can nevertheless be accommodated in the framework.
Table 2 Rates of substitution by robots. Note that the hypothesis 2 is a direct consequence of Eq. (5). But
if one looks deeper into that equation, one can see (Eqs. (7) and
00
Lower Higher (6)) that a low value of U ð:Þ with respect to U 0 ð:Þ, that is a very
Substituted No Substituted No concave utility (high risk aversion) would lead to a low enough
response in effort that would not be picked up in the data. High
No income no tax 72.2% 27.8% 29.2% 70.8%
Income 84.2% 15.8% 9.1% 90.9%
levels of risk aversion are not uncommon in environments with
Tax 59.6% 40.4% 7.7% 92.3% high potential losses like the financial markets (Cohn et al., 2015)
Income and tax 63.8% 36.4% 15.4% 84.6% and in agricultural economies (Yesuf and Bluffstone, 2009). A
similar thing occurs with our result that universal basic income
Fig. 4 Production does not increased in the second phase when workers are not substituted. Aggregate production in the second phase for endogenous
treatments 8 without basic income, but with or without tax) compared to production in the second phase for the exogenous treatment, where decisions are
taken exogenously. Boxes and labels are as in Fig. 1.
Fig. 5 Workers that were replaced, or not, by a robot, or half a robot as a function of the difference in production between the worker and the robot
randomly assigned to replace her. Green, number of instances in which the worker was replaced. Pink, number of instances in which the worker was not
replace. Blue, replacements keeping a part-time contract.
6 HUMANITIES AND SOCIAL SCIENCES COMMUNICATIONS | (2020)7:185 | https://doi.org/10.1057/s41599-020-00676-8HUMANITIES AND SOCIAL SCIENCES COMMUNICATIONS | https://doi.org/10.1057/s41599-020-00676-8 ARTICLE
does not decrease workers’ effort. It is contrary to Hypothesis 1, a policy decisions that can have an impact on the process. Our
consequence of Eq. (2). But from Eqs. (4) and (3) one can also see results suggest that the general worker population may not be
that high risk aversion can easily explain the apparent lack of well aware of the advancement of automation, and therefore more
response by the workers. Other mechanisms are indeed possible information should be provided so they can make decisions on
to explain those observations. A different model, where agents their own careers within a proper context. Perhaps more
have multiple priors and maximin preferences as in (Gilboa and importantly, it turns out that the universal basic income does not
Schmeidler, 1989) and (Klibanoff et al., 2005) could also explain decrease productivity; if confirmed by future research, this points
those results. Our experimental setup is not designed to test out to a means to alleviate the circumstances of workers affected
between these alternative theories, but we hope that our results by automation. On the other hand, this policy can coexist with a
will encourage future research in this direction. tax on robots that would have two benefits: reduce the substitu-
Behavioral economics can explain why managers do not always tion rate, and provide funds to support the universal basic
automate when the robot is more productive, as the workers lose income. All together, our results indicate that there is much room
more than the managers gain. A simple expansion of our theo- for action by policy makers to modulate the automation process
retical framework where agents have egalitarian (social) pre- and its negative consequences.
ferences as in (Cabrales and Ponti, 2015) would take account of
this result. This could be exacerbated in our case, because the Ethics statement
worker is substituted by a machine. This is important because the This study has received approval from the ethics committee of
loss of a job is very important for personal identity issues (see, Universitat de València, and the study was conducted following
e.g., Schob, 2012). the approved guidelines.
It is also interesting to discuss another of our observations,
namely the increase in production in the second phase with Data availability
respect to the first one. Of course, a component of this is the Data is available from the authors upon request.
contribution of more efficient robots, but as shown in Fig. 2, the
production by human participants also increases. This result may Received: 24 June 2020; Accepted: 17 November 2020;
arise for two reasons: It can be explained because of a learning
effect of participants (even though the complexity of second
period task was higher than the first) or because of a selection bias
(the most productive workers are those that proceed to the sec-
ond phase).
As far as the effect of the universal basic income or of taxes is References
Abbott R, Bogenschneider B (2018) Should robots pay taxes: tax policy in the age of
concerned, we want to stress that our conclusions are drawn for automation. Harvard Law Policy Rev 12:145–175
specific values of those policies. In particular, we have only tested a Acemoglu D, Restrepo P (2017) Robots and Jobs: evidence from USLabor markets.
basic income equivalent to one fifth of the output, so we cannot J Pol Econ 128:2188–2244
claim that a larger basic income would have no effect. More Arntz M, Gregory T, Zierahn U (2016) The Risk of Automation forJobs in OECD
research would be needed to ascertain that effect. The effect of taxes countries. OECD Social, Employment and Migration Working Papers.
https://doi.org/10.1787/1815199X Accessed 17 Nov 2020
is more likely to be representative of the general behavior, albeit it Autor D, Salomons A (2018) Is automation labor-displacing? Productivity growth,
can also be expected that a very low tax may not be effective. employment, and the labor share. Brookings Paper Econ Activity 2018:1–87
Also, we cannot discern with our experiment the impact of Blake PR, McAuliffe K, Corbit J et al. (2015) The ontogeny of fairness in seven
automation on employment. Our experiment confirms that not societies. Nature 528:258–261
all jobs for which robots are more productive get replaced even in Cabrales A, Ponti G (2015) Social preferences. In: Branas-Garza P, Cabrales A (eds)
Experimental economics. Palgrave Macmillan, London, pp. 87–104
our case, where there is no issue of quality of work. In addition, Cohn A, Engelmann J, Fehr E, Marechal MA (2015) Evidence for countercyclical
we cannot take into account the impact of lower costs, and the risk aversion: an experiment withfinancial professionals. Am Econ Rev
higher sales, within other jobs in the same industry, or the general 105:860–885
equilibrium effects. The literature we discuss in the introduction Efron B, Tibshirani RJ (1993) An introduction to the bootstrap. Chapman & Hall/
suggests that even if many jobs are replaced, the global effect on CRC, New York
Frank MR, Sun L, Cebrian M, Youn H, Rahwan I (2018) Smallcities face greater
employment will be small or even positive. impact from automation. J R Soc Interface 15:20170946
We have discussed two policy instruments, “robot taxes” and Frey CB, Osborne MA (2013) The future of employment: how susceptible are jobs
universal basic income, to mitigate the effects of automation on to computerisation? Oxford University Press, Oxford
employees whose skills are made redundant. Our conclusion is Gilboa I, Schmeidler D (1989) Maxminexpected utility with non-unique prior. J
that taxes are effective to deter employers from automating some Math Econ 18:141–153
Guerreiro J, Rebelo S, Teles P (2017) Should robots be taxed? Working paper no.
jobs, and universal basic income protects the income of workers w23806, National Bureau of Economic Research. https://www.nber.org/
without making them less productive. But both instruments have papers/w23806 Accessed 17 Nov 2020
wider implications. Universal basic income is far costlier, as it Hoynes H, Rothstein J (2019) Universalbasic income in the United States and
affects (by definition) all citizens, and it requires significant advanced countries. Ann Rev Econ 11:929–958
increases in taxation to fund it (Hoynes and Rothstein, 2019). It is Kangas O, Jauhiainen S, Simanainen M, Yliknn M (2019) The basic income
experiment 2017-2018 in Finland: preliminary results. Ministry of Social
thus best seen as a policy in the context of the general fight Affairs and Health, Finland. https://apo.org.au/node/260496 Accessed 17 Nov
against inequality, rather than something narrowly related to 2020
automation. On the other hand, “robot taxes” are targeted, and Klibanoff P, Marinacci M, Sujoy M (2005) A smooth model of decision making
cheaper. They affect just the workers and firms involved in under ambiguity. Econometrica 73:1849–1892
automation. But it also slows technical change, which can be a Levitt SD, List JA (2007) What do laboratory experiments measuring social pre-
ferences reveal about the real world? J Econ Perspec 21:153–174
major problem for society in the long-run. Thus, they seem Levitt SD, List JA, Sadoff SE (2011) Checkmate: exploringbackward induction
sensible only “while the current generations of routine workers, among chess players. Am Econ Rev 101:975–990
who can no longer move to non-routine occupations, are active in Manyika, J, Lund, S, Chui, M et al. (2017) Jobs Lost, Jobs Gained: Work-
the labor force,” as Guerreiro et al. (2017) show. forcetransitions in a time of automation. McKinsey Global Institute. https://
In conclusion, this work represents a first step in the www.mckinsey.com/featured-insights/future-of-work/jobs-lost-jobs-gained-
exploration of human reaction to automation and in the study of
HUMANITIES AND SOCIAL SCIENCES COMMUNICATIONS | (2020)7:185 | https://doi.org/10.1057/s41599-020-00676-8 7ARTICLE HUMANITIES AND SOCIAL SCIENCES COMMUNICATIONS | https://doi.org/10.1057/s41599-020-00676-8
what-the-future-of-work-will-mean-for-jobs-skills-and-wages Accessed 17 Additional information
Nov 2020 Supplementary information is available for this paper at https://doi.org/10.1057/s41599-
Michaels G, Natraj A, VanReenen J (2014) Has ICT polarized skilldemand? Evi- 020-00676-8.
dence from eleven countries over 25 countries. Rev Econ Stat 96:60–77
Noguera JA, DeWispelaere J (2006) A plea for the use oflaboratory experiments in Correspondence and requests for materials should be addressed to A.S.
basic income research. Basic Income Stud 1:2
Schöb R (2012) Unemployment and identity. CESifo Economic Stud 59:149–180 Reprints and permission information is available at http://www.nature.com/reprints
World Bank (2016) World Development Report 2016, Washington. https://www.
worldbank.org/en/publication/wdr/wdr-archive. Accessed 17 Nov 2020 Publisher’s note Springer Nature remains neutral with regard to jurisdictional claims in
Yesuf M, Bluffstone RA (2009) Poverty,risk aversion, and path dependence in low- published maps and institutional affiliations.
income countries: experimentalevidence from Ethiopia. Am J Agric Econ
91:1022–1037
Open Access This article is licensed under a Creative Commons
Attribution 4.0 International License, which permits use, sharing,
adaptation, distribution and reproduction in any medium or format, as long as you give
Acknowledgements
This research originates as a contribution to the goals of Fundacin COTEC on under- appropriate credit to the original author(s) and the source, provide a link to the Creative
standing and advancing innovation. We are grateful to COTEC, and in particular to Commons license, and indicate if changes were made. The images or other third party
Aleix Pons and Jorge Barrero, for discussions and support. Additional support from material in this article are included in the article’s Creative Commons license, unless
grant PGC2018-098186-B-I00 (BASIC) from Ministerio de Ciencia e Innovación/FEDER indicated otherwise in a credit line to the material. If material is not included in the
(Spain/UE) and from grants PRACTICO-CM and CAVTIONS-CM-UC3M from the article’s Creative Commons license and your intended use is not permitted by statutory
Comunidad de Madrid and Universidad Carlos III de Madrid is gratefully acknowledged. regulation or exceeds the permitted use, you will need to obtain permission directly from
the copyright holder. To view a copy of this license, visit http://creativecommons.org/
licenses/by/4.0/.
Competing interests
The authors declare no competing interests. © The Author(s) 2020
8 HUMANITIES AND SOCIAL SCIENCES COMMUNICATIONS | (2020)7:185 | https://doi.org/10.1057/s41599-020-00676-8You can also read