VIRTUAL INVESTOR BRIEFING - INGENIA COMMUNITIES GROUP - Presented by Ingenia Communities
←
→
Page content transcription
If your browser does not render page correctly, please read the page content below
Presented by Ingenia Communities
                                                   3 May 2021

INGENIA COMMUNITIES GROUP
VIRTUAL INVESTOR BRIEFING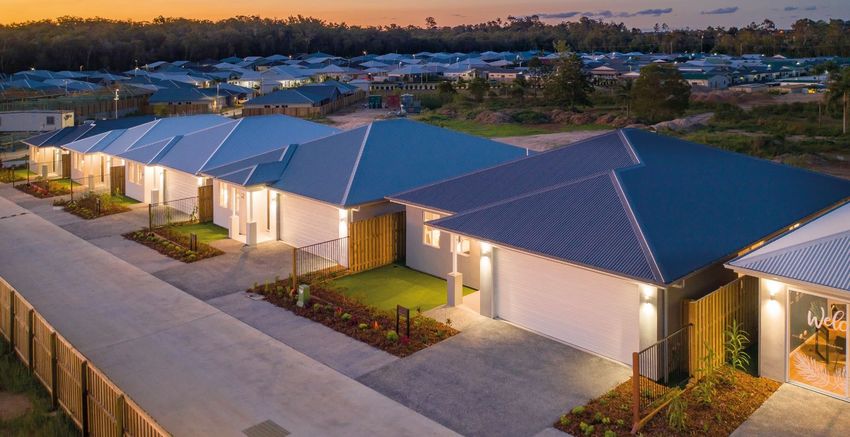
Introduction

Introduction              Simon Owen

Ingenia Holidays Update   Matthew Young

General Q&A

Residential Markets       • Kate Melrose
                                                                  Simon Owen                                  Matthew Young
                          • Eliza Owen                      CEO & Managing Director                             GM Tourism
                                                              Ingenia Communities                           Ingenia Communities

                          • Craig Maidment
Residential Q&A

Close                     Simon Owen

                                                     Eliza Owen                          Kate Melrose                   Craig Maidment
                                             Head of Residential Research               GM Project Sales               Managing Director
                                                      CoreLogic                       Ingenia Communities            Ezi Build Group & QMR
                                                                                                                          Constructions

                                                                                                                                             2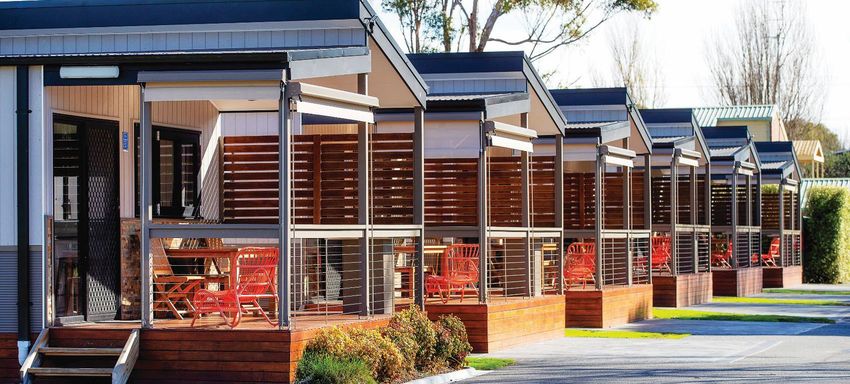
Portfolio overview
Continuing to grow operations and portfolio scale

Over $170 million
assets acquired year to date
                                                     80
                                                    Communities

                                                                  $1.3B
                                                                       Property Portfolio

Pipeline remains strong – greenfield land                 42   Lifestyle and Holiday Communities
and established communities                               26   Ingenia Gardens Communities

                                                           9   Funds

                                                           3   Joint Venture (greenfield)

                                                                                                   3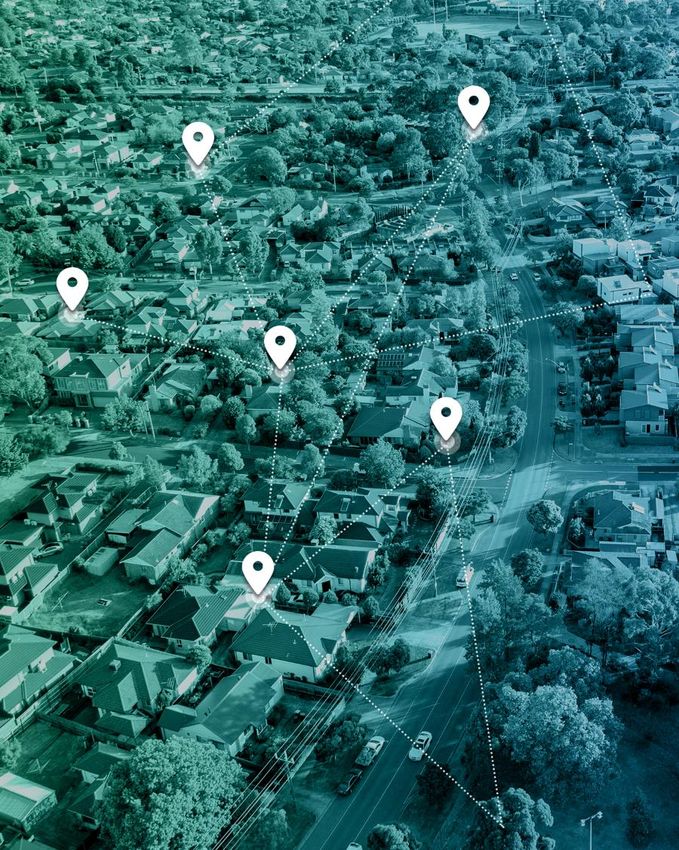
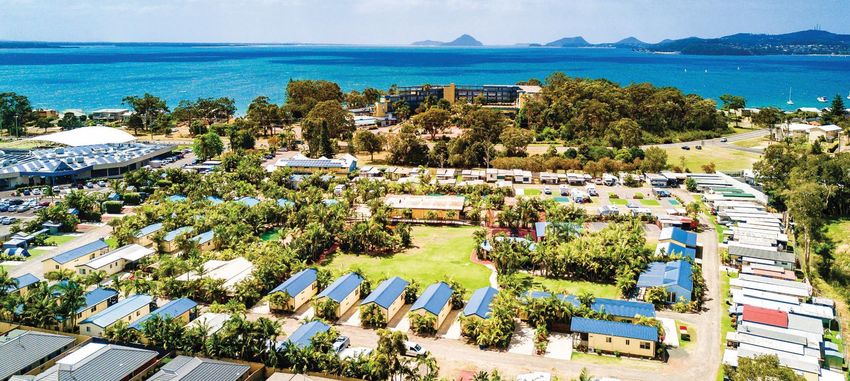
Expanding presence in Queensland
Greenfield site at Bargara expands balance sheet pipeline
Bargara Waters Lifestyle Resort
• Extends presence on Queensland coast
• Ingenia Lifestyle Hervey Bay is located approximately 1.5 hours away
• Bargara is a popular tourist town which is well serviced by amenities and has benefitted
from substantial investment
• Both Bundaberg and Bargara are popular with retirees and the development is
anticipated to appeal to locals and downsizers from city locations seeking a sea change
Median house in Bargara was $400,000 in FY20
Bargara Waters
Funds
Ingenia Lifestyle
and Holidays
Bargara Beach, QLD
4
Expanding presence in Queensland
Greenfield site at Bargara expands balance sheet pipeline

Bargara Waters Lifestyle Resort

• Attractive 16.2 hectare ocean front greenfield site with
  approval for a 344 home land lease community and
  associated community facilities
• The development will be undertaken on Ingenia’s
  balance sheet, boosting the Group’s fully owned
  development pipeline

 Works are anticipated to commence in
 FY22, with first settlements targeted
 for FY23

                                                             5
Expanding presence in Queensland
Premium lifestyle community on Sunshine Coast acquired March 2021

Nature’s Edge, Buderim, Queensland

• Unique, premium community located on the Sunshine Coast, one hour north       • Mature adjoining community, The Village Forest Glen, of 51 homes
  of Brisbane                                                                   • Development site includes 21 quality tourist cabins which will be deployed
• Newly developed community with 181 homes, facilities in place and a further     elsewhere across the Group
  68 approved development sites

                              Quality, architect designed homes, manicured gardens and premium facilities at Nature’s Edge

                                                                                                                                                               6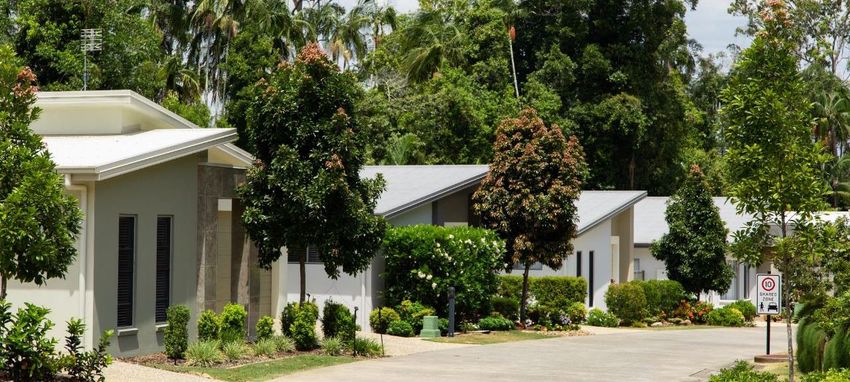
Expanding presence in Queensland
Holiday and rental community in Townsville acquired March 2021

BIG4 Townsville Woodlands, Townsville, Queensland

• Mixed-use resort located in Townsville, along popular drive route to Cairns      • Ability to enhance returns through the addition of five new tourism cabins
  with a high portion of local and interstate guests                                 (approvals in place), refurbishment of existing cabin stock and integration into
                                                                                     Ingenia platform
• Well presented resort, with a mix of holiday accommodation, long-term rentals
  and attractive facilities                                                        • Ingoing yield >8% with significant upside identified

      • Long-term rentals provide stable rental stream                             • Adds 103 cabins/sites plus 55 long-term rentals

                                             Family friendly facilities at BIG4 Townsville Woodlands Holiday Park

                                                                                                                                                                        7
Ingenia Holidays

                   8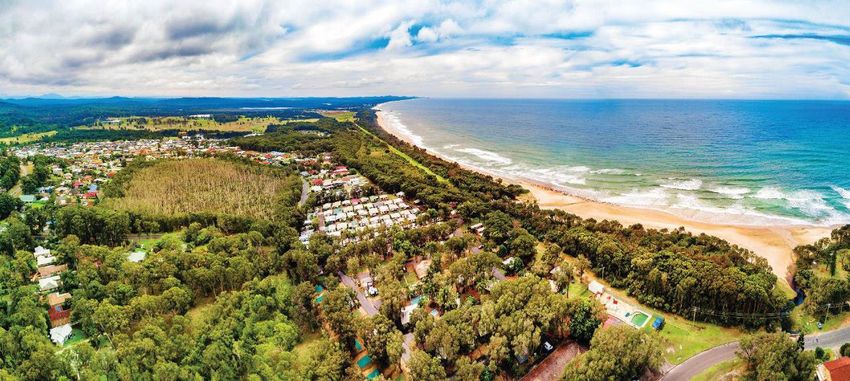
Matt Young
General Manager Tourism

                          Matt joined Ingenia in March 2021 and is responsible for all Ingenia
                          Holidays communities and food and beverage operations.

                          Matt brings 25 years’ experience in national and international tourism
                          working with global hotel brands to the role with responsibility for
                          operating hotels and resorts as well as hotel development projects.
                          Prior roles include Vice President QLD and NT at Accor and a variety
                          of leadership positions with InterContinental Hotels Group.

                          Matt has extensive knowledge of the tourism industry and expertise
                          working with global brands managing large teams to deliver on
                          strategy and business outcomes.

                                                                                                   9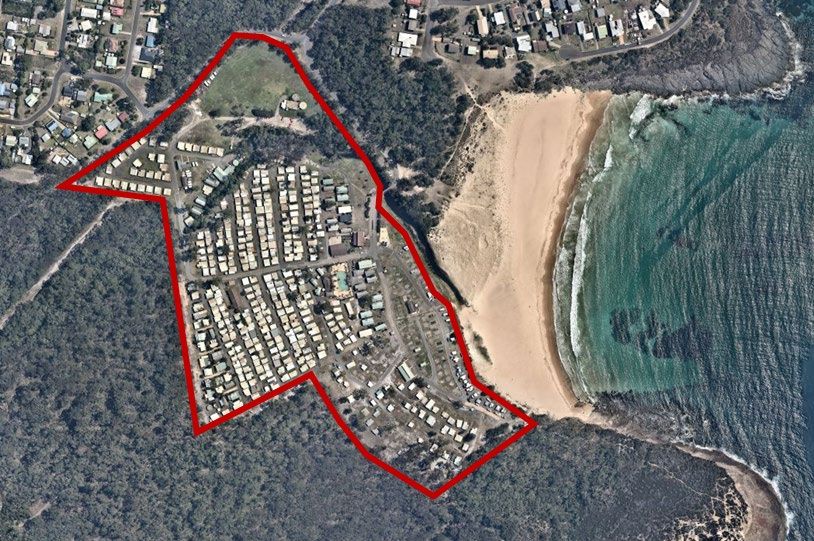
Acquisition of unique portfolio of holiday parks to complete July 2021
Attractive assets delivering immediate accretion
Portfolio of five leasehold holiday parks located in key markets

• Three parks in Victoria, complementing BIG4 Inverloch and providing immediate scale

• Two parks within existing east coast clusters, providing additional scale and efficiencies
  in target markets

                                                                                               New acquisitions
Mix of stable cashflows and holiday revenue supporting attractive yield                        Ingenia Lifestyle and Holidays
                                                                                               Funds
• Ingoing yield of over 10%                                                                    Joint Venture

• Potential upside through identified asset management strategies

Adds 844 income producing sites to holidays business, increasing
holidays portfolio by over 20%

• Annual and permanent sites provide circa 30% of revenue

• Strong market conditions for domestic travel and revenue management expected to                      Asset configuration      No. sites
  enhance tourism returns
                                                                                                       Cabins                     170
• One of the largest networks of holiday parks on the East Coast
                                                                                                       Powered sites              384
                                                                                                       Unpowered sites             40
                                                                                                       Annuals                    250
                                                                                                       Total                      844

                                                                                                                                            10
Merry Beach Caravan Park expands NSW South Coast presence
Acquisition scheduled to complete 4 May 2021
• Adds 540 income producing sites through an established park with
identified upside
• Located in a prime beachfront location on over 13 hectares of
perpetual leasehold and licensed land
• Includes over 350 annuals providing a stable revenue base
• The park enjoys easy access to the beach and the Murramarang
National Park
• Opportunities to enhance performance include remixing the
accommodation offer and selected investment to upgrade facilities
11Quality portfolio with expanding east coast presence
Recent acquisitions enhance footprint and leverage established platform
>1,100
Cabins
>2,500
Sites
>1.1m
Room nights
>1,300
Annuals
On completion of announced acquisitions the portfolio will consist of 33
holiday parks along Australia’s East Coast, from Victoria to Cairns
12Outlook for domestic travel is positive
‘Holidaying at home’ has driven growth in demand
Market conditions for caravanning and camping remain buoyant
• Market demonstrating resilience post COVID • Ingenia adapting model to cater to diverse guests and needs
• Focus on converting first time guests to repeat customers
Adjusting to ‘lock downs’; providing flexible terms’
Addressing challenges for first time visitors
• Growing awareness supporting future demand Contactless check in
Recent NSW Caravan and Camping Supershow had unprecedented Pre arrival communications
attendance – up 15% on 2019 at over 60,000 people
Strong interest from ‘grey nomads’
Source: Caravan Industry Association of Australia – State of the Industry 2020
13Ingenia Holidays business has rebounded strongly
Year to date the portfolio has delivered strong growth across key metrics
• Year to date revenue to end March up circa 20% on prior corresponding • Acquisition strategy has increased exposure to recovering market and upside
period (based on like for like portfolio) as restrictions have eased
Occupancy at 60% (up 5% on prior year like for like) Portfolio now providing over 1.1 million room nights per annum
REVPAR of $57 up 18% and REVPOR of $95 up 12% – like for like
• Opening of intrastate borders strengthened demand with average daily Expect revenue growth and margin expansion for FY21 supported by
booking revenue increasing strong holdings through to June and increased portfolio scale
Daily bookings have continued to grow
Average Per Day Booking Revenue Increasing scale supporting revenue growth
>3,500
cabin/sites
$350,000 40 4000
$300,000 35 3500
$250,000
30 3000
No. Sites
25 2500
Revenue
$200,000
($m)
20 2000
$150,000
1,033
15 1500
$100,000 cabin/sites
10 1000
$50,000
5 500
$0
July August September October November December January February March Average 0 0
FY15 FY16 FY17 FY18 FY19 FY20 No. sites
19/20 20/21 post
Revenue Cabins/sites acquisitions
14Recent trends and performance
Digital presence supporting growth – key assets performing well
• Driving significant growth in traffic through ingeniaholidays.com.au • Parks within drive distance of cities continuing to exhibit strongest demand as
customers travel closer to home and take shorter breaks
Online bookings up materially – more than 47% of bookings via
website YTD March 2021 Weekends remain strong
Lower use of Online Travel Agents (OTAs), providing cost savings Opening of borders and domestic airline capacity benefitting Cairns
Coconut leading into peak winter trading period
and greater engagement
Sydney parks servicing CBD mid-week demand and sporting groups
• Expect improved trading outside traditional ‘peak’ showing signs of recovery (represent only 5% of portfolio ‘room nights’)
Snapshot – Ingenia Holidays Cairns Coconut
• Availability of domestic travel improving accessibility
• Strong bookings in place for peak winter trading periods -
local ‘drive’ market and interstate guests
• Winter bookings ahead of 2019
• Evolving in park offer with addition of new playground and
lagoon bar
• Expect strong winter trading
New playground planned for Cairns Coconut
15Current initiatives
Capitalising on increased demand
Evolving guest experience and product to respond to
emerging needs
• Increasing capacity and evolving accommodation offer
Addition of new cabins at supply constrained parks
(60+ planned FY22)
Refining cabin design in response to guest feedback
• Selectively investing in new facilities and in park amenities
16Current Initiatives
Capitalising on increased demand
Evolving guest experience and product to respond to emerging needs
• New website with increased functionality – plan your itinerary through our parks
• Digital marketing to 225,000+ database
• Broadening customer base
Increasing presence in broader tourism market
Partnership with South Sydney ‘Rabbitohs’ rugby league team
17Questions
18Residential Markets
19Kate Melrose
General Manager Project Sales
Kate joined Ingenia in August 2014 and is responsible for sales
across the Group’s Ingenia Lifestyle development projects.
Kate brings over 20 year’s property experience to the role. Kate
spent 14 years at Lend Lease in a range of roles including Global
Strategic Marketing Manager, Development Manager, Project Director -
Strategy and roles focused on product innovation and sales
management.
Kate has been at the leading edge of innovation in the retirement
and integrated Aged care sector leading design and sales at Mark
Moran Vaucluse and Greengate and is passionately committed to
“providing better Retirement solutions”.
Kate holds a Bachelor of Business (Land Economics), a Certificate
in Corporate Real Estate and is a graduate of the Institute of
Company Directors.
20Post COVID sales rebound supported by market conditions
• Growing sales enquiry and increasing settlements • Demand underpinned by longer term demographic trends and more recent
catalysts
February a record month for sales
Ageing population and low penetration rate
Settled 223 homes to 31 March 2021 (Ingenia and JV)
Increasing market awareness
Additional 324 deposits and contracts in place at 31 March 2021
Attractiveness of community living post COVID isolation
• Average above ground per home development profit remains stable
Attractiveness of regional and coastal markets
• Despite impact on sales and settlements timing due to COVID, mid-term
settlements outlook remains positive
New Home Settlements
400
350
300
250
200
150
100
50
0
FY13 FY14 FY15 FY16 FY17 FY18 FY19 FY20* FY21 YTD*
* Includes Joint Venture Settlements. FY21 YTD to 31 March 2021.
21Growing customer awareness of the sector
Increasing consumer demand for community living post COVID
• Demand for sea and tree change locations from capital city markets
• Increased capacity to pay Taking 4 key themes
advantage of driving buyer
Escape
• A more educated buyer emerging the current behaviour in
the city
housing a post COVID
• Growing awareness of the sector market world
• Appeal to pensioners and self-funded retirees
• Increasing price diversity to meet market demand
Move into a Opportunity
supportive & to boost
connected retirement
environment income
Emerging Lead enquiry from Capital Cities
86% 70%
New leads – other locations
14% 30%
New leads – Capital Cities
0% 20% 40% 60% 80% 100% 120% 140% 160% 180%
1 Jan – 31 March 2020 1 Jan – 31 March 2021
22Ingenia performing strongly in light of customer insight from industry research
Industry research post-COVID confirmed there are 10 Key
factors that drive customer satisfaction and advocacy
The pillars that
underpin Ingenia’s
strong value
proposition
COVID has driven an increased priority on ageing support,
location and a safe environment when choosing a community.
Post covid, as more Baby Boomers look to downsize,
home design, upkeep and maintaining an active social life will
The result of research into 4,500 surveys of retirement and lifestyle living residents;
2,270 prospective residents and 40 in depth interviews. come into greater focus for new prospects.
Source: page14 DCM National Resident Survey Report
23First greenfield project established new benchmarks – now sold out
• 270 homes SOLD OUT
• Launch record
• Strong price escalation
• Platinum Home innovation
• First solar installation
• Established new benchmark for lifestyle living Winner
National Marketing Excellence Award 2018
Retirement Living Awards
24Affordable lifestyle & sea-change proposition drives sales volumes at Hervey Bay
25Ingenia Lifestyle Hervey Bay
Sea change lifestyle and affordability
Loc a ti on or i gi n c ha nge pr e
• Project pre-launch early 2019 a nd pos t c ovi d
• First homes settled December 2019 1/10/19 – 31/3/20 1/1/21 – 31/3/21
• 100+ residents now in place
UNKNOWN - ALREADY SOLD AND TRAVELLING 11% 8%
• Current deposits and contracts are exceeding expectations NON-LOCAL INTERSTATE 11% 19%
Settlements outperforming NON-LOCAL QLD 22% 27%
• Clubhouse nearing completion – early FY22 SECONDARY CATCHMENT
8%
(I.E. BUNDABERG, BIGGENDEN)
Will further stimulate sales volume and price and rent uplift opportunities LOCALS 56% 38%
• Launch price - $259,000 to $369,000
Hervey Bay Launch and Current Pricing v. competitors
• Further increased diversity of product mix at top and bottom end of the price (New Home Sales) GST Inclusive
band to increase sales velocity
• Future price -Eliza Owen
Head of Residential Research Australia, CoreLogic
Eliza Owen is the Head of Residential Research Australia.
Eliza has a wealth of experience in property data analysis and reporting.
She worked as an economist at Residex, a research analyst at Domain
Group and previously as the commercial real estate and construction
analyst at CoreLogic.
She specialises in descriptive and inferential data analysis, data
visualisation and framing data trends with broader economic concepts.
Alongside her career in property data and research, Eliza is passionate
about explaining economic concepts to broader audiences. She unpacked
housing affordability on the TEDX stage, and has been a regular
commentator for The Sydney Morning Herald, The Age, the ABC and
commercial radio and television.
Eliza is also a popular keynote speaker, having presented to thousands in
real estate, construction, banking and finance and property development,
as well as consumer audiences.
27CoreLogic
CoreLogic Australia is a wholly owned subsidiary of CoreLogic (NYSE: CLGX), which is the largest property data and
analytics company in the world.
CoreLogic provides property information, analytics and services across Australia, New Zealand and Asia, and recently
expanded its service offering through the purchase of project activity and building cost information provider Cordell. With
Australia’s most comprehensive property databases, the company’s combined data offering is derived from public,
contributory and proprietary sources and includes over 4.4 billion decision points spanning over three decades of
collection, providing detailed coverage of property and other encumbrances such as tenancy, location, hazard risk and
related performance information.
With over 20,000 customers and 150,000 end users, CoreLogic is the leading provider of property data, analytics and
related services to consumers, investors, real estate, mortgage, finance, banking, building services, insurance,
developers, wealth management and government. CoreLogic delivers value to clients through unique data, analytics,
workflow technology, advisory and geo spatial services. Clients rely on CoreLogic to help identify and manage growth
opportunities, improve performance and mitigate risk.
CoreLogic employs over 650 people across Australia and in New Zealand.
For more information call 1300 734 318 or visit www.corelogic.com.au
28Housing Market Update Ingenia Communities May 2021
Residential Real Estate Underpins Australia’s Wealth

                                  RESIDENTIAL REAL ESTATE

                                  $8.1 Trillion
                                  AUSTRALIAN SUPERANNUATION

                                  $3.0 Trillion
                                  AUSTRALIAN LISTED STOCKS

                                  $2.5 Trillion
                                  COMMERCIAL REAL ESTATE

                                  $964 Billion
                  Data as at May 2021.

                10.6 million                         $1.9 trillion               53.0%                              503,691            $331 billion
                Number of dwellings                  Outstanding mortgage debt   Household wealth held in housing   Total sales p.a.   Gross value of sales p.a.

CONFIDENTIAL   ©©2021
                  2021CoreLogic, Inc.All
                      CoreLogic, Inc. AllRights
                                          RightsReserved.
                                                 Reserved.                                                                                Source: CoreLogic, APRA, RBA, ABS, ASX   30
The COVID-induced dip became one of the smallest
property market downturns in the past 30 years
Months and value change from previous record high - dwellings, national
1989-91 1994-95 2004-05 (GFC) 2008-09 2010-13 2015-16 2017-19 COVID-19 (2020-21)
1%
0%
-1%
Value relative to start of downswing
-2%
-3%
-4%
-5%
-6%
-7%
-8%
-9%
1 3 5 7 9 11 13 15 17 19 21 23 25 27 29 31 33 35 37 39
Number of months
CONFIDENTIAL © 2021 CoreLogic, Inc. All Rights Reserved. Source: CoreLogic 31In the three months to April, national home values rose 6.8%,
which is the highest quarterly dwelling growth rate since
December 1988
Rolling quarterly change in dwelling values Change in dwelling values, three months to
April 2021
Combined Capitals Combined Rest of State
8% Australia 6.8%
Combined regionals 6.6%
Combined capitals 6.8%
6%
Regional NT 4.3%
Regional TAS 7.7%
4% Regional WA 3.0%
Regional SA 4.7%
Regional QLD 6.1%
Regional Vic 7.1%
2%
Regional NSW 7.4%
Canberra 6.7%
0% Darwin 5.8%
Hobart 7.0%
Perth 4.2%
-2% Adelaide 4.3%
Brisbane 5.6%
Melbourne 5.8%
Sydney 8.8%
-4%
Apr 11 Apr 13 Apr 15 Apr 17 Apr 19 Apr 21
CONFIDENTIAL ©©2021
© 2021CoreLogic,
2020 CoreLogic, Inc.
CoreLogic, Inc.All
Inc. AllRights
All RightsReserved.
Rights Reserved.
Reserved. Source: CoreLogic 32The rolling 28-day growth rate shows dwelling value
increases may have peaked through the month of March
Rolling 28-day growth rate in CoreLogic Home Value Indices
Combined Capitals Combined Rest of State
3.0%
2.5%
2.0%
1.8%
1.5%
1.7%
1.0%
0.5%
0.0%
-0.5%
-1.0%
-1.5%
28 Jun 20
15 Nov 20
05 Apr 20
03 May 20
31 May 20
04 Apr 21
02 May 21
23 Aug 20
13 Dec 20
09 Feb 20
08 Mar 20
20 Sep 20
10 Jan 21
07 Feb 21
07 Mar 21
18 Oct 20
26 Jul 20
CONFIDENTIAL © 2021 CoreLogic, Inc. All Rights Reserved. Source: CoreLogic 33CoreLogic estimates sales volumes increased 22.6% nationally
over the twelve months to April
Monthly sales with six month moving average, National Annual change in sales volumes April 21
Sydney 18.0%
Melbourne 2.8%
Brisbane 25.6%
70,000 Adelaide 12.9%
Perth 38.9%
60,000 Hobart -7.8%
10-year average Darwin 19.6%
50,000 Canberra 10.7%
40,000 Regional NSW 32.6%
Regional Vic 23.6%
Regional Qld 40.4%
30,000
Regional SA
Note: recent months are modelled estimates,42.6%
and are
Regional WA
therefore subject to revision 63.9%
20,000
Regional Tas 0.8%
Regional NT 42.1%
10,000
Combined capitals 16.1%
0
Apr 11 Apr 13 Apr 15 Apr 17 Apr 19 Apr 21 Combined regionals 34.0%
National 22.6%
Note: recent months of sales volumes are modelled estimates, and are subject to revision
Source: CoreLogic
CONFIDENTIAL ©©2021
2021CoreLogic,
CoreLogic, Inc.
Inc.All
AllRights
RightsReserved.
Reserved. 34Fresh listings to the market have increased substantially over
April, but a rapid rate of absorption from strong buyer demand
is keeping overall stock levels well below average
Number of new listings, National Dwellings Number of total listings, National Dwellings
60,000 300,000
50,000 250,000
40,000 200,000
30,000 150,000
20,000 100,000
25/04/2021 143,587
25/04/2021 40,632 % change same time last year -22.2%
10,000 50,000
% change same time last year 84.4% % change five year average -25.2%
% change five year average 13.7% As at 25 Apr, 2021 As at 25 Apr, 2021
0 0
Jan Feb Mar Apr May Jun Jul Aug Sep Oct Nov Dec Jan Feb Mar Apr May Jun Jul Aug Sep Oct Nov Dec
2016 2017 2018 2019 2020 2021 2016 2017 2018 2019 2020 2021
CONFIDENTIAL © 2021 CoreLogic, Inc. All Rights Reserved. Source: CoreLogic 35Owner occupiers have been the driving force behind the
recovery in home lending, but the most recent trend hints that
a shift towards a larger proportion of investors could be
underway
Monthly value of owner occupier v investor Month-on-month change in the value of Month-on-month change in the value of
housing finance commitments ($ million) Owner Occupier housing finance Investor housing finance commitments (exc-
commitments (exc-refi) refi)
$27,500 15.0% 15.0%
$22,500 10.0% 10.0%
5.0% 5.0%
$17,500
0.0% 0.0%
$12,500
-5.0% -5.0%
$7,500
-10.0% -10.0%
monthly monthly
Owner occupiers Investors
$2,500 3 month moving average 3 month moving average
-15.0% -15.0%
Feb 15
Feb 16
Feb 17
Feb 18
Feb 19
Feb 20
Feb 21
Feb 15
Feb 16
Feb 17
Feb 18
Feb 19
Feb 20
Feb 21
Feb 15
Feb 16
Feb 17
Feb 18
Feb 19
Feb 20
Feb 21
CONFIDENTIAL © 2021 CoreLogic, Inc. All Rights Reserved. Source: CoreLogic, ABS 36Although investor activity has been trending higher,
proportionally the sector is only slightly off record lows. First
home buyer activity has surged but may be showing signs of
peaking.
Investor housing finance commitments as a % of total First home buyer housing finance commitments as a % of
housing finance commitments (based on value exc- refi) total owner occupier commitments
(based on value exc- refi)
50% 45%
45% 40%
40% 35%
31.7%
35% 35.4% 30%
30% 25%
23.9%
25% 20%
24.2%
20% 15%
Feb 05
Feb 07
Feb 09
Feb 11
Feb 13
Feb 15
Feb 17
Feb 19
Feb 21
Feb 05
Feb 07
Feb 09
Feb 11
Feb 13
Feb 15
Feb 17
Feb 19
Feb 21
CONFIDENTIAL © 2021 CoreLogic, Inc. All Rights Reserved. Source: CoreLogic, ABS 37Lifestyle markets in both
capital cities and regional
Australia generally saw an
uplift in dwelling values
over 2020.
This trend appears to be
continuing in 2021, though
it is expected the rate of
increase will start to ease
throughout the year.
CONFIDENTIAL © 2021 CoreLogic, Inc. All Rights Reserved. 38Residents moving from Melbourne and Sydney to regional areas
of NSW and Vic are driving a surge in internal migration towards
non-metro areas
Net internal migration Net internal migration to regional areas of Australia
Combined regional areas of Australia
12,000
12,000
Sep quarter 2019
10,000 Sep quarter 2020
10,000
8,000
8,000 6,000
4,000
6,000
2,000
0
4,000
-2,000
Regional WA
Regional NSW
Regional Qld
Regional SA
Regional Vic
Regional Tas
Regional Australia
Regional NT
2,000 Regional areas of Australia gained a record level of residents from the metro areas through the
September quarter of 2020. 11,247 more people arrived in the regional areas than departed which
was roughly double the number at the same time last year.
0
Sep 00 Sep 05 Sep 10 Sep 15 Sep 20
CONFIDENTIAL © 2021 CoreLogic, Inc. All Rights Reserved. Source: CoreLogic, ABS 39Internal migration through the year to June showed an
exacerbation of historic trends
Top 10 SA4s - Net Internal Migration estimate for Bottom 10 SA4s - Net Internal Migration estimate for
year to June 2020 year to June 2020
-2,403 Perth - North West
Gold Coast 6,709
-3,028 Melbourne - Inner East
Sunshine Coast 6,230
-3,533 Sydney - City and Inner South
Geelong 4,977
-3,570 Melbourne - Outer East
Moreton Bay - North 3,782
-3,838 Sydney - Inner West
Ipswich 3,630
Sydney - Baulkham Hills and Hawkesbury 3,448 -4,393 Sydney - North Sydney and Hornsby
Latrobe - Gippsland 3,347 -4,419 Melbourne - Inner
Hunter Valley exc Newcastle 2,830 -4,467 Sydney - Eastern Suburbs
Logan - Beaudesert 2,666 -8,473 Sydney - Inner South West
Perth - South West 2,338 -9,039 Sydney - Parramatta
CONFIDENTIAL © 2021 CoreLogic, Inc. All Rights Reserved. Source: CoreLogic, ABS 40Most sub markets across Australian regions have seen an
increase in dwelling values through the March quarter
Quarterly change in dwelling values – SA4 Regions
Select regional data
Change in values
Sales Vols Annual
Median Gross
Region Median value - 12 change in
12 rent yields
3 months months sales
months
Anna Bay $ 741,579 7.7% 21.7% 104 -1.0% $ 470 3.6%
Lake Munmorah -
Mannering Park $ 559,144 8.3% 15.5% 263 75.3% $ 400 4.2%
Morisset -
Cooranbong $ 606,535 5.6% 41.9% 367 35.4% $ 410 4.3%
Woolgoolga -
Arrawarra $ 642,374 9.0% 31.5% 297 16.9% $ 490 4.6%
Newcastle $ 707,441 7.7% 14.9% 3,852 13.5% $ 460 3.8%
Source: CoreLogic. Note all data is to April 30th with the exception of sales volumes, which is lagged to February 2021 at the
sub regional level. Sub regions are select SA2, SA3, SA4 and council regions based on ABS boundaries.
CONFIDENTIAL © 2021 CoreLogic, Inc. All Rights Reserved. 41Most sub markets across Australian regions have seen an
increase in dwelling values through the March quarter
Quarterly change in dwelling values – SA4 Regions
Select regional data
Change in values
Annual
Sales Vols - Median Gross
Region Median value change in
12 12 months rent yields
sales
3 months month
s
Ballarat $ 490,279 6.6% 10.2% 3,484 14.9% $ 340 3.9%
Geelong $ 667,324 7.8% 10.4% 6,757 18.1% $ 400 3.5%
Source: CoreLogic. Note all data is to April 30th with the exception of sales volumes, which is lagged to February 2021 at the
sub regional level. Sub regions are select SA2, SA3, SA4 and council regions based on ABS boundaries.
CONFIDENTIAL © 2021 CoreLogic, Inc. All Rights Reserved. 42Most sub markets across Australian regions have seen an
increase in dwelling values through the March quarter
Quarterly change in dwelling values – SA4 Regions
Select regional data
Change in values
Sales Vols - 12 Annual change Gross
Region Median value Median rent
12 months in sales yields
3 months
months
Burpengary $ 509,507 5.3% 6.9% 294 11.4% $ 365 5.1%
Buderim $ 760,504 8.8% 12.1% 1,453 16.2% $ 520 4.6%
Fraser Coast (R) $ 384,430 5.1% 12.7% 3,230 24.9% $ 360 5.6%
Logan (C) $ 428,647 4.2% 8.3% 5,652 15.2% $ 360 5.4%
Hervey Bay $ 416,648 5.0% 14.0% 1,908 24.9% $ 380 5.4%
Source: CoreLogic. Note all data is to April 30th with the exception of sales volumes, which is lagged to February 2021 at the
sub regional level. Sub regions are select SA2, SA3, SA4 and council regions based on ABS boundaries.
CONFIDENTIAL © 2021 CoreLogic, Inc. All Rights Reserved. 43Disclaimer
In compiling this publication, RP Data Pty Ltd trading as CoreLogic has relied upon information supplied by a number of external sources. CoreLogic
does not warrant its accuracy or completeness and to the full extent allowed by law excludes liability in contract, tort or otherwise, for any loss or
damage sustained by subscribers, or by any other person or body corporate arising from or in connection with the supply or use of the whole or any
part of the information in this publication through any cause whatsoever and limits any liability it may have to the amount paid to CoreLogic for the
supply of such information.
Queensland Data
Based on or contains data provided by the State of Queensland (Department of Natural Resources and Mines) 2021. In consideration of the State
permitting use of this data you acknowledge and agree that the State gives no warranty in relation to the data (including accuracy, reliability,
completeness, currency or suitability) and accepts no liability (including without limitation, liability in negligence) for any loss, damage or costs (including
consequential damage) relating to any use of the data. Data must not be used for direct marketing or be used in breach of the privacy laws.
South Australian Data
This information is based on data supplied by the South Australian Government and is published by permission. The South Australian Government does not
accept any responsibility for the accuracy or completeness of the published information or suitability for any purpose of the published information or the
underlying data.
New South Wales Data
Contains property sales information provided under licence from the Land and Property Information (“LPI”). CoreLogic is authorised as a Property Sales
Information provider by the LPI.
Victorian Data
The State of Victoria owns the copyright in the Property Sales Data which constitutes the basis of this report and reproduction of that data in any way
without the consent of the State of Victoria will constitute a breach of the Copyright Act 1968 (Cth). The State of Victoria does not warrant the accuracy or
completeness of the information contained in this report and any person using or relying upon such information does so on the basis that the State of
Victoria accepts no responsibility or liability whatsoever for any errors, faults, defects or omissions in the information supplied.
Western Australian Data
Based on information provided by and with the permission of the Western Australian Land Information Authority (2021) trading as Landgate.
Australian Capital Territory Data
The Territory Data is the property of the Australian Capital Territory. No part of it may in any form or by any means (electronic, mechanical, microcopying,
photocopying, recording or otherwise) be reproduced, stored in a retrieval system or transmitted without prior written permission. Enquiries should be
directed to: Director, Customer Services ACT Planning and Land Authority GPO Box 1908 Canberra ACT 2601.
Tasmanian Data
This product incorporates data that is copyright owned by the Crown in Right of Tasmania. The data has been used in the product with the permission of
the Crown in Right of Tasmania. The Crown in Right of Tasmania and its employees and agents:
a) give no warranty regarding the data's accuracy, completeness, currency or suitability for any particular purpose; and
b) do not accept liability howsoever arising, including but not limited to negligence for any loss resulting from the use of or reliance upon the data.
Base data from the LIST © State of Tasmania http://www.thelist.tas.gov.au
CONFIDENTIAL © 2021 CoreLogic, Inc. All Rights Reserved. 44Get in Touch
CALL US
Support, training, sales or account
1300 734 318
ValEx
1300 660 051
CUSTOMER SUPPORT OFFICE HOURS
Mon - Fri
7am - 7pm AEST
7am - 8:30pm AEDT
Sat
8:30am - 12:30pm AEST
Sun
Closed
CONFIDENTIAL © 2021 CoreLogic, Inc. All Rights Reserved. 45Craig Maidment
Managing Director, Ezi Build Group & QMR Constructions
Craig Maidment is Managing Director, Ezi Build Group and QMR
Constructions
Craig has extensive construction and development experience, having
worked within the Australian industry for twenty five years. He has
been involved in the construction of manufactured homes for eighteen
years, constructing more than 1,000 manufactured homes over that
period, from entry level to luxury homes in multiple communities. The
Groups have also been responsible for delivery of Community
Clubhouses and facilities.
Operating in Queensland through Ezi Build Group and NSW (QMR
Constructions), Craig has worked on multiple Ingenia projects including
Latitude One and Plantations.
46QMR Constructions
QMR Group projects include Plantations and Latitude One.
The Group will construct Ingenia’s first ‘Green Home’ at Plantations this year.
47Questions
48Thank You
49Disclaimer
This presentation was prepared by Ingenia Communities Holdings Limited (ACN 154 444 925) The forward looking statements included in this presentation involve subjective judgment and
and Ingenia Communities RE Limited (ACN 154 464 990) as responsible entity for Ingenia analysis and are subject to significant uncertainties, risks and contingencies, many of which are
Communities Fund (ARSN 107 459 576) and Ingenia Communities Management Trust (ARSN outside the control of, and are unknown to, the Group. In particular, they speak only as of the
122 928 410) (together Ingenia Communities Group, INA or the Group). Information contained date of these materials, they assume the success of the Group’s business strategies, and they
in this presentation is current as at May 2021 unless otherwise stated. are subject to significant regulatory, business, competitive and economic uncertainties and
risks. Actual future events may vary materially from forward looking statements and the
This presentation is provided for information purposes only and has been prepared without
assumptions on which those statements are based. Given these uncertainties, readers are
taking account of any particular reader’s financial situation, objectives or needs. Nothing
cautioned not to place undue reliance on such forward looking statements.
contained in this presentation constitutes investment, legal, tax or other advice. Accordingly,
readers should, before acting on any information in this presentation, consider its The Group, or persons associated with it, may have an interest in the securities mentioned in
appropriateness, having regard to their objectives, financial situation and needs, and seek the this presentation, and may earn fees as a result of transactions described in this presentation or
assistance of their financial or other licensed professional adviser before making any transactions in securities in INA.
investment decision. This presentation does not constitute an offer, invitation, solicitation or
This document is not an offer to sell or a solicitation of an offer to subscribe or purchase or a
recommendation with respect to the subscription for, purchase or sale of any security, nor does
recommendation of any securities, including in the United States or any other jurisdiction in
it form the basis of any contract or commitment.
which such an offer would be illegal.
Except as required by law, no representation or warranty, express or implied, is made as to the
fairness, accuracy or completeness of the information, opinions and conclusions, or as to the
reasonableness of any assumption, contained in this presentation. By reading this presentation
and to the extent permitted by law, the reader releases each entity in the Group and its
affiliates, and any of their respective directors, officers, employees, representatives or advisers
from any liability (including, without limitation, in respect of direct, indirect or consequential loss
or damage or loss or damage arising by negligence) arising in relation to any reader relying on
anything contained in or omitted from this presentation.
APPROVED FOR LODGEMENT BY THE CHAIRMAN OF INGENIA COMMUNITIES GROUP
50You can also read