Does Social Distancing Matter? - Michael Greenstone and Vishan Nigam - University of Chicago
←
→
Page content transcription
If your browser does not render page correctly, please read the page content below
WORKING PAPER · NO. 2020-26

Does Social Distancing Matter?
Michael Greenstone and Vishan Nigam
MARCH 2020

                                      5757 S. University Ave.
                                          Chicago, IL 60637
                                         Main: 773.702.5599
                                           bfi.uchicago.edu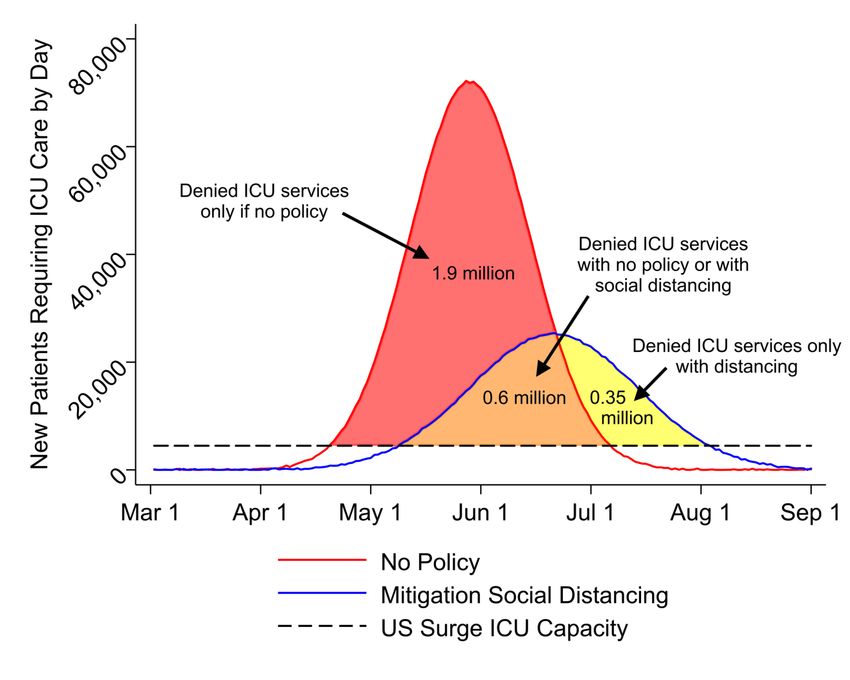
Does Social Distancing Matter?1

                                    Michael Greenstone*
                                University of Chicago and NBER

                                        Vishan Nigam
                                     University of Chicago

                                          March 2020

                                                Abstract
This paper develops and implements a method to monetize the impact of moderate social
distancing on deaths from COVID-19. Using the Ferguson et al. (2020) simulation model of
COVID-19’s spread and mortality impacts in the United States, we project that 3-4 months of
moderate distancing beginning in late March 2020 would save 1.7 million lives by October 1. Of
the lives saved, 630,000 are due to avoided overwhelming of hospital intensive care units.
Using the projected age-specific reductions in death and age-varying estimates of the United
States Government’s value of a statistical life, we find that the mortality benefits of social
distancing are about $8 trillion or $60,000 per US household. Roughly 90% of the monetized
benefits are projected to accrue to people age 50 or older. Overall, the analysis suggests that
social distancing initiatives and policies in response to the COVID-19 epidemic have substantial
economic benefits.

1
  Greenstone (mgreenst@uchicago.edu, corresponding author*) and Nigam
(vnigam@uchicago.edu) contributed equally to this work. The authors declare no competing
interests. We thank Claire Fan, Ian Pitman, Catherine Che, and especially Alice Schmitz for
excellent research assistance; and Orley Ashenfelter, Magne Mogstad, Ishan Nath, Jonathan
Cohen, Chinmay Lohani and Atakan Baltaci for several valuable conversations. All errors are our
own.

Preprint: https://papers.ssrn.com/sol3/papers.cfm?abstract_id=3561244
Code and data: https://www.michaelgreenstone.com/paperscategories#vsl

                                               1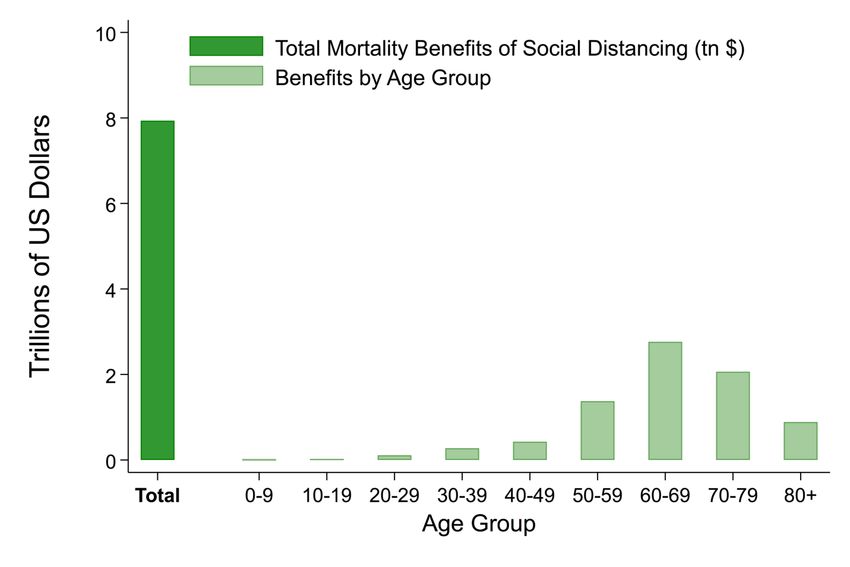
Introduction

        The novel coronavirus (COVID-19) pandemic is considered the greatest public health threat since
the 1918 Influenza Pandemic that infected one-third of the world’s population and killed at least 50
million people. COVID-19 cases and fatalities are growing exponentially and there is much uncertainty
about its ultimate impacts globally. Perhaps as unsettling as these estimates is the uncertainty around
the health impacts that are wracking societies with fear.

In the absence of vaccines, countries around the world are implementing various forms of “social
distancing” as a policy to slow the virus’ spread. This social distancing takes many forms but, at its core,
its aim is to keep people apart from each other by confining them to their homes in order to reduce
contact rates. The impacts of social distancing are evident in the data from China, especially when
compared with Italy which implemented social distancing policies more slowly and sporadically. At the
same time, the economics costs are clear in the Chinese and Italian data, and in the US Goldman Sachs is
projecting quarter on quarter annualized growth rates of -6% in Q1 and -24% in Q2 (Hatzius et al. 2020).
Further, historically unprecedented US unemployment claims have begun to arrive and the near term
outlook for the job market is grim (Hatzius et al. 2020). The demonstrated benefits in China (as well as
South Korea and Singapore) and the sharp and large economic costs naturally raise critical questions
about whether social distancing is worth it (Hilsenrath and Armour 2020; Bender and Ballhaus 2020;
Thunstrom et al. 2020).

This paper develops and implements a method to estimate the economic benefits of social distancing.
Our baseline finding is that a moderate form of social distancing is projected to reduce fatalities by 1.76
million in the next 6 months and that would produce economic benefits worth $7.9 trillion. These
benefits are over one-third of US GDP and larger than the entire annual federal budget. Distributed
among US households, they are roughly equal to current median household income of $60,000.

Further, these benefits are likely a lower bound. This is because they do not account for social
distancing’s impact on reducing uncertainty about mortality impacts, the potential for reducing
morbidity rates, and improving quality of medical care for non-COVID-19 medical problems. It is also
worth underscoring that the estimates depend on assumptions about the value of a statistical life (VSL)

                                                      2
and estimated benefits remain substantial when other plausible assumptions are made. Finally, we find
that the benefits from social distancing also remain substantial in less aggressive COVID-19 scenarios;
for example, the benefits of social distancing are $3.6 trillion even in a scenario where the peak of daily
death rates is 60% lower than in the Imperial College model (Ferguson et al. 2020) of COVID-19 spread
that we rely on in this paper.
The method has two main steps. First, we compare two scenarios from the prominent Ferguson et al.
(2020) COVID-19 study: a mitigation scenario, which they define as “combining home isolation of
suspect cases, home quarantine of those living in the same household as suspect cases, and social
distancing of the elderly and others at most risk of severe disease” that lasts for 3-4 months, and a “no
policy” scenario. The mitigation scenario is projected to reduce the number of COVID-19 caused
fatalities by a total of 1.76 million over a 6-month period, relative to the no policy scenario. This
reduction in fatalities is composed of 1.13 million fewer deaths of COVID-19 patients treated in
hospitals, particularly in intensive care units (ICUs); and 0.63 million fewer deaths of COVID-19 patients
that are unable to receive ICU care because of pandemic-related overcrowding.
Second, the reduction in fatalities from the mitigation scenario is divided into 9 age categories and then
monetized using the United States Government’s VSL that we adjust for age (Thaler and Rosen 1976;
Ashenfelter and Greenstone 2004; Murphy and Topel 2006; OMB 2003; US EPA 2015). In total, the
benefits from the mitigation scenario equal $7.9 trillion. Deaths avoided and monetized benefits are
unequal: cohorts under age 50 comprise 11% of monetary benefits (3% of total deaths avoided); ages
50-69 comprise 52% of monetary benefits (28% of avoided deaths), and those 70 and older comprise
37% of monetary benefits (69% of avoided deaths). The differences in monetary benefits across age
groups reflect that COVID-19 mortality rates are increasing in age while the VSL is generally decreasing
in age.
Finally, we note that the particular benefits estimates are only as reliable as Ferguson et al.’s projections
on COVID-19’s spread and health risks. The method can be used with any set of projections, so as more
information arrives and research advances, this approach can be applied to other projections and to
infer the benefits of alternative policy responses.
The remainder of the paper is organized as follows. Section I describes our methods to project the direct
3and “overflow” COVID-19 caused deaths, based on Ferguson et al. (2020). Section II describes our
approach to monetizing the avoided deaths in order to develop an estimate of the benefits of the
mitigation social distancing scenario. Finally, Section III interprets the results, discusses some caveats,
and concludes.
I. Mortality Impacts of Social Distancing
This section develops estimates of the projected mortality impacts of COVID-19, exclusively relying on
Ferguson et al.’s (2020) “individual-based simulation model” that was developed to support pandemic
influenza planning. The paper, which has been highly influential in the policy arena, combines data on
early outbreaks of COVID-19 with demographic and hospital availability data from the United States to
project the infection rates, hospitalization rates, demand for critical care, and mortality rates. It
attempts to discipline these projections with data on COVID-19 experiences in China, Italy, Great Britain,
and the United States (Ferguson et al. 2020).
Our emphasis is on Ferguson et al.’s “no policy” and mitigation social distancing scenarios. In the no
policy scenario, there is uncontrolled growth of the coronavirus pandemic that leads to an 81% infection
rate in the United States by October 1 and 2.2 million deaths. As a basis of comparison, in late February
the CDC projected a 48-65% infection rate and deaths of 0.16 million (with a 0.25% infection fatality
rate) to 1.7 million (1% fatality rate) over a year starting March 2020 (Fink 2020). Importantly, other
empirical studies now point to a case fatality rate close to 1% (Verity et al. 2020, Mizumoto and Chowell
2020), and other expert estimates suggest a 30-70% US-wide infection rate (Axelrod 2020, Ramsey
2020). The Ferguson et al. estimates, while slightly more pessimistic, are thus broadly consistent with
other projections of COVID-19 transmission.
The mitigation scenario emphasized by Ferguson et al. is a moderate form of social distancing that
consists of 7-day isolation for anyone showing coronavirus symptoms, a 14-day voluntary quarantine for
their entire household, and dramatically reduced social contact for those over 70 years of age.2 All
measures begin in late March. The isolation and household quarantine measures are assumed to be in
2
Ferguson et al. also model other subsets of mitigation, such as school and university closures, but these have
limited impact and the mortality impacts are not emphasized.
4place for three months and reduced contact for people over 70 lasts four months. Ferguson et al.
project that the mitigation scenario will reduce peak hospital demand by two-thirds and total deaths to
1.1 million.
We focus on the mitigation scenario because it approximates what the United States is implementing,
albeit unevenly across the country. With perhaps the exception of California, Washington and New York,
most US states have not pushed China-style shutdowns of the level necessary to suppress COVID
transmission (Glanz et al. 2020). In other words, the US may “flatten the curve” of infection but not stop
it entirely. Ferguson et al. also make projections about a “suppression” scenario that includes
dramatically reduced contact for the entire population, and involves either a rebound epidemic (that
strongly resembles our mitigation scenario) or repeated imposition of social distancing for two years.
We view the latter as far from anything being implemented in the United States. One thing to note is
that both the no policy and mitigation scenarios only extend through October 1, so it is reasonable to
assume that a vaccine will not be developed in this timeframe.
A novel feature of our analysis is that we improve upon Ferguson et al.’s estimated mortality projections
by accounting for the potential shortages in the supply of hospital intensive care services, for example
ICU beds, respirators, and trained staff. Specifically, Ferguson et al.’s headline death projections assume
that all COVID-19 patients receive the appropriate medical care, so their projections do not account for
potential shortages in ICU beds or respirators. Indeed, it is precisely the possibility of these shortages
that account for the policy push to “flatten the curve” and avoid their repercussions. Our approach is to
label the Ferguson et al. projections of deaths as “direct deaths” and develop projections of “overflow
deaths” which are those that result from hospital ICUs reaching capacity and being unable to serve some
COVID-19 patients. As we detail, we project that social distancing would reduce overflow deaths by an
additional 630,000 fatalities.
In summary, we project that social distancing reduces COVID-19 caused deaths by 1.76 million deaths.
This is composed of reductions of 1.13 million direct deaths and 630,000 overflow deaths. The
remainder of this section describes how we develop these projections of the reductions in direct and
overflow deaths due to social distancing and their distribution across 9 age categories.
5Fig 1. Modeling of Direct Deaths from COVID-19
Notes: Figure shows how we construct daily direct deaths under various social distancing policies. The original
distribution of US deaths with no policy from Ferguson et al. (2020) is given in Panel A. Panel B shows our normal
approximation of this distribution, and a similar policy under mitigation social distancing. Total direct deaths (areas
under the curves) are 2.2 million with no policy and 1.1 million with mitigation social distancing, exactly matching
reported deaths in Ferguson et al.
A. Direct Deaths
We begin by reproducing the Ferguson et al. estimates of direct deaths in the US: 2.2 million with no
policy and 1.1 million with “mitigation” social distancing. To do so, we develop a method that, under
simple assumptions about the progression of coronavirus, allows us to construct the full daily
distribution of deaths. This step is necessary because it was infeasible to acquire the full dataset
underlying the Ferguson et al. analysis, undoubtedly due to the great demands placed on the authors as
they model the progression of COVID-19 and replay updated findings to policymakers.
Our approach assumes that daily COVID-19 cases, deaths, and ICU bed demand follow a normal
distribution. Normal distributions roughly approximate epidemic growth curves, which are slightly right-
skewed since they grow exponentially until reaching herd immunity. Normality is also convenient
because given the center (date of peak), height at peak, and width (distance from start to peak), it is
possible to recover the full distribution (i.e., daily fatality counts).
6For an example of our strategy, consider Figure 1. Panel A reproduces Ferguson et al.’s distribution of
daily deaths, which we extracted from their paper.3 The center of the distribution is around June 1 and
the standard deviation visually appears to be about 16 days, so we can plot a normal distribution. Lastly,
about 55,000 deaths per day happen at the peak. We then scale the entire distribution to peak at that
value and sum deaths across all days to obtain total deaths from March 1 to October 1, 2020. So
although we don’t have the underlying data, we are able to reproduce this distribution with the red line
in Panel B; our reconstructed version adds up to the same 2.2 million direct deaths that Ferguson et al.
project for their no policy scenario by construction.4 The blue distribution in Panel B for daily deaths
under the mitigation scenario is recovered with the same approach and, again by construction, produces
exactly the 1.1 million deaths that Ferguson et al. project.5
The bottom line from this analysis is that social distancing is projected to reduce the number of COVID-
19 deaths by 1.1 million between March 1 and October 1. This is simply the difference in the number of
direct deaths in the no policy and mitigation scenarios.
B. Overflow Deaths
We next estimate ICU overflow deaths under the no policy and mitigation scenarios, as well as their
difference which is the number of fatalities averted through COVID-related social distancing. We believe
that these are the first projections of overflow deaths or, put more plainly, the mortality costs of failing
to “flatten the curve”. Previous work (e.g., Ferguson et al. 2020, Jha et al. 2020) project hospital bed and
ventilator needs in excess of capacity, but do not project the impact of these shortages on total
fatalities.6
3
Panel A corresponds to the US curve in Figure 1a of Ferguson et al. (2020), which is expressed in deaths per
100,000 people; we multiply through by the US population to obtain total US deaths.
4
For some distributions, we have even less information. The only Ferguson et al. (2020) plot showing curves with
and without moderate distancing is for critical care cases in Great Britain, not deaths in the USA. However, that
plot still lets us infer that the epidemic peak is one-third as high and takes 40% more time to occur relative to April
1, and has a 40% larger standard deviation, compared to no policy. These points are sufficient to construct direct
deaths with mitigation in the United States.
5
We add a mean zero error to our reconstructed normal distributions, such as in Panel B.
6
The challenge in estimating overflow deaths is that the death rate changes as a function of the number of
patients, so a standard SIR model that takes COVID-19 death rates at an input will not directly capture this
phenomenon. In contrast, empirical comparisons between overwhelmed and calmer hospital systems (ex: Wuhan
vs. rest of China) are challenging because distancing policies are most severely implemented in overwhelmed
areas, confounding comparisons.
7A little background on ICU services is helpful to understand this calculation. Patients in the ICU receive
specialized beds, ventilators, and care from doctors and nurses with specialized training. The United
States has 85,000 beds in intensive care units (Tsai et al. 2020). Of those, 32,000 (37%) are unoccupied
and immediately available to treat COVID-19 patients. The total number of beds that COVID-19 patients
could fill, known as “surge” capacity, lies between the two. In times of emergency, some space can be
made by canceling elective surgeries, but cancer patients and others with ongoing treatment must stay
put. We follow Ferguson et al. in assuming ICU “surge” capacity of 45,000 beds (=32,000 unoccupied ICU
beds plus 13,000 ICU beds made available by canceling elective surgeries).7 Increasing ICU capacity any
further requires new physical beds and equipment, as well as proportional increases in the number of
ICU doctors and nurses.
The first step in projecting overflow deaths is then to project the number of ICU beds available each day
for COVID-19 patients and the daily number of new patients in need of ICU care. We follow Ferguson et
al. and assume that each ICU patient occupies a bed for exactly 10 days. Given the surge capacity of
45,000 ICU beds8, this means that a total of 4,500 ICU beds become available each day for COVID-19
patients. Ferguson et al. projects the number of new COVID-19 patients that need ICU services each day
for both scenarios.9
Figure 2 reports the results from this exercise. The dashed black line is the number of ICU beds that
become available each day for COVID-19 patients in need of ICU-level care. The red and blue
distributions are the number of new COVID-19 patients that require ICU services each day under the no
policy and mitigation social distancing scenarios, respectively. The patients underneath the dashed black
line receive ICU services, while those above it are projected to be denied them.
Under social distancing, 1.57 million fewer COVID-19 patients that merit ICU services are denied them.
Specifically, the no policy number of COVID-19 patients in need of ICU services that are denied them is
equal to the sum of the left (1.92 million) and center (0.60 million) shaded regions. In the mitigation
social distancing scenario, this is equal to sum of the center (0.60 million) and right (0.35 million)
7
The authors assume the US has 14 ICU beds per 100,000 people, which is 45,000 overall. This is slightly lower
than the Tsai et al. (2020) estimate of 58,000 potentially available ICU beds.
8
Ferguson et al. (2020) report that US ICU surge capacity is 14 beds per 100,000 people; we multiply by US
population and divide by 10 days/ICU patient to obtain the ICU surge capacity shown in Figure 2.
9
Plots in Ferguson et al. (2020) are of projected ICU beds occupied by day, which we divide by 10 days per ICU
patient to obtain the number of new patients per day, as shown in Figure 2.
8Fig 2. Predicted ICU Patient Flows
Notes: Figure illustrates our computation of overflow deaths from patients unable to receive ICU care. Daily flows
of patients requiring ICU care are constructed from Ferguson et al. (2020) projections of bed demand. Patients
above US surge capacity (black line) are denied ICU treatment: the red and orange areas with no policy and the
orange and yellow areas with “mitigation” social distancing. The difference of 1.6 million represents COVID-19
patients denied ICU treatment, each of which has a 50% chance of survival with ICU treatment (Ferguson et al.
2020) and a 10% chance of survival of denied care.
regions. Therefore, the benefit of social distancing (i.e., the difference in these two numbers) is the
difference between these two numbers or 1.57 million.
The prospects for these 1.57 million ICU indicated, but denied, patients are poor and we project that an
additional 630,000 of them would die. This calculation requires an estimate of the difference in
mortality rates for ICU-indicated COVID-19 patients who can and cannot get ICU services. We rely on
Ferguson et al.’s assumption that the survival rate for ICU-level COVID-19 patients in ICUs is 50% and our
read of the literature that suggests that the survival rate falls to 10% or below if they are denied ICU
services (Emanuel et al. 2020, Long et al. 2015). In summary, 1.57 million coronavirus ICU patients face a
940% higher death rate in the no policy scenario, relative to the mitigation social distancing scenario. Put
another way, social distancing reduces the projected number of overflow deaths by 630,000 in the
United States between March 1 and October 1, 2020, providing a quantitative rationale for efforts to
“flatten the curve”.
C. Age Distribution of COVID-19 Deaths
The next step in the analysis is to assign projected COVID-19 caused deaths – which we have computed
for the entire US population – to age groups. Ferguson et al. (2020) report the distribution of total
deaths from the no policy scenario across 9 age groups (i.e., 0-9, 10-19, … , 70-79, and 80+).10 We apply
this same distribution of total deaths to the mitigation scenario. This is not an innocuous assumption,
because the marginal deaths in this scenario may have a different age distribution, but alternative
information is unavailable.11
II. The Monetary Value of Social Distancing
This section describes our approach to monetizing reductions in fatalities and then uses it to develop an
estimate of the benefits of the mitigation social distancing scenario, relative to the no policy scenario.
A. The Value of a Statistical Life and the Monetary Benefits of Changes in Mortality Rates
It is natural to consider social distancing like any of hundreds of policies that aim to reduce the risks that
people face. As just one example of such policies, governments pay for guardrails on the side of roads,
because they increase survival rates in car accidents. A policy like social distancing similarly increases
survival rates.
To convert the main benefit of social distancing – reducing the mortality impact of COVID-19 – into
dollar terms, we turn to the value of a statistical life (VSL). The VSL is a tool from economic theory which
is now a standard ingredient in the cost-benefit analyses that undergird decision-making by the United
States Government, and scores of foreign, state, and local governments (OMB 2003). In principle, the
VSL measures how much the average US citizen is willing to pay for a reduction in the probability of
10
Ferguson et al. report the infection fatality rate and probability of requiring ICU care by age group. We multiply
each by 2017 age-group population from the US Census to obtain the age-wise distribution of direct and
overflow deaths, respectively.
11
In an extreme case, suppose distancing purely inhibits coronavirus from reaching nursing homes; if so, our
approach will project deaths to elderly populations when in reality none have died.
10death.12 It is one statistical life, which is a reduction in mortality rates equivalent to saving one life on
average. For instance, suppose the average American is willing to pay $10,000 to avoid a 0.1% chance of
death, then the VSL is equal to $10,000/0.001 lives saved or $10 million per statistical life saved. So, a
policy that is expected to save 1 life has $10 million in social benefits.
There are two reasons, one theoretical and one practical, to use the VSL to capture the benefits of social
distancing policies. First, the VSL captures the full benefits an individual expects to derive from her own
life, including from leisure, time with friends and family, and consumption of goods and services. The
legal system often relies on individual’s remaining lifetime earnings, but such a measure fails to capture
many features of what people value about their life, including their consumption of non-market goods
like leisure time spent with family members (Murphy and Topel 2006).
Second, our approach is a standard one: US federal agencies such as the EPA and Department of -
Transportation have used the VSL for many decades to evaluate a long list of policies in a variety of
domains (transportation and environment are two common areas). These policies, like social distancing,
have benefits measured in lower mortality but costs measured in dollars; the VSL allows the US
government to compare the two, rather than neglecting that which cannot be valued.
In practice, we compute the social benefits of reducing COVID-19 mortality rates as:
;;?
!"#"$%&' = *+,- ∗ (0-123456 ∗ 789- + 0- ∗ 789- )
-
where j is the age group. 0-123456 is the reduction in the direct death rate from implementation of the
moderate social distancing scenario, relative to the no policy scenario, that was outlined in Section I A.
;;?
0- is the analog for ICU overflow deaths rate that was described in Section I B. Finally, 789- is
the 2017 US population for the j age group and *+,- is the value of a statistical life that is allowed to
vary with age. The VSL is allowed to vary with age following Murphy and Topel (2006), but we require
the average for people 18 and over to equal $11.5 million13 which matches the EPA’s VSL for adults (US
EPA 2015).
12
It is important to underscore that the VSL is not the amount of money that a person would be willing to trade for
certain loss of life (presumably all of their wealth) but rather for a small change in the probability of death.
13
The US EPA employs a 2020 VSL of $9.9 million in 2011 dollars as part of the Clean Power Plan Final Rule
Regulatory Impact Analysis. This estimate accounts for income growth to 2020; adjusting for inflation, the VSL is
$11.5 million in 2020 dollars.
11B. Empirical Estimates of the Monetary Benefits of Social Distancing
Table 1 summarizes the paper’s key results. The rows report on each of the 10 age categories and the US
total. Column (1) reports the total US population. Columns (2d) details the projected reduction in direct
deaths due to social distancing, with columns (2a) – (2c) reporting the ingredients in this calculation.
Columns (3a) – (3d) repeat this exercise for overflow deaths. The total reduction in deaths due to social
distancing (i.e., the sum of (2d) and (3d)) is reported in (4a). (4b) lists the age-specific VSL, which reflects
the fact that income and remaining life expectancy vary across ages and many influence willingness-to-
pay for reductions in mortality risk. To obtain column (4b) We obtain estimates of the VSL-age
distribution from the authors of Murphy and Topel (2006) and rescale so that the population-weighted
average for US adults (18+) equals the US EPA VSL of $11.5 million. Finally, column (4c) reports the
monetized value of the projected reduction in fatalities due to social distancing.
The topline result is that social distancing is projected to reduce COVID-19 caused fatalities by 1.76
million by October 1 and that this is worth $7.9 trillion. This projected reduction in fatalities is composed
of 1.13 million fewer deaths of COVID-19 patients receiving appropriate treatment (i.e., direct deaths)
and 0.63 million fewer deaths of COVID-19 patients that are unable to receive ICU care because of
pandemic related overcrowding (i.e., overflow deaths).
Figure 3 illustrates that the impacts are strikingly heterogeneous across age categories. People under
the age of 50 have $0.85 trillion (11%) of total benefits, reflecting their low chance of death from COVID-
19. People aged 50-69 have $4.14 trillion (52%) of total benefits, almost double their share of deaths
avoided through social distancing; in contrast, people 70 and older get $2.95 trillion (37%) of benefits
despite comprising over two-thirds of deaths avoided. Cohorts aged 50-69 have larger total benefits
than the 70+ group because the former have a higher VSL, reflecting the greater remaining life
expectancies and expected future incomes of younger cohorts. More generally, it is apparent that
COVID-19’s risks and the benefits of social distancing are disproportionately concentrated among the
older age groups.
12Table 1. Social Distancing’s Projected Mortality Benefits and their Valuation in the United States
Table 1: Social Distancing Benefits Americans By Lowering Chance of Death
Population Direct Deaths Overflow Deaths All
No Mitigation No Mitigation
Policy Distancing Difference Policy Distancing Difference
(1) (2a) (2b) (2c) (2d) (3a) (3b) (3c) (3d) (4a) (4b) (4c)
Age US pop in Pct Pct Pct Death Pct Pct Pct Death Death VSL in Benefits in
group millions of pop of pop of pop count of pop of pop of pop count count million USD trillion USD
0-9 39.8 0.001 0.001 0.001 265 0.001 0.000 0.000 177 442 14.7 0.01
10-19 41.4 0.004 0.002 0.002 827 0.002 0.001 0.001 554 1,381 15.3 0.02
20-29 45.0 0.020 0.010 0.010 4,487 0.009 0.003 0.005 2,405 6,892 16.1 0.11
30-39 42.7 0.052 0.026 0.027 11,364 0.023 0.009 0.014 6,091 17,455 15.8 0.28
40-49 40.2 0.098 0.048 0.050 20,032 0.045 0.017 0.028 11,048 31,080 13.8 0.43
50-59 42.9 0.391 0.192 0.200 85,635 0.179 0.069 0.111 47,598 133,234 10.3 1.38
60-69 36.4 1.435 0.704 0.732 266,364 0.656 0.250 0.405 147,585 413,949 6.7 2.76
1
70-79 21.3 3.327 1.631 1.696 362,001 1.514 0.578 0.936 199,692 561,694 3.7 2.06
80+ 12.4 6.067 2.974 3.093 382,484 2.791 1.066 1.725 213,339 595,824 1.5 0.89
US Total 1,133,460 628,491 1,761,951 7.94
Notes: Table explains how projected deaths averted through social distancing are converted to their value to Americans. Mitigation-type social distancing reduces the average
person’s chance of dying directly from COVID-19 by the rate in column (2c) (e.g., 3.1 percent for people 80+), and additionally reduces the probability of death from hospital
overcrowding by (3c). We scale by total population to compute statistical lives saved (2d) and (3d). Lastly, we sum lives saved and multiply by the VSL to compute total benefits;
VSLs are lower for older populations because of lower incomes and life expectancies. The benefits in (4c) therefore represent the total value to all Americans of the reductions in
mortality risk in (2c) and (2d), not the value of saving any particular life with certainty.
13Fig 3. Monetary Benefits of Projected Mortality Reductions from Social Distancing
Notes: Figure shows total benefits (willingness-to-pay) for reduced COVID-19 mortality through social distancing.
Total benefits of 7.94 trillion dollars equal the sum across age groups, where each age group’s benefits are the
change in expected mortality times the age-specific value of a statistical life. Despite facing lower mortality risk
than above-70 cohorts, 50-59 and 60-69 year olds see large benefits because they have more years left to live and
therefore higher VSLs.
C. Robustness to Alternative Assumptions
The credibility of the estimated $8 trillion in benefits relies directly on parameters in the Imperial
College model. This subsection examines how the monetized benefits of the mitigation social distancing
scenario change under alternative assumptions about the virulence of the no policy scenario and surge
ICU capacity, as well as the choice of an alternative VSL.
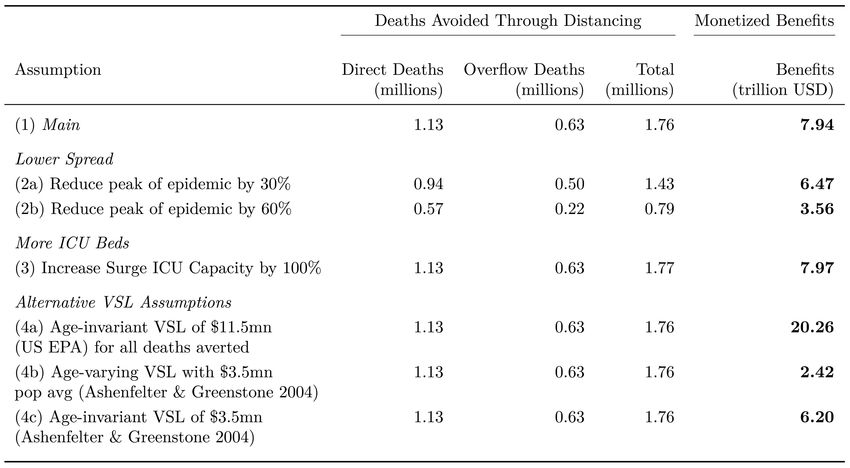
Table 2 reports on this exercise. Row (1) repeats the findings from this paper’s baseline analysis. We
consider what happens if the peak daily mortality rate is reduced, through any of a variety of
mechanisms including lower infection rates and lower mortality rates conditional on infection. A
reduction in the peak daily mortality rate by 30% reduces the benefits of social distancing to $6.5 trillion
(row (2a)), while a 60% reduction decreases it to $3.6 trillion (row (2b)). Row (3) reveals that although
doubling ICU capacity would meaningfully reduce the costs of COVID-19 it would have little impact on
14Table 2. Monetary Benefits of Projected Mortality Reductions from Social Distancing with Alternative
Assumptions
Notes: Table shows that that the total benefits of mortality reductions due to social distancing are similar under a
series of alternative assumptions. (1) is the main estimate. In (2), we assume the peak of the epidemic, in terms of
cases and deaths per day, was some fraction lower than in Ferguson et al. (2020). In (3) we double US surge ICU
bed capacity and find a similar estimate of benefits, since ICU capacity increases lead to fewer deaths both with
and without distancing. In (4a) we apply the US EPA 2020 VSL of $11.5 million to all deaths averted, without
accounting for patient age, and show that under US regulatory practice the estimated benefits would be over $20
trillion. (4a) is analogous to (1) except that it uses a VSL of $3.5 million, obtained from Ashenfelter and Greenstone
(2004) and adjusted for inflation and income growth to 2020. (4c) is analogous to (4a) but uses the updated
Ashenfelter and Greenstone (2004) VSL.
the benefits of social distancing. This may seem surprising, but it is because the benefits of additional
ICU capacity are roughly equal in both the no policy and mitigation social distancing scenarios.
Lastly rows (4a) – (4c), report the social benefits when alternative assumptions about the VSL are
implemented. Row (4a) applies an age-invariant version of the US Government’s VSL of $11.5 million,
rather than allowing it to vary with age as is done throughout the rest of the paper (US EPA 2015). In
this case, the total social benefits are about $20 trillion, more than 2.5 times larger than the baseline
estimates. This finding is not surprising in light of the high proportion of saved lives that occur among
people older than 60, who have relatively low VSLs in Table 1 because of their lower remaining life
expectancy. While the age-invariant VSL has a legal basis in that it is US Government policy, it is
challenging to justify from economic first principles of individual behavior.
15Rows (4b) and (4c) use an updated version of Ashenfelter and Greenstone’s (2004) estimate of the VSL,
which equals $3.5 million when we adjust upwards14 for income growth to 2020 and convert into
current dollars. This lower VSL naturally produces smaller estimates of the benefits of distancing. With
age adjustment, the total social benefits are $2.4 trillion, and without age adjustment they are $6.2
trillion. It is evident that assumptions about the VSL play an important role in our exercise, but even at
the lower end social distancing still produces benefits of several trillion dollars.
III. Interpretation and Conclusions
In this paper, we monetize one benefit of social distancing policies: a lower chance of dying from COVID-
19. Building on Ferguson et al., we show that a moderate social distancing scenario, implemented
nationwide, is projected to save 1.76 million lives in the United States, including 0.63 million purely from
shortages of hospital ICU beds. Applying estimates of the VSL based on economic theory and pegged to
the US government VSL, the paper finds that Americans would be willing to pay approximately $8 trillion
for this reduction in mortality risk. Put another way, the estimated benefits of this mitigation social
distancing scenario are roughly $8 trillion.
It is worth taking a moment to contextualize this finding. $8 trillion is over one-third of US GDP and
larger than the entire annual federal budget. Put another way, the benefits of social distancing are
roughly equal to current median household income of $60,000. Whether in regular times or during a
pandemic, it is difficult to think of any intervention with such large potential benefits to American
citizens. Importantly, while we measure benefits of distancing in dollars, they reflect the high value
Americans place on small reductions in their chance of death – including consumption, leisure, time with
family, and other aspects of life not easily monetized.
It is likely that the $8 trillion figure is an underestimate of social distancing’s benefits because it misses
several other channels. For example, the analysis does not account for the reduction in uncertainty
around the mortality impacts of COVID-19, and valuing it in ways that reflect measured risk aversion
would certainly increase the benefits. There is also the potential for social distancing to reduce the rates
of non-fatal sickness experienced by the population, although this ultimately depends on the impacts on
14
Consistent with existing literature (e.g., Carleton et al. 2019), we use an elasticity of the VSL with respect to
income of unity to adjust the Ashenfelter and Greenstone (2020) VSL to the present.
16long run infection rates (Yang et al. 2020). Almond (2006) is an important data point, because it
documents substantial long-run damages from in utero exposure to the 1918 influenza pandemic.
Further, it seems reasonable to presume that social distancing will increase the quality of care for non-
COVID-19 medical problems by reducing the strain on medical providers, facilities, and supplies. Finally,
it seems plausible that the changes in mortality rates being considered here are “non-marginal”; the
available evidence suggests that the VSL is increasing for non-marginal changes in fatality risk, meaning
that the analysis should use a larger VSL (Greenberg et al. 2020).
While it is tempting to undertake a full cost-benefit analysis of social distancing, this would require
reliable estimates of its substantial costs. We are unaware of comprehensive estimates of these costs
and their development is beyond the scope of our analysis, so the paper cannot go further than
developing an estimate of the gross benefits of social distancing.
Finally, we are undoubtedly in the early days of learning about COVID-19 and the potential policy and
societal responses. This paper’s broadest finding is that it has developed a method to estimate the
monetary benefits of social distancing and other policy responses to COVID-19 as they emerge.
17References
1. Almond, D. 2006. Is the 1918 Influenza Pandemic Over? Long-Term Effects of In Utero Influenza
Exposure in the Post-1940 U.S. Population. Journal of Political Economy, 114(4), 672-
712.
2. Ashenfelter, O. and Greenstone, M., 2004. Using Mandated Speed Limits to Measure the Value
of a Statistical Life. Journal of Political Economy, 112(S1), S226-S267.
3. Axelrod, Jim. March 2, 2020. “Coronavirus may infect up to 70% of world’s population, expert
warns,” CBS News.
4. Axelrod, Carleton, T., Delgado, M., Greenstone, M., Houser, T., Hsiang, S., Hultgren, A., Jina, A.,
Kopp, R.E., McCusker, K., Nath, I. and Rising, J., 2018. Valuing the global mortality
consequences of climate change accounting for adaptation costs and benefits.
5. Ferguson, Neil M., et al. March 16, 2020. "Impact of non-pharmaceutical interventions (NPIs) to
reduce COVID-19 mortality and healthcare demand." London: Imperial College COVID-
19 Response Team.
6. Fink, Sheri. March 13, 2020. “Worst-Case Estimates for U.S. Coronavirus Deaths,” The New
York Times.
7. Glanz, James. March 20, 2020. “Coronavirus Could Overwhelm US Without Urgent Action,
Estimates Say,” The New York Times.
8. Greenberg, Kyle, Michael Greenstone, Stephen P. Ryan, and Michael Yankovich. 2020.
“The Value of Statistical Life: Evidence from Military Retention Incentives and
Occupation-Specific Mortality.” Mimeograph.
9. Hatzius, Jan, et al. March 20, 2020. “US Daily: A Sudden Stop for the US Economy,” Goldman
Sachs.
10. Hilsenrath, Jon, and Armour, Stephanie. March 23, 2020. “As Economic Toll Mounts, Nation
Ponders Trade-Offs,” The Wall Street Journal.
11. Mizumoto, Kenji, and Chowell, Gerardo. 2020. “Estimating Risk for Death from 2019 Novel
Coronavirus Disease, China, January-February 2020,” Emerging infectious
diseases, 26(6).
12. Murphy, K. M., and Topel, R. H. 2006. “The value of health and longevity,” Journal of Political
Economy, 114(5), 871-904.
13. Office of Management and Budget. 2003. “Circular A-4.”
14. Pancevski, Bojan. March 22, 2020. “Covid-19 Deaths in Germany Far Below Rates in Other
Countries,” The Wall Street Journal.
15. Ramsey, Lydia. March 6, 2020. “One slide in a leaked presentation for US hospitals reveals that
18they're preparing for millions of hospitalizations as the outbreak unfolds,” Business
Insider.
16. Sanger-Katz, Margot, Kliff, Sarah, and Parlapiano, Alicia. March 17, 2020. “These Places Could
Run Out of Hospital Beds as Coronavirus Spreads,” The New York Times.
17. Thaler, R. and Rosen, S., 1976. The value of saving a life: evidence from the labor market.
In Household Production and Consumption (pp. 265-302). NBER.
18. Tsai, Thomas, Jacobson, Benjamin, and Jha, Ashish. March 17, 2020. “American Hospital
Capacity and Projected Need for COVID-19 Patient Care,” Health Affairs.
19. U.S. Centers for Disease Control and Prevention. March 18, 2020. “Severe Outcomes
Among Patients with Coronavirus Disease 2019 (COVID-19)—United States, February
12–March 16, 2020,” Morbidity and Mortality Weekly Report, 69.
20. U.S. Environmental Protection Agency. 2015. “Regulatory Impact Analysis for the Clean
Power Plan Final Rule.”
21. Thunstrom, Linda, Newbold, Stephen C., Finnoff, David, Ashworth, Madison, and Shogren, Jason
F. 2020. “The Benefits and Costs of Flattening the Curve for COVID-19.”
22. Verity, Robert, et al. 2020. "Estimates of the severity of COVID-19 disease," medRxiv.
23. Viscusi, W. K., and Aldy, J. E. 2003. “The value of a statistical life: a critical review of market
estimates throughout the world,” Journal of risk and uncertainty, 27(1), 5-76.
24. Yang, Xiaobo, et al. 2020. “Clinical course and outcomes of critically ill patients with SARS-
CoV-2 pneumonia in Wuhan, China: a single-centered, retrospective, observational
study,” The Lancet Respiratory Medicine.
19You can also read