Half-Year Results and Investor Presentation - 8th August 2019 - The Co-operative Bank

Page created by Aaron Vaughn
 
CONTINUE READING
Half-Year Results and Investor Presentation - 8th August 2019 - The Co-operative Bank
Half-Year Results and
Investor Presentation

8th August 2019
Half-Year Results and Investor Presentation - 8th August 2019 - The Co-operative Bank
2019: Fixing the Basics             3-12

Creating The Ethical Digital Bank   13-16

Financial Results                   17-29

Building Our Future                 30-32

Appendix                            33-35

                                            Contents
                                              Page
Half-Year Results and Investor Presentation - 8th August 2019 - The Co-operative Bank
2019: Fixing the Basics
Andrew Bester
Chief Executive Officer
Half-Year Results and Investor Presentation - 8th August 2019 - The Co-operative Bank
Positive strategic progress and financial performance ahead of expectations

              YTD results demonstrate positive financial performance, despite a challenging UK Retail
              Banking market and economic uncertainty

                                                                              Core income up 1%
                                                                             £189.4m (2018:186.9m)
● Resilient business performance despite market pressures
● We will remain focused on cost reduction whilst investing in our
   brand, digital capabilities and enhancing our product offering         Cost:Income ratio ahead of
                                                                              Plan 101% (*115%)
● ‘Fix the basics’ spend expected to track lower than guidance

● Successful Tier 2 issuance of £200m                                     High quality, low risk loan
                                                                         book-average mortgage LTV
● Upgraded credit rating from Moody's a positive step as we look                    57.2%
   to build our future
                                                                           Strong capital base CET1
                                                                                 21.9% (*19%)

                                                                         *2019 in-force full year guidance

Upgraded cost, capital & investment guidance as we remain confident in accelerating delivery of
                                     strategic objectives
                                                                                                             4
Half-Year Results and Investor Presentation - 8th August 2019 - The Co-operative Bank
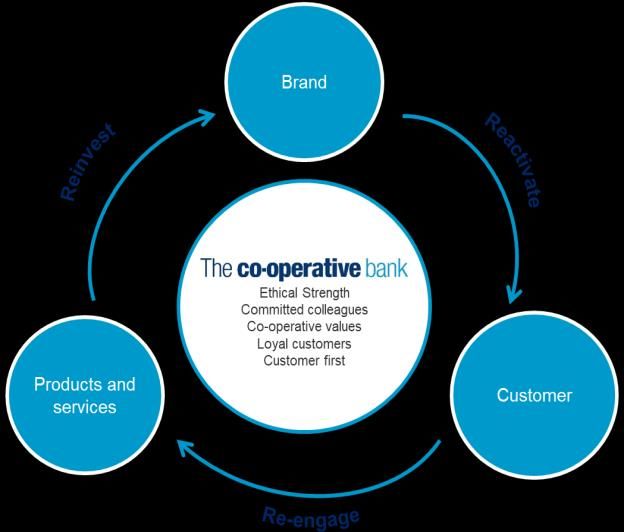
Tangible evidence of ‘fixing the basics’ with further progress towards
   building our future

                    In H1 we delivered a series of initiatives re-energising our people, re-activating our unique
                    brand and re-engaging our loyal customers

● Continued award winning customer service improving NPS scores, growing our
   customer base and improving retention rates

● Successful brand campaign reaching customers across multiple channels

● Embedding customer first principles underpinning our values and ethics as a key
   differentiator

● Optimisation of retail product mix enabling controlled growth in a subdued market
● Following C&I bid success Q2 saw the first growth in SME customers since 2013
● Extension of free SME 30 month introductory period makes it the best-in-market
   introductory deal

● Enhancing our digital offering including the launch of our new mobile app

● Progress against key strategic projects including desktop transformation,
   separation and mortgage and savings re-platforming

              ● Committed to investing in our future and becoming the ethical digital Bank                          5
Half-Year Results and Investor Presentation - 8th August 2019 - The Co-operative Bank
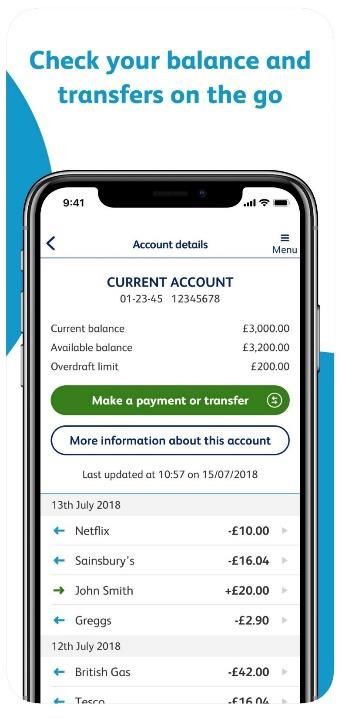
Progress in our multi-year transformation plan, enhancing customer
    experience and driving shareholder value

                The transformation plan is broken down into three phases

                                                                                        Establish Sustainable
            Fix the Basics                            Enable the Future
                                                                                             Advantage
               2018/19                                    2020/21
                                                                                                2022+
•   Deliver financial performance
•   Successful issuance of Tier 2
                                                •   Targeted customer segment
                                                                                   •   The ethical digital Bank
                                                    growth
•   Re-energised our people                                                        •   Digital mortgages delivered
    New performance framework                   •   Cost savings driven by
                                                                                       at low marginal costs
                                                    supplier rationalisation
•   Upskilled IT, change and supplier                                              •   Flexible digital savings
    management                                  •   Simplified organisation
                                                                                       platform
                                                    driving lower cost
•   Re-engaged loyal customers                                                     •   SME banking North West
    Successful multi-media brand campaign       •   Targeted capability
                                                                                       challenger
    and award winning customer service              enhancements

•   Enhanced digital engagement                 •   Invest BCR funding to
    Mobile app users 384k up from 350k              enhance SME banking
    since February migration
                                                •   Digitisation and IT platform
•   Tangible progress with key strategic            rationalisation
    projects and supplier partnerships
    Desktop transformation near completion,
    separation and re-platforming progressing                                                                        6
    to plan
Half-Year Results and Investor Presentation - 8th August 2019 - The Co-operative Bank
Winner of a range of awards including ‘most trusted mainstream Bank’

          Continuing to provide award          Embedding our customer first
           winning customer service                    principles

                                              Winner of Moneyfacts Branch network of
          Most Trusted Mainstream Bank
                                              the year

          Fairer Finance Gold Ribbon status   Highly commended branch service and contact
          on our Current Accounts             centre (2nd and 3rd respectively)

                                              Process simplification optimising digitisation to
          Best packaged bank accounts
                                              reducing the number of clicks by 20%

          5* Rated Standard Current Account   Reduced current account opening time by
          and Everyday Extra products         two days

          Worship Savings Account Audit       Product transformation including successful
          Recognition                         launch of new Select Access Saver and
                                              simplification of mortgage processes
          Best Buy Current Account

                                                                                                  7
Half-Year Results and Investor Presentation - 8th August 2019 - The Co-operative Bank
We are the only UK high street Bank with a customer-led ethical policy
    refusing banking services to organisations conflicting with our customers’
    values and ethics

                    Our unique ethical policy places us as market leader for non-customer ethical
                                                 perception (Hall & Partners)

                               Placing values & ethics at the heart of everything we do

                                Actively supporting co-operative        • Voted the UKs most trusted mainstream bank (Moneywise)
                                businesses
                                                                        • 49% of UK consumers within our priority top six
                                                                           customer segments due to ethical alignment and
                                Ending youth homelessness in               commercial opportunity (CACI 2019)
                                partnership with Centrepoint
                                donating c.£1.1m since May 2017
                                                                        • Sizeable opportunity to deepen existing customer
                                                                           relationships. 40% of customers community based
                                                                           with our values and ethics resonating strongly with
                                Tackling the issue of economic             them
                                abuse
                                                                        • £650k charity donations to charity partners through
                                                                           Everyday Rewards since launch, £150k in H1 2019
Commitment to environmental sustainability
Reinforced with upgraded targets to building on previous achievements

           39%                              Zero
      reduction in carbon              waste to landfill by the                                                              8
    emissions 2017 Vs 2018                 end of 2020
Half-Year Results and Investor Presentation - 8th August 2019 - The Co-operative Bank
Finding growth in a competitive market

                                      The Co-operative Bank                                  Wider market

                       • £1.1bn mortgage balance growth since 1H 18       • Highly competitive market, intense pricing
   Retail Lending

                                                                            forcing margin compression
                       • Margins maximised through LTV optimisation
                         and controlling new business volumes             • Lenders offering higher LTV/LTI to support
                                                                            returns
                       • Broadened BTL proposition, increasing
                         customer channel choice, service and digital     • SVR attrition forcing pressure on income
                         enhancements                                     • Housing market subdued
                                                                          • Current account switching market flat over
                       • Continued customer momentum- increase in           past 18 months, spikes driven by switch incentive
   Retail Deposits

                         new savings and current account customers and      campaigns
                         strong customer retention rates
                                                                          • Term market hit significantly by lower swap
                       • New Select Access Saver product generating         rates
                         £220m new to bank balances (>100% growth
                         YoY)                                             • High Cost of Credit and reforms to pricing
                                                                            structures creating additional challenges
                                                                          • Fierce competition for SME deposits placing
   SME and Charities

                       • c.85,000 SME customers                             value on “more than banking” with focus on
                       • £15m successful C&I bid supporting ambition to     mobile functionality
                         increase market share in key growth segment      • Expectations to digitise products and services
                       • Delivery of enhanced digital capability            growing exponentially
                         increasing customer engagement                   • Challengers and fintechs investing heavily in
                                                                            improved propositions
                                                                                                                          9
Half-Year Results and Investor Presentation - 8th August 2019 - The Co-operative Bank
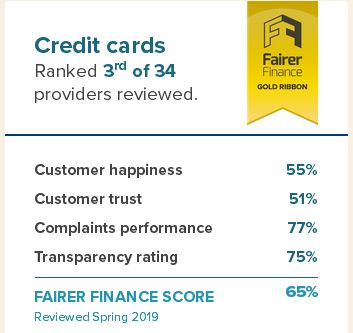
Successful £15m C&I bid with further co-investment allows us to target SME
customers driving our ambition to increase market share

               SME segmentation enables targeting of customers with affinity to our Values and Ethics

SME performance

● Q2 saw the first growth in customer numbers since 2013

Investing in our SME Business

● Investing to enhance core service deliverables and modernise our
    BCA offering including:

●   Same day account opening
●   Business credit card integrated into offering
●   Digital application and online enhancements
●   Top quartile online banking experience
●   Developing ‘Beyond banking’ services

● On track to deliver further enhanced product developments and digital
    capability to enable growth

 Extension of 30 month free banking period to SME customers makes it the best-in-class introductory
                                                deal                                                    10
Actively seeking opportunities to further extend our credit card offering

         Good quality, low risk credit card base generating healthy margins

 ● Credit cards ranked 3rd overall by Fairer Finance and 1st overall for
    transparency

 ● Increased branch credit card sales by 300% since May from existing
    customers

 ● Digital applications expected to improve sales conversion rates

 ● Tactical credit card retention plan launched

 ● Cross-selling opportunities and change in eligibility will enable further growth
                                                                                      11
Re-energise our brand and re-engage our loyal customer base

                 Successful brand re-launch reaching customers across
                 multi-channels

● Appealing to customers seeking a bank differentiated by co-operative
   heritage and values and ethics

● Reconnecting with existing customers-campaign execution phase 1 complete
   further phase 2 launch in H2

● Enhanced segmentation enabling targeted acquisition and retention
   campaigns

● Current Account NPS increased to +23 regaining 3rd position in the market
● Brand spend low in comparison to competitors

                     Current account NPS
                                                       AV
                                                  channels
    Snapshot                                                  TV: reached 21m ABC1 adults
    of results
                      +19           +23                       Sky adsmart: 4m views
                                                      Web     Catch up TV: 9.1m views
                      Apr-19
                                  4%
                                     Jun-19         traffic
                  4th in market   3rd in-market
                                                                                            12
Creating The Ethical Digital Bank-
Our Transformation Blueprint
Chris Davis
Chief Operating Officer
The on
Focus  Bank   is on a journey
           “Fixing            to re-establish
                       the Basics”            itself as
                                      simplifying       an IT
                                                      our  industry
                                                              estatecompetitor,
                                                                      enablingredeveloping its
                                                                                cost reduction
andfranchise,
     enhanced making    the complex
                  customer           simple
                               service      and the
                                         whilst       simple compelling
                                                  remaining     safe and secure

                                              Our Context

      468 Business      3 Mortgage       2 Savings        Refreshed Online &    12 Data      >100 IT
      Applications       Platforms       Platforms         Mobile Platform      Centres     Suppliers

                                           Market Context

        Traditional customer   Technology deployed to      Collaboration,      Regulatory divergence and
        segments redefined       accelerate growth    partnerships and supplier challenges to sustained
                                                            consolidation             profitability

                               Creating the Ethical Digital Bank
            Fix the Basics                    Enable the Future           Establish Sustainable Advantage
               (2018-19)                         (2020-21)                            (2022+)

   ● Launch of new mobile app        ● Delivery of platforms to enable    ● Expansion of digital products
   ● Tackle IT legacy inhibitors       SME growth                           and services
     through completion of Desktop   ● Rationalise and modernise          ● Further automation and
     and Separation from Group         mortgage and savings platform        simplification of back-office
   ● Align colleagues through        ● Simplification of the wider IT       services
                                                                                                            14
     change in operating model         landscape
FocusOur
       onfocus
          “Fixing   thehas
               in 2019  Basics”
                           been onsimplifying     our ITand
                                    “Fixing the Basics”   estate  enabling
                                                             in doing so   cost
                                                                           Fix thereduction
                                                                                   basics
and enhanced
     removing thecustomer   service
                   impediments        whilst
                                to sale       remaining
                                        or future           safe and secure (2018-19)
                                                  transformation

                                       Mobile Re-Platform
                                       ● 350k customers migrated to
                                         the new platform
                                       ● Legacy Monetise platform      Successful Deliveries
                                         exited                        ● 3m cardholders migrated to
                                       ● Regular customer                a strategic service with First
     Desktop Transformation              improvements: 6 releases in     Data
     ● Migration from Lotus Notes to     H1, 12 scheduled for H2       ● Regulatory changes for
       Outlook                                                           cheque imaging delivered
     ● 50% of colleagues deployed                                        ahead of industry
     ● 67 out of 68 branches                                           ● Swift payments compliance
       deployed                                                          upgrades completed

   Separation                                                                    Cyber security
   ● 75% complete                        Change Delivery                         ● 3 year cyber
   ● End of year final                                                             strategy launched
     separation event                       Summary                              ● Strategy aligned
   ● Exit Co-op Group                                                              with NIST
     data centres                                                                  framework
                                                                                 ● Security maturity
                                                                                   aligned with peers

                                                                                                          15
Preparing
     We areplans   andour
            preparing    designs   fordesigns
                            plans and   platform   modernisation,
                                               for platform          consolidating
                                                            modernisation             our
                                                                          Enable the Future
suppliers and
     and are    selecting
             close           future
                   to finalising     delivery
                                 our future     partners
                                            delivery partners                (2020 – 21)

                      • Continued Customer First          • Reduced data centre
                        investment in Digital solutions     footprint and positive
      Customer        • SME capability enhancements         environmental impact               Ethics
                        and mobile application            • Recruitment campaign driven
                      • Addressing friction in              by diversity and inclusion
                        customer journeys                 • Customer led prototyping

                      • 3 mortgage platforms to 1         • Recruitment campaign launched
                                                            for 100 IT roles
                      • 2 savings platforms to 1
                                                          • New leadership capability in
     Simplification   • Data centre rationalisation                                         Execution
                                                            place
                      • Simplified payments               • Embedded competency
                        landscape                           model
                      • Automation efficiencies           • Emerging Agile DevOps model

                      •   Reduced reliance on legacy      • Advanced negotiations with
                                                            future delivery partners
                      •   Technical debt remediation
     Risk                                                 • Consolidation of IT sourcing     Partners
                      •   3-year cyber strategy
                                                            providers
                      •   Positive impact on capital
                                                          • Streamlined IT delivery
                          risk provisioning
                                                            model

                          ● Making the complex simple, and the simple compelling….                      16
Financial Results
Nick Slape
Chief Financial Officer
Financial performance ahead of expectations with CET1 ratio at 21.9%

      £m                                             1H 19         1H 18      Change
                                                                                                     Underlying loss of £2.8m with core income 1% higher
      Retail                                          140.5        146.8          (4%)
      SME                                              27.9          28.0         (0%)               Income broadly in line at £191.2m
      Core Customer income                            168.4        174.8          (4%)
      Treasury                                         21.0          12.1         74%
                                                                                                                 • Retail down £6.3m through sustained mortgage
                                                                                                                    margin pressure leads to NIM compression
      Total Core income                               189.4        186.9            1%
      Legacy/other                                      1.8           6.0       (70%)                            • Treasury optimisation/revaluations drives £8.9m
      Total income                                    191.2        192.9          (1%)                              improvement
      Operating costs                               (185.0)       (175.2)         (6%)
      Continuous improvement spend                     (8.2)        (9.4)         13%
                                                                                                                 • Continued Legacy run-off reduces income by £4.2m
      Operating expenditure                         (193.2)       (184.6)         (5%)               Expenditure increases 5% to £193.2m
      Impairment (loss)/gain                           (0.8)          2.9
Net interest income down 7% with anticipated NIM contraction

                                                                                                               NII of £161.3m with SME stable
                 Net interest income (£m)
                                                                                                                            • Retail NII down 4% as competitive
                              Core: 169.3                                                                                       mortgage margins and SVR mix is
                                                                                                                                partially offset by improving deposit costs
1H 18                      138.2                                 20.1         11.0     4.6       173.9                      • Treasury NII down due to Tier 2 and
                                                                                                                                lower MBS balances. Hedging
                                                                                                 (7%)                           adjustments offset in non-interest income
                              Core: 159.4
                                                                                                                            • Legacy NII represents only 1% of
1H 19                    133.1                                19.8      6.5    1.9
                                                                                                                                interest income, down from 3% in 1H 18
                                                                                                 161.3
                                                                                                                            • Underlying NIM reduces to 185bps. Now
                                                                                                                                expect 2019 NIM of c.170bps reflecting
                  Retail     SME      Treasury      Legacy                                                                      lower external rate expectations
                                                         Customer net interest margin
                                                                                         (25bps)

                    (26bps)
                                                                                           (4bps)                (2bps)
                                                                  13bps                                                                                    (2bps)
                                          (4bps)

        208bps
                                                                                                                                      185bps                               183bps

                                                                                                                                                                                    19
         1H 18   Asset mix and rate      SVR attrition       Deposit mix and rate    Treasury activity (excl   Legacy / other     1H 19 (pre reclass)   Treasury reclass    1H 19
                                                                                           reclass)
Controlled growth in core customer balance sheet, cost of deposits remains low

                              Mortgage flows (£m)                                                               Core customer deposit flows (£m)
                                                2%                                                                                      0.6%
                                                                           (804)
                                                         1,721                                                                                         18,700
                                                                        Includes SVR
                                                                                                       18,595
                          (1,572)       1,020                             attrition of                                                137       (82)
                                                                           c.£120m                                    50
                                                                                                       2,000                                              2,050

                                                                                                       4,153                                              4,071

            15,494                                                                        15,859

                                                                                                       12,442        SME                               12,579
                                                                                                                     Term Savings
                                                                                                                     Franchise

            FY 18       Maturities    Retention     New business Other outflows           1H 19        FY 18         SME            Franchise   Term   1H 19

       Gross customer deposit and lending rates1                                                       • 2% growth in mortgages through Platform new
             2.56%
                              2.51%             2.51%
                                                                                                          business, improved retention and propositions
                                                                      2.49%              2.46%
                                                                                                       • 1.3% growth in lower cost Retail franchise and SME
                                                                                                          deposits with 2% reduction in term funding
             2Q 18            3Q 18             4Q 18                 1Q 19              2Q 19

                                           Core customer assets                                        • Sustained mortgage margin pressure drives 10bps
                                                                                                          reduction in core asset rates, however cost of
             0.55%                              0.56%                 0.59%              0.61%
                              0.53%                                                                       deposits remains low at 61bps, 14bps below base
                                                                                                          rate
             2Q 18            3Q 18             4Q 18                 1Q 19              2Q 19

                                          Core customer liabilities                                    • Revising down customer asset and liability growth
                                                                                                          in 2019                                                 20
1.   Calculated as blended core gross rates over the core average balance for the three month period
Growth in core other operating income driven by Treasury

 £m                                                    1H 19           1H 18       Change

 Retail                                                    7.4            8.6           (14%)   Core customer fee income down £1m
 SME                                                       8.1            7.9             3%
                                                                                                     • PCA fee income higher due to improved
 Core customer fee income                                15.5            16.5            (6%)          supplier arrangements; SME 3% higher
                                                                                                       driven by re-pricing
 Treasury                                                14.5             1.1          >100%

 Total core other operating income                       30.0            17.6            70%
                                                                                                     • Other Retail fee income impacted by
                                                                                                       balance mix and product changes
 Legacy/other                                            (0.1)            1.4      (
Underlying operating expenditure increased 2% as efficiencies are offset by
     brand investment and other costs

                                        Operating expenditure (£m)
                                                                                                                 Operating expenditure up 5% to £193m
                                                              5%
                                                                               2%                                £4m non-recurring items from 2018
                                                                                                4
                    4
                    -                              (8)
                                                                                    4
                                                                                                -
                                                                                                                       • One-off benefits in 2018 include an
                                                                     4                                                    FSCS provision release, gains from
                                                                                                                          property sales and other balance sheet
                                                                                                         193
      185
                                    189                                                                                   releases

                                                                                                                 Underlying operating expenditure up £4m (2%)
      1H 18     2018 Non-
              recurring Items
                                   1H 18
                                 Underlying
                                               Efficiencies     Variable Pay      Brand
                                                                               Investment
                                                                                            2019 Non-
                                                                                             recurring
                                                                                                         1H 19         • £8m of efficiencies including headcount
                                                                                              Spend                       reduction and 2018 branch closures
                                Operating expenditure breakdown1 (£m)
                                                                                                                       • £4m reintroduction of variable pay
     CIR%:       96%                                      99%                                 101%
                                                                                                                       • £4m increase in marketing spend
                 185                                      190                                  193                        including costs of brand relaunch
                                                              9.3                               8.2
                  9.4
                                                                                                                       • £4m costs to drive future benefits
                                                                                                                          including C&I fund bid and 3rd party
                 110.4                                    115.9                                122.5
                                                                                                                          spend

                  64.8                                        64.4                              62.5
                                                                                                                 Cost:income ratio of 101% is ahead of
                                                                                                                 guidance. Guidance FY 19 revised
High quality loan book with low levels of non-performing loans

                          Non-performing loans1                                                                                                              NPL Coverage2
                                 (0.2%)                                                                                                                                                        NPL provision (£m)

                                                                                                          Provision (£m)
           0.9%                                         0.7%                                                               1H 19   2.4   5.0           7.9    4.6
                                                                                                                                                                                                     19.9

           311                                                                                                             FY 18   2.8    5.1                 20.2                       6.7         34.8
                                 20,034                  291
                                                                                    19,967
            46
                                                                                                                                                                                               NPL coverage (%)
                                                          42

                                                                                                          Coverage (%)
                                                                                                                           1H 19   3.7          86.2                  68.7             7.5
           142                                           102                                                                                                                                         14.0

          FY 18                  FY 18                 1H 19                        1H 19
                                                                                                                           FY 18   3.7          87.1                52.1         9.8                 18.5
                                                       NPL ex POCI
                 Total Exposure (£m)                   Non performing POCI
                                                                                                                                     Secured       Unsecured (core)        SME    Legacy
                                                       Performing POCI

                                       Exposure by stage3
                                                          0.5%       Total provision         Total coverage                        • £144m of NPL is 0.7% of total exposure
                                                                          (£m)                     (%)
                                                                                                                                   • NPL coverage ratio reduces to 14% due to
1H 19                        95.0%                      2.8%     1.7%        39.1                   0.2                                  change in SME mix following releases

                                                          0.7%
                                                                                                                                   • Unsecured coverage of 86% in line with industry
                                                                                                                                   • Total provision of £39.1m, £19.9m against NPL
                                                                             52.7                   0.3
FY 18                        94.6%                     2.9%      1.8%                                                                    and £19.2m against performing
                                                                                                                                   • Impairment charge of £0.8m includes £3.4m of
                   Stage 1     Stage 2      Stage 3     POCI
                                                                                                                                         SME releases. Underlying cost of risk (excluding
                                                                                                                                         releases) of 5bps
1.      NPL% calculated as non-performing exposure (excluding performing POCI) over total exposure                                                                                                                  23
2.      NPL Coverage ratio calculated as NPL provision over NPL balance (all excluding performing POCI)
3.      Excludes balances relating to FVTPL
Well diversified and low LTV mortgage book

           Average retail mortgage LTV (%)                                                                     LTV split by band
    Average LTV (%)                                                                                               2%                        1%                      2%
                                                                                                                 11%                        11%
                                                                                      • Marginal
    Completion LTV (%)                                                                                                                                              12%

                                                                                                                 17%                        17%                     18%
                    72.9             73.3         71.8           71.1        71.5       increase in
   68.9
                                                                                                                 18%                        18%
                                                                                        LTVs due to                                                                 18%

                                                                                        introduction             16%                        16%                     16%
                                                                                        of 95% LTV
                    55.5             55.5         55.9           57.6        57.2       lending and              36%                        37%                     34%
   54.0
                                                                                        pressure in
                                                                                        HPI                     1H 18                      2H 18                1H 19
                                                                                                                       Less than 50% 50% to 60%        60% to 70%
  1Q 18           2Q 18             3Q 18       4Q 18            1Q 19      2Q 19                                      70% to 80%        80% to 90%    90% to 100%

  Core mortgage book by geographic split                                                              Mortgage repayment type
          5%                         5%                   5%
                                                                                             3%                   3%                      3%
          11%                       11%                   11%
                                                                         • Exposure          7%
                                                                                                                  6%                      6%              • Interest
          20%                       21%                   21%
                                                                          to London                               8%                      8%                 only
                                                                                            10%
          20%                       21%                   22%             and South                                                                          exposure
                                                                          East                                                                               reduces
                                                                          continues                               83%                     83%                from 20%
          44%                       42%                   41%                               80%
                                                                          to reduce                                                                          to 17% of
                                                                                                                                                             book
      1H 18                         2H 18                1H 19
           London & South East              Northern England                                1H 18               2H 18                    1H 19
           Midlands & East Anglia           Wales & South West
           Other                                                                         Repayment   Residential I/O    Buy-to-let I/O   Optimum I/O                      24
Loss before tax driven by investment in key strategic projects

 £m                                               1H 19            1H 18      Change       Loss before tax of £38.5m is 3% improvement on 1H 18
 Underlying (loss)/profit                          (2.8)            11.2
Fix the basics 2018/19 nearing conclusion

                                                                 Strategic project costs (£m)
                                                                                                               CTA
                                                         Fix the basics                                                         Enable the future

1H 19                                      25.1                                3.1         6.1     0.3   4.0   3.9            4.1           6.1                             52.7

1H 18        4.8             4.8                  10.7             4.3          4.9                 11.6          1.1     3.2              45.4                         16%

  Separation Related               Payments                 IT Infrastructure            Other Strategic
  Digital (Fix the basics)         Cost to achieve          Digital (Franchise growth)   Mortgages & Savings
                                                                                                                     Cash investment spend (£m)
                                                                                                                        59                        74                            79

                                                                                                                                                                               1.6
• £25m spend on Separation represents c.50% of total strategic project                                                                            3.6
                                                                                                                                                                               16.9
   costs                                                                                                                4.6
                                                                                                                                                  12.3

• As we turn our attention to ‘Enable the future’ we have increased                                                                                                            52.7
                                                                                                                     45.4                         48.8
   investment in our digital capability alongside initiating the re-
   platforming of our mortgage and savings systems
                                                                                                                        9.4                       9.3                           8.1
• Cash spend of £79m in 1H 19 with prudent levels of capitalisation.                                                 1H 18                    2H 18                           1H 19
   2019 expectation now £140-150m                                                                              Expensed - ATL       Expensed - BTL       Intangible capex     Tangible capex
                                                                                                                                                                                               26
CET1 ratio ahead of target due to focus on RWAs. Year end 2019 guidance
     revised to c.20.5%

                                                                   CET1 % development                                                                                     Total capital ratio
                     (1.1%)
                                           (1.3%)
                                                                                                             (0.4%)
                                                                                                                                                                          4.2%

                                                                         (0.8%)                                                             0.8%
                                                                                             (0.3%)                   (0.1%)
                                                                                                                                                                                         26.1%
            24.7%
                                 23.6%
                                                     22.3%                                                                                                 21.9%

     FY 17 CET1 ratio       1H 18 CET1 ratio    FY 18 CET1 ratio      Statutory loss         Pensions           Other Resources             RWA's      1H 19 CET1 ratio   Tier 2    Total capital ratio

                       CET1                                          OCR                                            MREL1
                                                                                                                                                  • CET1 erosion of 0.4% in 1H 19, 0.7%
                                                                                                                             36.9%                  lower than 1H 18 due to RWA reductions
                  £439m surplus                                £286m surplus
                                                                                                         Buffers2
                                                                                                                               Buffers2
                                                                                                                                3.5%              • 12.9% CET1 minimum; surplus of £439m
                                                                               26.1%                      3.5%                                      (9%)
                                 21.9%
                                                             20.2%              CET1                     20.2%                                    • 20.2% OCR requirement; surplus of £286m
                                                                               Surplus
                                                                                5.9%
                                                                                                                                                    (5.9%)
                                  CET1                                                                   Buffers2              2x TCR
                                                T2 4.2%                          T2
               12.9%             Surplus                                                                  3.5%                  33.4%
                                  9.0%
                                                AT1 3.1%
                                                                                                             ICR
                                                                                                                                                  • £200m of MREL targeted for H2
 CCyB 1.0%
 CCB 2.5%
                                                                                CET1             TCR
                                                                                                             8.7%
                                                                                                                                                  • Final MREL impacted by income, costs,
 ICR 4.9%                         CET1          CET1 12.9%                                      16.7%
                                                                                                              P1
                                                                                                                                          2x PI     RWA and ICR developments
                                                                                                                                          9.0%
                                                                                                                                                  • 1% reduction in ICR would drive £50m
                                                                                                             8.0%
 P1 4.5%

            Requirement          Jun-19                    Requirement         Jun-19                   Jun-19             Jan-22 Final             reduction in total capital requirements3
1.         Indicative MREL requirements, subject to change. assumes static ICR % for illustrative purposes
2.         Buffers include CCB and CCyB                                                                               3.        Assumes RWAs of £4,870m as at 1H 19                                27
Legacy asset segmentation to drive optimisation

              Legacy asset profile (£m)                                                 Income/RWAs
                                 (18%)
                                                                  Income/
                                                                             9.5%            1.1%                   10.0%          0.6%
  1,753                                                          RWAs (%):
   181       158                                         1,444
                          141
                                         125   113        100
   575       566
                          549            529                                 3,935                                  3,852
                                                516       501

   997       965          908            872    857       843
                                                                                         1,118                                     1,018

  1Q 18     2Q 18      3Q 18         4Q 18     1Q 19     2Q19
                                                                                     FY 18                                  1H19
              Legacy Corporate       Optimum     Loans
                                                                                             Core RWAs        Legacy RWAs

• Legacy assets represent 21% of total RWAs but have a low                     RWA mix as at 30 June 2019
  income to RWAs return of 0.6%
• Management are exploring capital accretive solutions:                                             21%

• Corporate - primarily long dated, low yielding and high credit
  quality Social Housing and PFI assets                                                                   £4,870m   54%

• Optimum - higher risk mortgage book. Exploring potential
                                                                                                25%

  £0.3bn securitisation
• Loans - short dated performing unsecured portfolio                                                                                       28
Stable liquidity profile as asset growth is funded through deposits and other
     asset attrition

                             Loan to Deposit (LTD) ratio                                                                              Liquidity Coverage Ratio (LCR)

                                                                                                                             219.6%
                                               92.4%           94.7%        94.9%          94.7%
                                88.6%                                                                                                       168.9%
                 83.9%                                                                                                                                     157.0%        153.8%         155.0%         156.6%

                  1Q 18         2Q 18          3Q 18           4Q 18        1Q 19          2Q 19                              1Q 18          2Q 18          3Q 18         4Q 18          1Q 19             2Q 19

                                  Liquidity by Type (£bn)

                   9.6               10.0                9.3                7.1                6.6
                                                                                                                      • LTD ratio is stable as growth in customer assets
                                                                                                                         continues to be funded through customer deposits

                                                                                                                      • Primary liquidity1 and LCR ratio are broadly in line
                                      5.4                                                                                with previous periods
                   6.5                                   5.9
                                      0.3                                   4.4
                   0.4
                                      0.4                0.4
                                                                                               3.8
                                                                                                                      • Secondary liquidity2 continues to reduce in line with
                                                         0.4                0.5                0.5                       collateral amortisation
                   1.1                3.9                                   0.5                0.8
                                                         2.6
                   1.6                                                      1.7                1.5
                 1H 17              2H 17              1H 18              2H 18               1H 19
                  Central Banks           Gilts      Gov't & other bank bonds               Secondary

1. Primary liquidity consists of liquid assets that are eligible under European Banking Authority (EBA) regulations (high quality liquid assets).
                                                                                                                                                                                                                   29
2. Secondary liquidity comprises liquid unencumbered investment securities not included as part of primary liquidity, as well as mortgage and corporate collateral eligible for central bank facilities.
Building Our Future
Andrew Bester
Chief Executive Officer
2019 guidance revised to reflect strong capital performance and sustained NIM
     pressures

                                                                       2019                          2020                          2023                 Comments

                                                Revised                c.170                         c.160
             Customer NIM (bps)                                                                                                                   Assumes delay in first
                                                In-force            175 - 180                     160 - 165                     180 - 185         rate rise to 2020 and an
                                                                                                                                                  orderly Brexit

                                                Revised                < 110                         c.105
           Cost:income ratio (%)                                                                                                                  Focus will be to drive
                                                In-force               c.115                      105 - 110                         c.75          underlying profits by
                                                                                                                                                  taking cost action to
                                                                                                                                                  mitigate NIM
           Franchise investment
                                                Revised             140 - 150                      90 - 110                                       compression
                   (£m)                         In-force            150 - 170                     100 - 120                       50 - 70

                                                Revised                c.20.5                         c.18                        19 - 20         Capital guidance
                 CET1 ratio (%)                                                                                                                   upgraded for each year
                                                In-force                c.19                        16 - 17                       18 - 19

                Core1 customer
                                                 Revised                c.17                          c.18                          c.23
                 assets (£bn)                    In-force              c.17.5                        c.19.5                         c.23          2019 balance sheet
                                                                                                                                                  focus is on
                                                                                                                                                  price/volume
                Core1 customer
                                                Revised              18.5 - 19                       c.19.5                         c.24
                liabilities (£bn)               In-force               c.19.5                         c.21                          c.25
                                                                                                                                                                             31
1. Balance sheet guidance rebased to core customer balance growth following segmentation of legacy, which includes £1.4bn of assets as at 1H 19
Summary

 Starting to deliver the transformation Plan

       • Delivering financial performance
       • Brand re-activated-at a time when consumers are increasingly seeking
           ethical choices
       •   Beginning to deliver enhanced digital capability
       •   BCR funds will support SME business growth
       •   Tier 2 funding in place
       •   Separation and desktop well progressed and on track for delivery
       •   Mortgage and savings transformation underway

 Managing our income, cost and capital levers to optimise resources

 Safe lending book provides resilience despite market and economic
 uncertainty

• Looking forward, we will build on our achievements, focusing
    on cost reduction, franchise growth and investing for the
  future to deliver a sustainable, profitable Co-operative Bank
Appendix
Core balance growth lower than expectations in order to optimise margins
across customer assets and deposits

£m                             1H 19    FY 18    Change

Retail lending                 16,187   15,847      2%

SME                              208      291     (29%)   • Retail lending growth through Platform brand with
Core customer assets           16,395   16,138      2%      £1.7bn of completions and increased levels of
Core Treasury                   4,504    4,502      0%
                                                            retention
Total core assets              20,899   20,640      1%
                                                          • Core SME balance reduction as limited new
Legacy assets                   1,444    1,527     (5%)     business activity at present
Other assets                    1,061     936      13%

Total assets                   23,404   23,103      1%    • Legacy assets reduce 5% in line with expectations
Retail deposits                16,650   16,595      0%
                                                          • Retail deposits increase marginally due to growth
SME                             2,050    2,000      3%
                                                            in current account balances
Core customer deposits         18,700   18,595      1%

Core Treasury                   2,444    2,309      6%    • SME deposit growth driven by growing customer
Total core liabilities         21,144   20,904      1%      base
Legacy liabilities               149      119      25%
                                                          • Equity drops £10m as loss is offset by revaluation
Other liabilities                371      330      12%
                                                            of pension scheme surplus
Total liabilities              21,664   21,353      1%

Equity                          1,740    1,750     (1%)

Total liabilities and equity   23,404   23,103      1%
                                                                                                                 34
Disclaimer

Caution about Forward Looking Statements
This document contains certain forward looking statements with respect to the business, strategy and plans of The Co-operative Bank Holdings Limited and the Co-operative Bank plc (including its 2019-2023
Financial Plan, referred to as the (“Plan”) and its current targets, goals and expectations relating to its future financial condition and performance, developments and/or prospects. In particular, it includes targets
under the summary section of this document and the “Outlook for 2019” section of the key highlights and outlook in the annual report and accounts. Forward looking statements sometimes use words such as ‘may’,
‘will’, ‘seek’, ‘continue’, ‘aim’, ‘anticipate’, ‘target’, ‘projected’, ‘expect’, ‘estimate’, ‘intend’, ‘plan’, ‘goal’, ‘believe’, ‘achieve’, ‘predict’, ‘should’ or in each case, their negative or other variations or comparable
terminology, or by discussion of strategy, plans, objectives, goals, future events or intentions. Forward looking statements, including statements about The Co-operative Bank Holdings Limited and The Co-operative
Bank plc or its directors’ and/or management’s beliefs and expectations, are not historical facts or guarantees of future performance. By their nature, forward looking statements involve risk and uncertainty because
they are based on current plans, estimates, targets, projections, views and assumptions and are subject to inherent risks, uncertainties and other factors both external and internal relating to the Plan, strategy or
operations, which may result in not being able to achieve the current targets, predictions, expectations and other anticipated outcomes expressed or implied by these forward-looking statements. In addition, certain
of these disclosures are dependent on choices relying on key model characteristics and assumptions and are subject to various limitations, including assumptions and estimates made by management. Accordingly,
undue reliance should not be placed on forward-looking statements.

Important factors that could affect the outcome of forward-looking statements
There are a large number of important factors which could adversely affect the operating results and financial condition, the ability to implement its Plan and cause the miss of targets or affect the accuracy of
forward-looking statements. These include the risks and uncertainties associated with the successful execution of the Plan summarised in the ‘Principal Risks and Uncertainties’ section of the 2018 Annual Report.
These include risks and factors such as: ability to respond to a change in its business environment or strategy and successfully deliver all or part of the Plan and desired strategy when planned or targeted; changes
in the relationship with the Co-operative Group; ability to complete the remaining transformation, remediation and change programmes when planned and in line with target costs; whether any deficiencies in
appropriate governance and related programme management processes would impede the satisfactory delivery of the transformation programme when planned and in line with targeted costs which would impact
associated cost reductions or income generation plans; the ability to successfully deliver important management actions required to implement the strategy and the Plan; whether base rates will increase as soon as
and as much as is forecasted in the Plan or whether competitive pressures reduce the market share achieved or do not enable net interest margins to increase as envisaged in the Plan or that regulatory pressure
constrain the anticipated growth in volumes; whether growth in new mortgage origination is significantly less than assumed in the Plan; whether the SVR book will perform as forecasted; whether liquidity and
funding can be accessed at an appropriate cost to fund the requisite level of asset origination targeted in the Plan, including the risk that future central bank funding facilities and initiatives may be unavailable
dependent on the terms and conditions; changes in the business, such as fee changes result in cash outflows and a lower than expected overall non-interest income; significant changes to existing or new conduct
or legal risk provisions during the life of the Plan; whether RWAs are significantly greater than those assumed in the Plan due to worsening economic conditions and the risk that any material increases in RWAs will
significantly increase our capital requirements; whether the planned cost reductions are achieved when planned, or at all; operating costs being higher than assumed in the Plan, the cost to income ratio continuing
to negatively impact its profitability and its capital position; whether the Bank will be able to achieve all capital requirements and MREL when planned; whether it is possible to complete MREL qualifying debt
issuances when planned, on acceptable terms, or at all; whether it is possible to recognise the amount of deferred tax assets stated in the Plan and generates the profits before and after tax targeted in the Plan
when expected, or at all. The risks and uncertainties presented above are not an exhaustive list of the risks that could be faced and represent a view based on what is known today.

Any forward-looking statements made in this document speak only as of the date of this document and the Bank expressly disclaims any obligation or undertaking to provide or release publicly any updates or
revisions to any forward-looking statements contained in this document as a result of new information or to reflect any change in the expectations with regard thereto or any change in events, conditions or
circumstances on which any such statement is based, except as required under applicable law or regulation.

Important Notice

The information, statements and opinions in this document do not constitute or form part of any offer or invitation to sell or issue, or any solicitation of any offer or recommendation or advice to purchase or subscribe
for any shares or any other securities nor shall it (or any part of it) or the fact of its distribution, form the basis of, or be relied on in connection with, any contract therefore. Furthermore, the information in this
document is being provided to you solely for your information and may not be reproduced, retransmitted or further distributed to any other person or published (including any distribution or publication in the United
States), in whole or in part, for any purpose. No representation or warranty, express or implied, is or will be made and no responsibility or liability is or will be accepted by The Co-operative Bank Holdings Limited or
The Co-operative Bank plc or by any of their respective directors, officers, employees or agents as to or in relation to the accuracy or completeness of the information in this document and any such liability is
expressly disclaimed, provided that this disclaimer will not exclude any liability for, or remedy in respect of, fraudulent misrepresentation.
                                                                                                                                                                                                                            35
You can also read