1-4 Capital Interchange, Brentford Redevelopment Assessment
←
→
Page content transcription
If your browser does not render page correctly, please read the page content below

Research Report
Jones Lang LaSalle Incorporated

1-4 Capital Interchange, Brentford TW8 0EX
January 2019

             1-4 Capital Interchange,
            Brentford Redevelopment
                   Assessment
Supporting Copy
1       Development Summary.................................................................................................................................................................... 3
1.1 Introduction ............................................................................................................................................................................................ 3
1.2 The Site ................................................................................................................................................................................................. 3
1.3 Location ................................................................................................................................................................................................. 4
1.4 Planning Context .................................................................................................................................................................................... 5
2       Western Corridor Office Market Review ......................................................................................................................................... 7
2.1 Take Up ................................................................................................................................................................................................. 8
2.2 Average Deal Size .................................................................................................................................................................................. 8
2.3 Occupier Demand................................................................................................................................................................................... 9
2.4 Supply and Vacancy Rates ..................................................................................................................................................................... 9
2.5 Development Pipeline ............................................................................................................................................................................. 9
2.6 Rents ................................................................................................................................................................................................... 11
2.7 Grade A Rents and Y-O-Y Rental Growth.............................................................................................................................................. 11
2.8 Characteristics of the marketplace ........................................................................................................................................................ 11
3       Brentford & Hounslow Office Market Review.............................................................................................................................. 13
3.1 Overview .............................................................................................................................................................................................. 13
3.2 Infrastructure ........................................................................................................................................................................................ 13
3.3 Take Up ............................................................................................................................................................................................... 14
3.4 Occupier Demand................................................................................................................................................................................. 16
3.5 Supply and Vacancy Rates ................................................................................................................................................................... 16
3.6 Development Pipeline ........................................................................................................................................................................... 17
3.7 Rents ................................................................................................................................................................................................... 18
4       Brentford demographic and employment analysis .................................................................................................................................. 19
4.1 Population growth ................................................................................................................................................................................. 19
4.2 Household growth................................................................................................................................................................................. 19
4.3 Largest Employment Sectors ................................................................................................................................................................ 20
4.4 Employment prospects ......................................................................................................................................................................... 20
4.5 Age profile ............................................................................................................................................................................................ 22
4.6 Salary analysis ..................................................................................................................................................................................... 22
5       Co-Working and Flex Space ................................................................................................................................................................. 23
6       Summary of Analysis and Conclusion.................................................................................................................................................... 25

COPYRIGHT © JONES LANG LASALLE IP, INC. 2019. All Rights Reserved                                                                                                                                              2
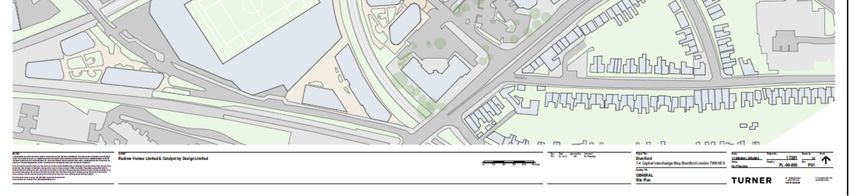
1 Development Summary
1.1 Introduction
The following report has been prepared by JLL on behalf of Redrow Homes Limited and Catalyst by Design to affirm
their position that the site known currently as 1-4 Capital Interchange needs to be of a mixed use nature to include
office, retail and residential accommodation which are regarded as complementary to each other.

1.2 The Site
The subject site is located at 1-4 Capital Interchange, Brentford, a town in the London Borough of Hounslow. The
site is strategically placed between the M4 and A4 roads and benefits from easy access to Kew Bridge and Brentford
railway stations and Gunnersbury Underground station.

The site is currently occupied by a scaffolder’s yard (Use Class B8). The only existing permanent structure is the
large advertisement stanchion in the western portion of the site. The majority of the remainder of the site is
covered by hard standing.

COPYRIGHT © JONES LANG LASALLE IP, INC. 2019. All Rights Reserved                                                    3

1.3 Location
Brentford is located 8 miles west of Central London with Wembley 5 miles to the north, Richmond 3.5 miles to the
south, 4 miles north east of Hounslow and 6 miles east of London Heathrow Airport.

The site is located between the M4/A4 roads to the north and a railway line in a mixed use area. The surrounding
properties are large industrial/office buildings (including the 12-storey Vantage West building) and Gunnersbury
Park and Cemetery which is a Grade I listed park. There are a number of conservation areas to the East, South East
and West.

COPYRIGHT © JONES LANG LASALLE IP, INC. 2019. All Rights Reserved                                                4

Brentford was historically seen as an area of industrial strength, earning its nickname as the “The Golden Mile”
which ran along the Great West Road. Although Brentford’s industrial strength lessened the area became a focus
for commercial office property with several multi-national corporations settling. However, over the last decade,
Brentford’s identity as a commercial centre has declined as occupiers have favoured better connected “town centre
locations”. This decline has been further exacerbated by increasing residential values which has made permitted
development more attractive to investor landlords and developers when considering refurbishing or developing
their buildings.

1.4 Planning Context
The subject site is under the jurisdiction of The London Borough of Hounslow.

The proposed description of development is as follows:

“Demolition
“Demolition of existing structures and redevelopment of the site to provide a mixed- mixed-use scheme comprising
residential units (Class C3), and flexible retail and commercial floorspace (Class A1/A2/A3/B1(a-
                                                                                       A1/A2/A3/B1(a-c)/D1/D2), in
buildings up to 16 storeys in height, with associated car and cycle parking, refuse and recycling storage, children’s
playspace, landscaping and public realm improvements, and access arrangements.” (“the Proposed
Development”)

 PROPOSED FLOORSPACE AREAS

 Use Class                                      GIA (sqm)               GEA (sqm)

 Residential (C3)                               39,368                  42,365

COPYRIGHT © JONES LANG LASALLE IP, INC. 2019. All Rights Reserved                                                   5
Flexible Commercial (B1a-c)                    3,728                     3,948
 Flexible Retail                                930                       978
 (A1/A2/A3/B1a/D1/D2)

Flexible Commercial Floorspace

A total of 3,728sqm flexible commercial floorspace is proposed in the following Use Classes:

• B1(a) Office;

• B1(b) Research and Development; or

• B1(c) Industrial Processes.

This is provided over 4 storeys in Block C to the west of the Application Site.

The main entrance to the flexible commercial floorspace is located on the junction of Capital Interchange Way and
the M4/A4, with its main frontage along the M4/A4 corridor to the west. The proposed flexible commercial
floorspace has been strategically placed to act as a “buffer” for more sensitive uses (such as residential) from
potential air and noise pollution arising from traffic along the M4/A4. The site is close to the green space offered by
Gunnersbury Park.

The flexible commercial floorspace has been designed to allow its management either as a single unit suitable for
a large corporate office, or as smaller managed workspaces suitable for small-to-medium enterprises (“SMEs”) and
start-ups.

COPYRIGHT © JONES LANG LASALLE IP, INC. 2019. All Rights Reserved                                                     6
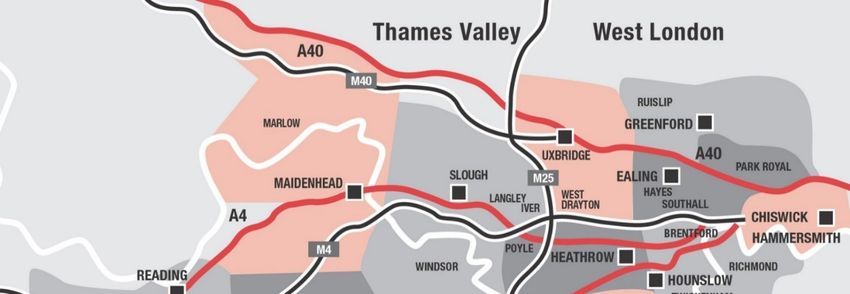
2 Western Corridor Office Market Review
The Golden Mile is the name given to a stretch of the Great West Road north of Brentford running west from the
western boundary of Chiswick in London and visible from the M4. It sits squarely in the eastern section of The
Western Corridor gateway to West London.

The Western Corridor office market remains one of the most successful office centres in the UK and is a popular
destination for occupiers. Its main attractions being its global connectivity, its proximity to the national motorway
networks, multi modal transport infrastructure and its access to a vast and high quality labour pool.

The market continues to outperform:

     •    Occupational activity remains robust.
     •    Rents continue to accelerate although the rate at which they do so has slowed. The Western Corridor Prime
          Average rent increased by 0.8% year-on-year to £35.89 per sq ft as at Q3 2018.
     •    Take up increased by 1.5% year on year with 750,935 sq ft transacted in Q3 2018.
     •    Vacancy rates dropped from 11% in Q2 to 10.6% in Q3 2018.
     •    Named active demand totals 3,488 million sq ft across the region as at Q3 2018, with an average
          requirement of 20,641sq ft.

COPYRIGHT © JONES LANG LASALLE IP, INC. 2019. All Rights Reserved                                                   7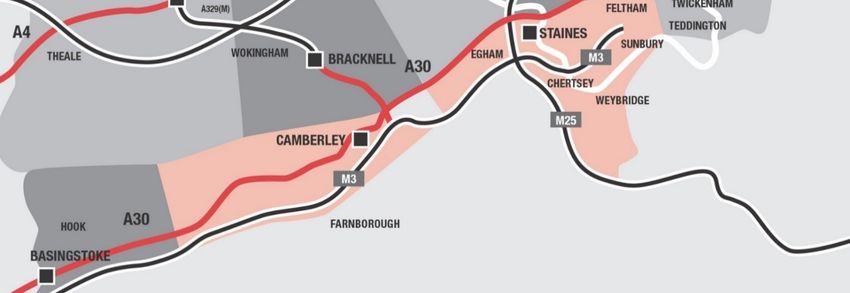
2.1 Take Up
The Western Corridor market saw a strong end to 2017 with almost 750,000 sq ft transacted in the final quarter of
the year. This helped to boost take-up by 19% when compared to 2016, with the annual total standing at 1.9m sq
ft.

At the beginning of Q4 2018, take up is on track to exceed these levels and will likely end up in excess of 2 million sq
ft. West London continues to lead the way as the most active region in Q3, with take up reaching 469,773 sq ft
compared to 281,162 sq ft recorded in the Thames Valley. The Manufacturing sector was the most active this
quarter, accounting for 32% of all take up across the Western Corridor in Q3.

2.2 Average Deal Size
Another key trend within Western Corridor take up, is the decline in average deal size across the market. The table
below highlights historical take up, average deal size and the number of deals done +50,000 sq ft. The graph
highlights historical take up by each size band. This data supports the case that smaller floor plates (5 -25,000 sq ft)
would be suitable for this redevelopment project.

COPYRIGHT © JONES LANG LASALLE IP, INC. 2019. All Rights Reserved                                                      8

000's sq ft

          3500
          3000
          2500
          2000
          1500
          1000
            500
               0
                       2009

                                  2010

                                             2011

                                                         2012

                                                                    2013

                                                                            2014

                                                                                     2015

                                                                                            2016

                                                                                                   2017

                                                                                                          2018
               200,000+                       100,000-199,999              50,000-99,999
               25,000-49,999                  10,000-24,999                5,000-9,999

2.3 Occupier Demand

As at Q3 2018 named occupier demand across the Western Corridor stood at 3.488 million sq ft. Whole demand
(which measures named and unnamed demand) is currently at 7.51 million sq ft, with an average requirement size
of 20,641 sq ft.

2.4 Supply and Vacancy Rates
Total office supply across the Western Corridor sits at 8.63 million sq ft in Q3 2018, down 3.7% from the previous
quarter and notably, down 14% y-o-y.

Increased take up levels combined with the extension of Permitted Development Rights have continued to erode
supply. The proportion of Grade A supply has however increased slowly as Permitted Development Rights (PDR)
acquisitions have absorbed elements of the secondary stock. As at Q3 2018, 68% of available space in the Western
Corridor is Grade A.

2.5 Development Pipeline
Despite a slight rise in Q3, the development pipeline remains low with 817,000 sq ft of space currently under
construction on a speculative basis.

West London continues to lead the way with 458,700 sq ft of speculative space currently under construction, with
358,500 sq ft in the Thames Valley.

With healthy occupier demand and an overall easing in the development pipeline, good quality space is likely to
come under increasing pressure, especially as a supply gap looks set to emerge in 2020-21.

COPYRIGHT © JONES LANG LASALLE IP, INC. 2019. All Rights Reserved                                                    9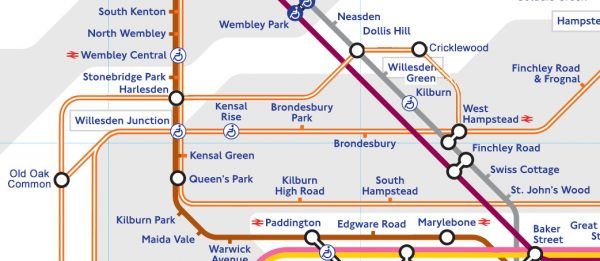
This pinch point is equally well illustrated by the diagram below for West London.

COPYRIGHT © JONES LANG LASALLE IP, INC. 2019. All Rights Reserved                    10
2.6 Rents
Rental growth was steady across the Western Corridor, with both West London and the Thames Valley seeing rises,
as the overall average WC rent reached £35.89 psf. Growth over the quarter was led by increases in Ealing, Reading
and Slough.

2.7 Grade A Rents and Y-
                      Y-O-Y Rental Growth

2.8 Characteristics of the marketplace
                           marketplace
With demand continuing to take the best space and the replacement rate falling below 1% of total stock there is a
growing future supply risk. Our net absorption forecasts are showing a pinch point coming – focused on 2020 and
2021. As the take-up figures above demonstrate, the market fundamentals are strong which provide a firm
business case for speculative development in locations which can attract talent and deliver the environments that
occupiers and their staff want. A number of towns across the region present real opportunities for developers and
investors to capitalise on the demand for quality space and to address the supply gap in 2020 and beyond.

COPYRIGHT © JONES LANG LASALLE IP, INC. 2019. All Rights Reserved                                               11
The dynamics of the Western Corridor market have undergone fundamental and in some cases, structural change which has resulted in variable take-up volumes which we believe is due to a variety of factors including; occupiers seeking to drive efficiencies from their portfolio and reducing space occupied, acquiring efficient accommodation to enable more dense occupation, the “war for talent” driving business across this region back in to town centre and city locations with primary public transport nodes and HR playing an increasingly important role in property decision making. This distinct change in the pattern of corporate occupation which has in part been driven by technology advancement but also through a demand for increased efficiencies means that in 2008, a standard workplace was space planned on a ratio of one person to 12.5 sq m but by 2015 this had changed to, on average, an occupational density of one person per 9.6 sq m and we are already seeing this tighten further with new and newly refurbished buildings offering the potential for occupational density of 1:8 sq m and in some cases even 1:6 sq m. Whilst in real terms, the impact of this is a 36% reduction in office space occupied today compared to 9 years ago, the impact of net absorption has diluted this somewhat. COPYRIGHT © JONES LANG LASALLE IP, INC. 2019. All Rights Reserved 12
3 Brentford & Hounslow Office Market Review
3.1 Overview
The Brentford office market sits within the sought after “Golden Mile”, a strategically located submarket due to its
proximity to Heathrow airport and Central London. The Golden Mile stretches from Chiswick Park to the east to
Syon Lane to the West. Major occupiers in the area are Allianz, Barratt Homes, GlaxoSmithKline, JC Decaux, Sega
and Sky. The Golden Mile was once predominantly an industrial area and whilst there is still evidence of this,
rising commercial office and residential values in West London have seen a steady decline in industrial uses in the
area.

3.2 Infrastructure
Plans are underway to create a new rail link between Southall and Brentford which would link the town to
Crossrail. Proposals under the Hounslow Council would see three trains run an hour on the existing freight line. A
new station would be built at Transport Avenue (close to GSK & Sky offices) and this would eventually be
connected to Brentford’s main train station. The new Brentford-Southall link could be running by 2020, following
the full completion of Crossrail.

Whilst Crossrail is over 85 per cent complete, the new Elizabeth line railway opening has been delayed but should
be operational by December 2019. The line will transform Southall train station and accessibility to central
London – occupiers can travel from Southall to Bond Street in just 17 minutes.

In addition, to Crossrail, West London Economic Prosperity Board has now endorsed a plan to convert freight
railway tracks that run in part behind the site, into passenger services to create a potential extension of the
London Overground service and link parts of West London currently poorly served by rail services.

COPYRIGHT © JONES LANG LASALLE IP, INC. 2019. All Rights Reserved                                                  13
The little used railway line runs from just north of Cricklewood on the Thameslink line and loops around West
London, ever so slightly just missing aligning with a number of stations on existing lines until it join up with the
London Overground at Acton.

Plans to do something to improve the east-west links in this part of London have been around for many years,
ranging from a full scale tube train service to a DLR style light rail.

A consortium of local councils, the West London Economic Prosperity Board has now endorsed a plan to convert
the freight railway tracks into passenger services and create what could be an extension of the London
Overground service.

The Dudding Hill Line is an existing railway line in north-west London running from Acton to Cricklewood. The line
itself has had no scheduled passenger service for over a century. It has no stations, no electrification and a 30
miles per hour (48 km/h) speed limit with semaphore signalling, and is lightly used by freight and very occasional
passenger charter trains.

Accessibility is a key location factor for any relocation or business expansion. Accessibility to the office and key
transport nodes is not only important for employees commuting to work, but also connectivity to clients and
domestic and international business hubs and these proposals could have a significant impact on demand for
Brentford.

3.3 Take Up
The graph below highlights the take up of office space within Brentford and Hounslow between the years 2014
and 2018. The five year average take up (including Asurion) in the town is 30,256 sq ft. While 2014 and 2015 were
just below this level, this level has been exceeded since 2016.

COPYRIGHT © JONES LANG LASALLE IP, INC. 2019. All Rights Reserved                                                      14
Brentford - Take up (sq ft)
 40,000

 35,000

 30,000

 25,000

 20,000

 15,000

 10,000

   5,000

       0
                    2014                     2015                   2016                 2017            2018

In Q3 2018, take up in excess of 5,000 sq ft was 28,050 sq ft. However, Asurion Europe Ltd has now completed at
Vantage London which takes the total to 40,250 sq ft, the highest level of take up for more than five years. There
have also been a number of transactions between 3,500 sq ft and 5,000 sq ft which brings the total to date closer
to c. 55,000 sq ft.

We set out below a table illustrating key leasing transactions in the past two years:

    Date                Property                    Town                   Occupier             Size        Rent     Term

    Q4
                  Vantage London                Brentford            Asurion Europe Ltd         12,220     £25.50   10 years
   2018

    Q3
                  Vantage London                Brentford                    Regus              17,082     £27.50   12 years
   2018

    Q1
                  Vantage London                Brentford                  Pole to Win          10,968     £25.00   10 years
   2018

    Q4
                       The Mille                Brentford                     UBC               16,624     £20.00   10 years
   2017

    Q4
                  Vantage London                Brentford            GI Education Group         14,071     £25.50   10 years
   2016

    Q2
                  Vantage London                Brentford                  Cineworld            15,408     £25.00   10 years
   2016

    Q2
                Building 1 Brentside            Brentford                   Verisure            13,045     £23.08   10 years
   2016

COPYRIGHT © JONES LANG LASALLE IP, INC. 2019. All Rights Reserved                                                              15
3.4 Occupier Demand
Since 2014, there has been a lack of enquiries of any true scale in the Brentford area and this, combined with high
residential values, has accounted for the scant redevelopment in the area. The largest requirement in 2017 was for
Regus who were looking for 100,000 sq ft in Brentford. In July 2018 Regus finally completed on 17,000 sq ft at
Vantage London which followed a letting of 16,624 sq ft to United Business Centres (UBC) at The Mille in Q4 2017
following the expiration of their previous management turnover agreement. Whilst this has not endorsed the area
for larger requirements, it does reinforce the appeal for and rise of co-working and shared workspace mentioned
in section 5 of this report and as well as highlight the demand for occupiers looking for space in the 5,000 – 20,000
sq ft bracket and notably in buildings where there is good access to retail.
3.5 Supply and Vacancy Rates
The graph below highlights the change in office supply within Brentford and Hounslow from 2014 to Q3 2018.
Brentford and Hounslow’s office supply increased significantly in 2014 and 2016 with c. 400,000 sq ft of office
space available. In 2015 this level reduced due to a number of office blocks being converted to residential space
before the level of stock increased again in 2016 to c. 400,000 sq. ft. There has however, been significant erosion
of supply in the last 18 months with both Parkview and New Horizons Court now being converted to residential.
Vacancy rates alike supply have fluctuated year on year however the trend since 2016 has seen the level of
vacancy decrease. In 2015 the vacancy rate was 3%, growing to just below 6% in 2016, 4% in 2017 and stabilising
at 3% in 2018. This trend indicates increased demand in combination with the net loss of office schemes such as
Park View (114,688 sq ft) to residential conversion.
500,000 6.0%
450,000
5.0%
400,000
350,000
4.0%
300,000
250,000 3.0%
200,000
2.0%
150,000
100,000
1.0%
50,000
0 0.0%
2014 2015 2016 2017 2018
Supply (sq ft) Overall VR %
COPYRIGHT © JONES LANG LASALLE IP, INC. 2019. All Rights Reserved 163.6 Development Pipeline
Pipeline
There is a lack of supply in the pipeline across Brentford and Hounslow because of permitted development with
no schemes currently under construction. The most recent completion in the market was Vantage London,
Brentford (114,997 sq ft) which completed in Q2 2016 and Orbit Southern are currently refurbishing Unit 4
Brentside (26,842 sq ft).
140,000
120,000
100,000
80,000
60,000
40,000
20,000
0
2013 2014 2015 2016 2017 2018 2019 2020
Completions Under Construction Needs Pre-let
Given that Grade A supply is generally regarded as constrained, it is useful to note the emerging office offer from
recent local planning consents which may assist to restore a balance to the erosion of office supply through
permitted development conversion.
LPA Ref. P/2015/5555 at the Chiswick Curve site:
“Redevelopment of site to provide a mixed use building of one part ground plus 31 storeys and one part ground
plus 24 storeys, comprising 327 residential units (Use Class C3), office (Use Class B1) and retail/restaurant uses
(Use Class A1-A3), basement car and bicycle parking, resident amenities and hard and soft landscaping with all
necessary ancillary and enabling works. The application is accompanied by an Environmental Statement.
Following the application being refused at Planning Committee in February 2017 and the Applicant lodged an
appeal against the Council’s decision in August 2017. A public inquiry was held in June/July 2018 and the
Inspector’s Decision is pending.
LPA ref. P/2011/1133 Former Alfa Laval, Site, Great West Road, Brentford, TW8 9BU. Granted February 2012 –
4,677sqm office
LPA ref. P/2012/2735 Land to the South Side of Brentford High Street and Waterside, Brentford. Granted
November 2014 – up to 4,000 sqm office
LPA ref. P/2017/4692 The Citroen Site – the application seeking full planning permission for the redevelopment of
the site for a residential-led mixed-use scheme was submitted and refused by LBH. Following GLA intervention,
COPYRIGHT © JONES LANG LASALLE IP, INC. 2019. All Rights Reserved 17further public consultation and a hearing, the scheme is approved subject to signing of a S106 agreement and
referral to the Secretary of State in August 2018. The revised scheme includes B1 uses.
3.7 Rents
Rents
The graph below identifies the prime rents for Grade A space in Brentford and Hounslow. The rental series has
been consistently flat in recent years but between Q4 2013 and Q4 2016 there was a dramatic increase of £10.00
psf (50%). Rents then plateaued and over the past 12 months have reduced to £28.50 psf. There is an argument
that with a dearth of office space becoming available this may push rental levels back up particularly if some of
the infrastructure changes come forward which will likely see general increase in demand for Brentford office
stock.
Brentford - Prime Rents (£ per sq ft)
£31.00
£29.00
£27.00
£25.00
£23.00
£21.00
£19.00
£17.00
£15.00
4Q13 4Q14 4Q15 4Q16 4Q17 2Q18
COPYRIGHT © JONES LANG LASALLE IP, INC. 2019. All Rights Reserved 184 Brentford demographic and employment analysis 4.1 Population growth The population of the London Borough of Hounslow has increased by 20% over the past 15 years. This is above the Greater London average growth of 16% over the same period and is one of the highest growth rates of all London boroughs. However, this high rate of growth is expected to slow over the next 15 years. The current population of 271,000 is expected to grow to 313,000 by 2031 - a 12.5% increase. This growth rate is more in-line with the expected wider growth rate for Greater London of 13% over the next 15 years. According to current forecasts, the Greater London population is expected to reach 10.2million in the next 15 years. Population growth 2002 2016 % change 2031 forecast % change Hounslow 216,750 271,100 20.0 313,180 12.5 Greater London 7,377,000 8,787,900 16.1 10,204,400 12.9 Source: JLL, Oxford Economics 4.2 Household growth There are currently 104,350 households in Hounslow, an increase of 18.6% from 2002. Households in the borough are forecasted to continue to grow at the current rate over the next 15 years, and reach 130,570 in 2031. Household growth 2002 2016 % change 2031 forecast % change Hounslow 85,000 104,350 18.6 130,570 18.8 Greater London 3,069,000 3,572,000 14.1 4,392,200 17.5 Source: JLL, Oxford Economics COPYRIGHT © JONES LANG LASALLE IP, INC. 2019. All Rights Reserved 19
CACI Acorn analysis of households is a useful way to understand the demographics of an area.

According to Acorn, the group within 1km of Brentford is Rising Prosperity at 49%. This is in line with the proportion
of households within 3km from site, and above the proportion for London at 35%. This proportion largely comprises
young professional renters who are either in well paid jobs or at the beginning of careers where their salaries will
increase at a faster rate than average.

Brentford has an above average population of Rising Prosperity households - one of the more desirable
demographics in terms of affluence and age.

4.3     Largest Employment Sectors

                                          Brentford (LB Hounslow) Largest Employment Sectors
                                 60,000

                                 50,000
              No. of Employees

                                 40,000

                                 30,000

                                 20,000

                                 10,000

                                     0

Source: JLL, Oxford Economics

4.4     Employment prospects
The largest occupational group within 1.5 km of the site is A grade professions at 35%. These jobs are categorised
as Higher and Intermediate Managerial/Admin/Professionals, and are predominantly the highest earners in the
country. This proportion increases to 39% of the working population within 3km of the site and is above the London
average of 30%.

COPYRIGHT © JONES LANG LASALLE IP, INC. 2019. All Rights Reserved                                                   20
The second largest occupational group is B1 grade workers at 33% of all workers within 1km of the site. This is in
line with the proportion seen within 3km of the site (31%) and in Greater London (33%). This group includes
supervisory, clerical and junior managerial positions.
Brentford has a higher proportion of professionals compared with Greater London, highlighting its affluence and
its attractiveness as a place to live and work.
Employment analysis (% of working population) 1km of site 3km of site London
All Usual Residents Aged 16 to 64 in Employment 8,847 131,556 2,658,570
A. Higher and Intermediate Managerial/Admin/Professional 35 39 30
B. Supervisory, Clerical, Junior Managerial/Admin/Professional 33 31 33
C. Skilled Manual Workers 15 13 15
DE. Semi-skilled and Unskilled Manual Workers, On State Benefit 17 17 22
Source: JLL, CACI
Brentford (LB Hounslow) Employment Growth
(% per annum)
3.0%
2.0%
1.0%
0.0%
-1.0%
-2.0%
-3.0%
-4.0%
2013-2017 2018-2022
Total Employment Office based Employment
Source: JLL, Oxford Economics
As the above chart demonstrates, there is a correlation between employment growth and the improved levels of
take up that we are seeing in Brentford in 2018.
According to Oxford Economics, the sectors that we should see the most pronounced growth in Brentford (LB
Hounslow) are Information and Communication, Financial and Insurance, Real Estate activities, Professional,
COPYRIGHT © JONES LANG LASALLE IP, INC. 2019. All Rights Reserved 21Scientific and Tech, and Administrative and Support and it is anticipated that a further 631,386 sq ft of office space will be required to accommodate it. 4.5 Age profile Within 1km of the site, 35% of the population is aged 25-44 and 35% of the population is 45+. This is in line with 3km of the site and London as a whole. The high concentration of people in these age brackets is reflected in the high concentration of young professional Rising Prosperity households. Age profile (% of population) 1km of site 3km of site London Population 42,120 419,670 8,766,503 0 to 14 19 19 19 15 to 24 11 10 12 25 to 34 18 17 19 35 to 44 17 18 16 45 to 54 13 14 13 55 + 22 22 21 Source: JLL, CACI 4.6 Salary analysis As was demonstrated above, there is a high proportion of typically higher earning young professionals living in Brentford. This is reflected by the fact that 34% of households earn more than £60k per annum. This increases to 45% within 3km from the site, which is notably above the London-wide average of 19%. Salary (% of households) 1km of site 3km of site London Households 18,021 174,113 3,555,906 > £60K 34 45 19 £50 - £60K 21 18 14 £40 - £50K 15 15 20 £30 - £40K 16 11 22 £20 - £30K 11 8 19 £0 - £20K 3 3 6 Source: JLL, CACI COPYRIGHT © JONES LANG LASALLE IP, INC. 2019. All Rights Reserved 22
5 Co-Working and Flex Space
         Co-working has been a disruptor in the office market over the past 4 years. Typically attractive to work-at-
         home professionals, independent contractors, or people who travel frequently, co-working is the social
         gathering of a group of people who are still working independently, but who share values, and who are
         interested in the synergy that can happen from working with like-minded talented people in the same
         space.

         At its core, its rapid growth is being driven by the evolving nature of work and the shifting structure of the
         economy, supported by rapidly advancing technology. On the surface, we’re seeing the rise of the gig
         economy and an explosion of start-ups. Corporate attitudes are also changing with an increased emphasis
         on flexibility and agility. Many larger companies now realise that, to compete in the digital age, they need
         to attract and retain skilled people who are unlikely to relish traditional office environments.

         These drivers are challenging many aspects of the established office leasing model – and encouraging
         more companies to experiment with flexible space. While it still accounts for only a small proportion of
         overall office stock, our numbers show that it is growing fast.

         In 2017 alone, the total amount of flexible space in the top 20 largest flex markets globally grew by 30% -
         equivalent to around 1 million square metres. Since 2014, the market has more than doubled, and in
         London, it now represents around one fifth of take-up.

         Investors and developers are increasingly adapting to the rise of flexible space by introducing their own
         concepts or partnering with existing providers. Meanwhile, buildings with a high percentage of flexible
         space are increasingly seen as viable investment propositions as demonstrated by Regus and UBC
         committing to 10 year + leases at Vantage London and The Mille respectively in the past 12 months.

         JLL feel the arrival of a co-working solution has revolutionised the serviced office market. The opinion of
         many is that the co-working solution is a different product to the older and more traditional serviced office
         model. There is no doubt it is but we feel both are still very closely linked and despite being behind the co-
         working curve we feel both co-working firms and serviced office providers will be competing closely over
         the coming years as both look to replicate and exploit the benefits that each model offers.

         The traditional model of a serviced office, squeezing as much revenue from a floor plate as possible has
         begun to change with the serviced office providers now offering far more circulation space, meeting rooms
         and break-out areas to try and enhance the working environment for their clients. Providers may have
         made more revenue from each floor plate previously; however, there is a strong opinion now that clients
         will stay longer if you offer them a more versatile working environment and so the revenue you may lose
         from having less office space will be made up through occupiers staying for longer.

         This is also linked to the growth of the TMT sector and the need for serviced office providers to move away
         from their corporate feel. It will take time for the larger serviced office providers to change, however, in
         time we feel they will offer solutions far closer to the co-working model.

COPYRIGHT © JONES LANG LASALLE IP, INC. 2019. All Rights Reserved                                                      23
On the other hand, whilst we see a huge increase in enquiry for co-working space and shared space, it is
also clear that the UK market and its numerous sectors have a need for the more traditional serviced office
model.
Whilst Regus and UBC are both operating in Brentford, the reality is that there is a gap in the LB Hounslow
market for the evolved serviced model that co-working offers small and medium local business.
COPYRIGHT © JONES LANG LASALLE IP, INC. 2019. All Rights Reserved 246 Summary of Analysis and Co
Conclusion
The site is ripe for redevelopment and its position within the Golden Mile is an area that is already seeing
significant change.
As outlined, there has been a significant erosion of office supply in Brentford but in many cases these buildings
were already obsolete and therefore, as economic factors improved following the downturn, there has been a
drive due to recruitment and retention or business needs for occupiers to move in to new or refurbished Grade A
buildings. The continued volatility of the economic and political scene has meant that it is more difficult for
occupiers to predict business space needs in the medium to long term. This has increased popularity of the
serviced office market and correspondingly, marked the relative decline in pre-lets, unless the requirement is very
bespoke, due to the inherent risk associated with a process that can take as long as three years to deliver from
agreeing terms to completion of the building.
To conclude the contents of the report:
• Employee retention and attraction is increasingly important for occupiers as the recruitment of
key talent is becoming more competitive, particularly in and around London. Occupiers are now
investing more in their working environments and are demanding better quality buildings that are
flexible and will appeal to the younger generation.
• Brentford has a highly educated workforce with 39% of the working population within 3km of the
site being Higher and Intermediate Managerial/Admin/Professionals which is above the London
average of 30%. The second largest occupational group is B1 grade workers at 33% and includes
supervisory, clerical and junior managerial positions.
• Brentford has a higher proportion of professionals compared with Greater London, highlighting its
affluence and its attractiveness as a place to live and work.
• With growing occupancy costs and competition for Grade A accommodation in Central London,
occupiers are now looking at alternative non-core locations, for significant cost arbitrage.
Brentford fulfils this given its very competitive rental tone.
• Office schemes need to be subsidised by an alternative use that is in high demand thereby
mitigating the risk and financial implications of a speculative office development. The scheme
proposed will be complemented by residential use (as outlined in the opening sections), there is a
great and growing demand for residential accommodation within Brentford and the associated
values for residential will underpin and insulate the void and market incentive for the office space.
• Less working space both in absolute terms, and per employee is required due to technological
advances, improved efficiencies in building design and due to changing work cultures. The rise of
‘hot desking’ and remote working leads to reduced square feet let in overall terms although
locally this is off-set by net absorption.
COPYRIGHT © JONES LANG LASALLE IP, INC. 2019. All Rights Reserved 25• There is increasing pressure to provide the workforce with communal spaces and facilities to
encourage a more health conscious working environment. This is now designed into new office
accommodation eg increased cycle parking and facilities for those who cycle or run to work such
as dedicated shower space and drying facilities. The scheme offers both hard and soft
landscaping and provision for cycle storage.
• Office locations now more than ever desire to be clustered amongst other uses. Office and
residential use for example can complement each other and help create more of a community
location rather than just a place to work. Office occupiers are increasingly conscious of the need
to be located within easy reach of amenities and services and that includes offering developments
within easy reach of residential accommodation.
• Industrial uses are not as compatible with residential as office use and have a less positive impact
on employment opportunities for the local population.
• In addition, due to its strategic Brentford Golden Mile location, the site borders Chiswick which is
recognised as one of the major London office sub-markets and is one of West London’s largest
employment hubs with the likes of the nearby award winning Chiswick Business Park where rents
in excess of £50.00 per sq ft. This makes the location instinctively more appropriate for office use.
• Due to the anticipated growth of Information and Communication, Financial and Insurance, Real
Estate activities, Professional, Scientific and Tech, and Administrative and Support, a further
631,386 sq ft of office space will be required in the Brentford to accommodate it.
COPYRIGHT © JONES LANG LASALLE IP, INC. 2019. All Rights Reserved 26JLL 30 Warwick Street London W1B 5NH +44 (0)20 3147 6040 www.us.jll.com Jones Lang LaSalle © 2018 Jones Lang LaSalle IP, Inc. All rights reserved. The information contained in this document is proprietary to Jones Lang LaSalle and shall be used solely for the purposes of evaluating this proposal. All such documentation and information remains the property of Jones Lang LaSalle and shall be kept confidential. Reproduction of any part of this document is authorized only to the extent necessary for its evaluation. It is not to be shown to any third party without the prior written authorization of Jones Lang LaSalle. All information contained herein is from sources deemed reliable; however, no representation or warranty is made as to the accuracy thereof.
You can also read