2021 Half year results - 3 August 2021 - Direct Line Group

Page created by Clarence George
 
CONTINUE READING
2021 Half year results - 3 August 2021 - Direct Line Group
2021 Half year
   results
 3 August 2021

                 1
2021 Half year results - 3 August 2021 - Direct Line Group
Today’s speakers

         Penny James   Neil Manser
            CEO            CFO

                                     2
2021 Half year results - 3 August 2021 - Direct Line Group
H1 2021 highlights

     1   Strong financial performance with operating profit of £370m

         Announced a new Motor partnership with Motability Operations Ltd; demonstrating our
     2   strengths in customer service and car repair

         Delivered major technology milestone; new Motor platform live across Direct Line, Churchill
     3   and Privilege

     4   Continued to focus on digitalisation, personalisation and the transition to a green economy

         Strong capital generation; growth in interim dividend and commencing the remaining £50m
     5   share buyback programme announced at the FY2020

                                                                                                       3
2021 Half year results - 3 August 2021 - Direct Line Group
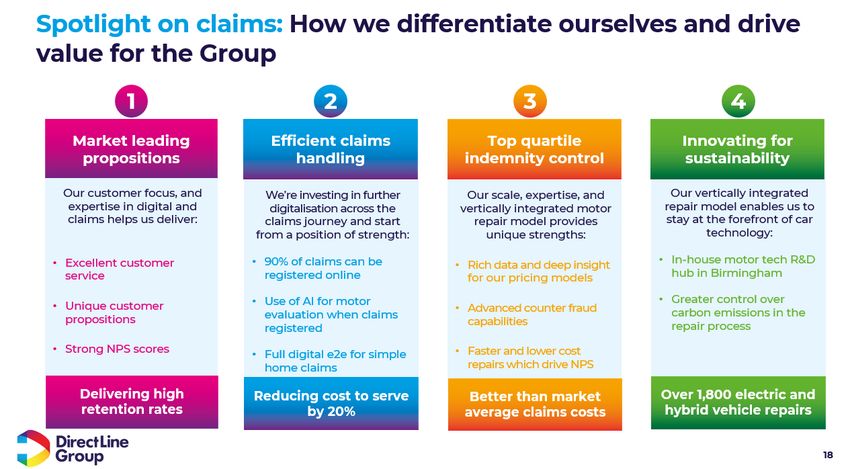
Delivering our ambition

                          Neil Manser
                              CFO

                                        4
2021 Half year results - 3 August 2021 - Direct Line Group
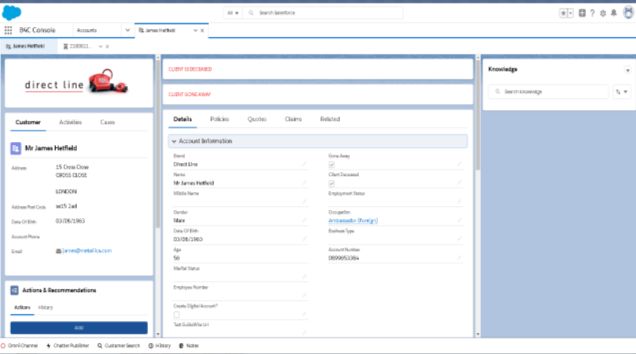
H1 2021 financial highlights

  Operating                         Direct own                                  Progress on                    2021               Strong
    profit                            brands                                   underlying cost              combined            shareholder
                                     portfolio                                     base                   operating ratio         returns
                                     growth

  £370m                                  +1.3%                                      -£30m                  90% - 92%                 7.6p
                                                                                                                               Interim dividend, 2.7%
                                                                                                                                  per share growth

                                   +5.9% own brand
                                  portfolio excluding
                                                                                    Reduction in
                                                                               controllable costs in H1
                                                                                                           2021 expectation1        £50m
                                        Motor                                                                                    Share buyback
                                                                                        2021                                   completed in H1 2021

              1. Normalised for weather                                                                                                                 5
              See notes on slide 30 and glossary of terms on slides 50 to 53
H1 2021 results summary: Strong financial performance

Financials £m                              H1 2020              H1 2021            Change                                     Observations
Gross written premium                        1,580.8             1,556.5       A     (1.5%)   •    Gross written premiums 1.5% lower, with growth across Commercial, Home
                                                                                              A
                                                                                                   and Green Flag Rescue offset by Motor and Travel
Underwriting profit                           143.6              229.3               59.7%
                                                                                              •
                                                                                              B    Strong operating profit of £370m reflects:
Instalment and other income                   80.0                 72.2              (9.8%)
                                                                                                     •   Non-repeat of Covid related Travel claims
Investment return                              41.3               68.4               65.6%           •   Investment gains of £17m (£14m net realised and unrealised
                                                                                                         investment loss in H1 2020)
Operating profit                             264.9               369.9         B     39.6%
                                                                                                     •   Lower Motor claims frequency due to lockdown restrictions
Restructuring and one-off costs               (15.0)              (91.5)       C 510.0%
                                                                                                     •   Strong prior year reserve releases of £153m (£123m in H1 2020)
Finance costs                                 (13.5)              (17.1)       D (26.7%)             •   Benign weather costs of just £3m (£30m in H1 2020)

Profit before tax                            234.6                261.3              10.5%    C
                                                                                              •    Restructuring and one-off costs of £91m reflects progress on site strategy
Profit after tax                              192.6              203.8                5.8%
                                                                                              D
                                                                                              •    Finance costs increased to £17m due to additional interest on the Tier 2
Key metrics %                              H1 2020              H1 2021            Change          debt issued in June 2020

Combined operating ratio (COR)               90.3%               84.2%               6.1pts   •E   Combined operating ratio improved by 6 points to 84%, normalised for
                                                                               E                   weather, the COR improved by 4 points to 86%
COR normalised for weather                   90.4%               86.3%               4.1pts
                                                                                              •F   Annualised return on tangible equity of 30%, 15 points ahead of the Group’s
Return on tangible equity (RoTE)              19.9%              30.1%         F 10.2pts           15% target

                                                                                                                                                                                 6
                         See notes on slide 30 and glossary of terms on slides 50 to 53
In-force policies and premiums: The benefits of a diversified
model

                         In-force policies (000’s)                                                                                                Gross written premiums (£m)

                                                              11.3%
                                                  7.0%                                                                                                                                       16.4%
                                      6.0%                                -3.0%                                              £1,581m
 14,633                                                                                                                                               Direct own brands                                 -6.3%
                         5.5%

                                                                                                                                                               -2.4%
                                                                                                                                                                                                                               £1,557m
                                                                                                                                                                                 15.6%
              -2.6%                                                                                                                                                                                                -14.8%
                                                                                                   14,471
                      Direct own brands                                                                                                                 2.6%        4.3%
                                                                                      -4.2%
                           +1.3%                                                                                                          -5.7%

  30 June    Motor own Home own    Green Flag Commercial     NIG and    Motor and    Other    30 June 2021                   H1 2020     Motor own Home own       Green Flag Commercial     NIG and    Motor and    Other       H1 2021
 2020 IFPs    brands    brands      Rescue     direct own     other       Home     Rescue and     IFPs                        gross       brands    brands         Rescue     direct own     other       Home     Rescue and     gross
                                                 brands                partnerships other PL1                                written                                            brands                partnerships other PL1    written
                                                                                                                            premiums                                                                                           premiums

                            1.    This segment comprises Rescue excluding Green Flag, and other personal lines products – Pet, Travel, Creditor and our mid-to high-net worth business, UK Select                                         7
                                  See notes on slide 30 and glossary of terms on slides 50 to 53
Motor: Claims frequency has lagged car usage

                                                              Department for Transport car usage1                                                                                                                                                                                                                                                                                                        Claims severity                  Observations

120%
                                                    Q2 2020                                                              Q3 2020                                                           Q4 2020                                                                  Q1 2021                                                      Q2 2021                                                                        Vs. expectations

100%
                                                                                                                                                                                                                                                                                                                                                                                                         Damage                     • Claims frequency lagged car
                                                                                                                                                                                                                                                                                                                                                                                                                                      usage and was broadly in line
80%                                                                                                                                                                                                                                                                                                                                                      Significant                                                                  with H1 2020 experience
                                                                                                                                                                                                                                                                                                                                                         increase in
                                                                                                                                                                                                                                                                                                                                                          weekend
                                                                                                                                                                                                                                                                                                                                                          car usage
                                                                                                                                                                                                                                                                                                                                                                                                         Small BI
60%
                                                                                                                                                                                                                                                                                                                                                                                                                                    • Claims frequency now almost
                                                                                                                                                                                                                                                                                                                                                                                                                                      back to the level assumed in
40%
                                                                                                                                                                                                                                                                                                                                                                                                                                      our pricing
                                                                                                                                                                                                                                                                                                                                                                                                         Large BI
20%

                                                                                                                                                                                                                                                                                                                                                                                                                                    • Whiplash reforms have
 0%
                                                                                                                                                                                                                                                                                                                                                                                                           Severity inflation has     contributed to deflationary
                                                                                                                                                                                                                                                                                                                                                                                                         returned to around the       market conditions
       01/03/20
                  16/03/20
                             31/03/20
                                        15/04/20
                                                   30/04/20
                                                              15/05/20
                                                                         30/05/20
                                                                                    14/06/20
                                                                                               29/06/20
                                                                                                          14/07/20
                                                                                                                     29/07/20
                                                                                                                                13/08/20
                                                                                                                                           28/08/20
                                                                                                                                                      12/09/20
                                                                                                                                                                 27/09/20
                                                                                                                                                                            12/10/20
                                                                                                                                                                                       27/10/20
                                                                                                                                                                                                  11/11/20
                                                                                                                                                                                                             26/11/20
                                                                                                                                                                                                                        11/12/20
                                                                                                                                                                                                                                   26/12/20
                                                                                                                                                                                                                                              10/01/21
                                                                                                                                                                                                                                                         25/01/21
                                                                                                                                                                                                                                                                     09/02/21
                                                                                                                                                                                                                                                                                24/02/21
                                                                                                                                                                                                                                                                                           11/03/21
                                                                                                                                                                                                                                                                                                      26/03/21
                                                                                                                                                                                                                                                                                                                 10/04/21
                                                                                                                                                                                                                                                                                                                            25/04/21
                                                                                                                                                                                                                                                                                                                                       10/05/21
                                                                                                                                                                                                                                                                                                                                                  25/05/21
                                                                                                                                                                                                                                                                                                                                                             09/06/21
                                                                                                                                                                                                                                                                                                                                                                        24/06/21
                                                                                                                                                                                                                                                                                                                                                                                   09/07/21
                                                                                                                                                                                                                                                                                                                                                                                              24/07/21
                                                                                                                                                                                                                                                                                                                                                                                                          top end of our normal
                                                                                                                                                                                                                                                                                                                                                                                                          expectation of 3%-5%

                                                                                                    1.       Department for Transport, Great Britain use of transport mode since 1 March 2020, figures are percentages of an equivalent day or week
                                                                                                                                                                                                                                                                                                                                                                                                                                                                      8
Motor: Underwriting discipline in a deflationary market

            Operating profit                                                                       Key metrics                            Observations
                                           £231m                                                          H1 2020    H1 2021   • Own brands average premiums
      £221m                                                                                                                      reduced by 1.7%
                                              46                                Own brands GWP             £779m     £733m
         27                                                                                                                    • Current year loss ratio continued to
         59                                                                     Own brands average                               benefit from lower claims frequency
                                              53                                premium1 £
                                                                                                           £383       £376
                                                                                                                               • Prior year reserve releases elevated by
                                                                                Current year loss ratio    65.5%     66.9%
                                                                                                                                 favourable development in large bodily
        134                                   132                                                                                injury claims

                                                                                Prior year ratio           (11.2%)   (13.8%)   • Reduction in instalment and other
 £83m PY                                                                                                                         income reflects lower premiums and
  release                                      £101m PY                                                                          claims volumes
                                                                                Loss ratio                 54.3%      53.1%
                                                release
                                                                                                                               Outlook:
                                                                                Commission ratio           2.9%       3.1%
                                                                                                                               • In H2 2021 the current year loss ratio is
       H1 2020                              H1 2021                                                                              expected to be closer to 2020
                                                                                Expense ratio              24.7%      25.6%      underlying of c. 79%
              Investment return
              Instalment and other income
              Underwriting profit                                               COR                        81.9%      81.8%

                   1.   Excludes Darwin                                                                                                                                      9
                        See notes on slide 30 and glossary of terms on slides 50 to 53
Home: Growth across direct and PCW alongside benign
weather

             Operating profit                                                                    Key metrics                            Observations
                                                                                                         H1 2020   H1 2021   • Strong new business growth in direct
                                          £75m
                                                                                                                               and PCWs driven by improved
                                              7                               Own brands GWP             £194m     £199m       competitiveness in a buoyant housing
                                                                                                                               market
                                             10                               Own brands average
                                                                                                          £219      £211
                                                                              premium £
                                            58                                Current year attritional                       • Own brands average premiums were
                                                                                                          53.0%    52.3%       3.5% lower than H1 2020 due to mix and
                                                                              loss ratio
                                                                                                                               pricing actions
          £35m                                                                Major weather               6.4%      1.1%
            4                                £18m PY
                                                                              Prior year ratio            (0.9%)   (6.4%)    • Stable current year attritional loss ratio
£3m PY                                        release
            10                                                                                                                 with severity inflation in line with 3% to
release                                      and £3m
                                                                                                                               5% expectation
 £18m                                        weather                          Loss ratio                  58.5%    47.0%
            21
weather
                                                                              Commission ratio            6.8%      5.8%     • Increase in profit due to benign weather
                                                                                                                               and higher prior year reserve releases
          H1 2020                         H1 2021
                                                                              Expense ratio               27.1%    26.2%       following favourable development in
                                                                                                                               escape of water claims
              Investment return                                               COR                         92.4%    79.0%
              Instalment and other income
                                                                              COR normalised for                             • COR of 79% or 86% normalised for
              Underwriting profit                                                                         94.2%    86.2%
                                                                              weather                                          weather

                                                                                                                                                                            10
                      See notes on slide 30 and glossary of terms on slides 50 to 53
Rescue and other personal lines1: Continued earnings growth
in Rescue

       RoPL operating profit                                                                    Observations                                                         Rescue operating profit

COR        111.3%                           93.0%                                                                                                           COR             78.1%                          71.0%

                                                                              • Rescue and other Personal Lines                                                                                            £29m
                                             £21m                               returned to profit with a COR of 93% due
                                                2                               to non-repeat of Travel losses in H1 2020                                                   £24m
           (£16m)                               5
             2                                  13                            • Green Flag returned to double digit
             6                                                                  premium growth in Q2 2021

 £4m PY                                             £2m PY
 release                                                                      • Rescue grew profit to £29m with a COR
                                                    release
                                                                                of 71% due to better indemnity control
            -24                                                                 and cost efficiency due to new claims
                                                                                system

           H1 2020                           H1 2021
                Investment return
                                                                                                                                                                            H1 2020                         H1 2021
                 Instalment and other income

                 Underwriting profit

                         1.   The segment comprises Rescue, including our challenger brand Green Flag, as well as other personal lines products – Pet, Travel, Creditor and our mid-to high-net worth business, UK Select   11
                         See notes on slide 30 and glossary of terms on slides 50 to 53
Commercial: Double digit growth at strong margins

              Operating profit                                                                       Key metrics                             Observations
                                                                                                             H1 2020   H1 2021

                                                                                  Own brands GWP              £79m     £91m
                                             £44m
                                                                                                                                 • Double digit premium growth across
                                                 14                               NIG and other GWP           £211m    £245m
                                                                                                                                   direct own brands and NIG
                                                                                  Current year attritional
                                                                                                              60.2%     61.1%
                                                                                  loss ratio
           £25m                                                                                                                  • Operating profit increased to £44m
                                                4                                 Major weather               5.2%        -        reflecting the benefits of its technology
                                                26                                                                                 transformation and benign weather in H1
             8                                                                                                                     2021
                                                                                  Prior year ratio           (13.7%)   (12.1%)
£33m PY      5                                          £32m PY                   Loss ratio                  51.7%    49.0%
 release                                                                                                                         • Prior year releases broadly stable at £32m
                                                         release
and £13m     12                                         and £0m
 weather                                                                          Commission ratio            17.7%    19.8%
                                                        weather
                                                                                                                                 • Headline COR of 90%, normalised for
                                                                                  Expense ratio               25.5%    21.4%       weather 94%, broadly stable versus H1
           H1 2020                            H1 2021
                                                                                                                                   2020
                  Investment return                                               COR                        94.9%     90.2%
                  Instalment and other income
                                                                                  COR normalised for
                  Underwriting profit                                                                         93.4%    94.0%
                                                                                  weather

                                                                                                                                                                           12
                          See notes on slide 30 and glossary of terms on slides 50 to 53
Prior year reserve release: Strong releases in H1 2021 expected
to reduce in H2

                                       Prior year reserve releases                                 Observations

  Prior year
  loss ratio           9.9%                                       5.9%          10.5%
                                                                                             • 2020 was a low watermark for
                                                                                               prior year reserve releases
                     £295m                                                              H2
                         123                                                                 • H1 2021 reserve releases £30m
                                                                                        H1     higher due to favourable
                                                                                               development on large bodily
                                                                                               injury claims in Motor and
                                                                £174m                          escape of water in Home
                                                                                £153m
                         172                                        51
                                                                                 153         Outlook:
                                                                    123
                                                                                             • 2021 full year releases
                                                                                               expected to be between 2019
                                                                                               and 2020 levels

                        2019                                      2020           2021

                                                                                                                               13
               See notes on slide 30 and glossary of terms on slides 50 to 53
Operating expenses: Progress on controllable cost base

                                  Operating expenses walk                                                                               Observations
     25.2%                                               < Expense ratio >                              24.9%            • Operating expenses of £363m, £9m lower than
                                                                                                                           prior year
     £372m
                                                                                                                         • Progress on cost reduction programme in H1
                                                                                       £15m              £363m             2021, driven by improved operational efficiency

                                                                                                                         • Increase in non-cash depreciation and
                                                                                                                           amortisation charges driven by delivery of new
                                                                                                                           Motor platform
                                                             £5m
                                                                                      Non-cash                           • Restructuring and other one off costs of £91.5m
                                                                                                                           in H1 reflects progress on site strategy
                               £30m
                          H1 2020: £9m                                                                                   Outlook:
                            ‘Force for
                              good’                                                                                      • Aim to get back to expected cost run rate of
Investment return: High quality portfolio with commercial
property revaluation gains

           Investment return                                                                        Group yields                                         Group holdings1 £5,865m

£m                                  H1 2020            H1 2021                                   Net investment income yield
                                                                                                                                                                              5.2%
Investment income                      64.8               58.9                                   Investment return yield
                                                                                                                                                          3.7%       13.7%
Hedging to sterling floating

                                                                                          2.6%
                                       (9.6)              (7.3)                                                                                          4.4%
rate

                                                                                                        2.4%
                                                                                                                                                         0.2%                          64.5%

                                                                                                                                                  2.3%
                                                                                                                      2.2%
                                                                                                                                                          1.7%

                                                                                   2.1%

                                                                                                               2.1%
                                                                                                                                                                  6.6%

                                                                                                 2.0%
Net investment income                  55.2               51.6

                                                                                                                             1.8%

                                                                                                                                           1.7%
                                                                                                                                    1.6%
Net realised and unrealised
                                       (13.9)             16.8
gains/(losses)
                                                                                                                                                                 Investment grade credit
                                                                                                                                                                 High yield
Of which property fair value           (10.3)             10.0
                                                                                                                                                                 Investment -grade private placements
                                                                                                                                                                 Sovereign

Total Investment return                41.3              68.4                                                                                                    Infrastructure debt
                                                                                    2017          2018          2019         2020          H1 2021               CRE loans
                                   31 Dec 2020       30 June 2021                                                                                                Cash and cash equivalents
Available for sale reserve                                                         Net investment income yield expected to be
net of tax                             83.9               45.5                                around 1.6% in 2021                                                Investment property

                  1.   Excludes equity investment
                  See notes on slide 30 and glossary of terms on slides 50 to 53
                                                                                                                                                                                                        15
Capital and balance sheet management: Proposed interim
dividend growth of 2.7% per share to 7.6p

       Observations                                                       Capital evolution                                                                   Capital distributions
• Final regular dividend of 7.6p                              Solvency capital ratio after foreseeable distributions                                                       Regular dividends £m
                                                                                                                                                                           Special dividends £m
  Regular
  per share1; dividend
              2.7% growth                                        % Solvency ratio           T2 debt callable in 2022
                                                                                                                                                                           Share buyback £m

• First tranche of the £100m                         220%                                                                                                                                      £594m
                                                                 165%          170%           165%          191%          195%
  share buyback programme                            200%
                                                                                                                                                                                                   100
  announced alongside the FY                                                                                              18%
  2020 results completed, second
                                                     180%                                                    19%                                 £484m
  tranche on track to be                             160%                                                                                           205                                            195
  completed before the FY 2021                                                                                                                                   £401m
                                                     140%
  results                                                                                                                                                           114         Catch-up
                                                     120%                                                                                                                        of 2019
                                                                                                                                                                                   final
• Solvency capital ratio after                       100%                                                                                                                        regular
                                                                                                                                                                    288                            299
                                                                               170%                        172%          177%                       279                         dividend
  dividend and buyback of 195%                        80%        165%                        165%
  and 177% excluding Tier 2 debt
                                                      60%
  (callable in 2022)                                                                                                                                                            £129m
                                                                                                                                                                                                               £102m
                                                      40%                                                                                                                           30
                                                      20%                                                                                                                           99                             102
• Solvency ratio at H1 2021
  reflects strong earnings and                          0%
  phasing of dividend                                             2017          2018          2019 2        20203      30-Jun-21 4                  2017            2018           2019           2020          H1 2021

               1. Dividend due to be paid 3 September 2021
               2. The impact of the cancellation of the dividend and buyback was 24 percentage points to give a solvency ratio of 189% as at 31 December 2019. The solvency capital ratio as reported as at 31 December
                  2019 after taking account of the then expected 14.4p final dividend and £150m share buyback was 165%
               3. Solvency ratio including Tier 2 debt callable in 2022 and after 2020 final dividend and £100m buyback. Figures estimated and based on partial internal model (PIM) output as at 31 December 2020
                                                                                                                                                                                                                          16
               4. Solvency ratio including Tier 2 debt callable in 2022 and after 2021 interim dividend. Figures estimated and based on partial internal model (PIM) output as at 30 June 2021
               See notes on slide 30 and glossary of terms on slides 50 to 53
Financial targets and outlook

                 2021 outlook                                                                                       Medium term targets

  • Prior year reserve releases: Expected to be
    between 2019 and 2020 levels
                                                                                                                                            Return on
                                                                                                                         Combined
  • Operating expenses: We expect to deliver                                                                                              tangible equity
                                                                                   Expense ratio:                      operating ratio:
Leveraging our customer focus
with new technology

                                Penny James
                                   CEO
Strategic overview: Optimising new technology capability
through Agile ways of working
                                                             Our plans land us
                                                               (about) here
                                 We are (about)
                                  here now

                                                                      Business growth
                                                                     More competitive and
                                                                    agile business to deliver
                                         Business                   the full potential of the
                                      transformation                  Group enabling it to
                                                                     take market share and
            Technology                  Targeting margin            innovate faster to grow
          transformation                 improvement in
                                    portfolio as full benefits
          Required significant       of technology realised
          capital expenditure

                                                                                                19
Strategic overview: Our core strengths combined with new
technology are designed to deliver sustainable growth
                                               Forefront of car tech, new product
                                               development and race to net zero

                                                          Innovating
                                                          for success
           Enhanced capabilities                                                           Core strengths

     Increasing automation,
                                   Efficient                                   Customer   Strong brands, unique
      digitalisation and self
                                   cost base                                     focus    propositions, high NPS
               serve
                                                          Data,
                                                       technology
                                                        and Agile
                                                         ways of
                                                         working

     Leveraging scale and data
                                                                                          Leading indemnity
        in new pricing and               Pricing                            Claims        control and repair
       underwriting systems           sophistication                       expertise
                                                                                             capabilities

                                                                                                                   20
Evidence of the flywheel working: Commercial growth

                  Broker and affinity GWP £m                                                         Direct own brands GWP £m

 Re-platforming complex products to enable better pricing and risk selection       Established modularised product offering built using fully Agile methodology

                 4.1% CAGR                           H1 growth 16.4%                               8.8% CAGR                            H1 growth 15.5%
                            £405m
 £373m         £380m                                                                                            £163m
                                                                                                                        Churchill:
                                                                                                 £149m            16
                                                                                   £138m                                64.6%
                                                                                                    10                  SME:
                                     Regional:                                        6                           23
                              233                                                                   21                  11.3%
                                     2.5%                                             19
   222          228                                              £245m
                                                      £211m                                                       52    Van:                         £91m
                                                                                     48             49                  4.4%              £79m         12      66.9%
                                                                   144     17.3%                                                            7          14
                                                        123                                                                                 12                 23.5%
                                     eTrade:
                              102    8.6%                                                                                                              29      9.5%
   87            86                                                                                                                        26
                                                                   60                 65            69            72    Landlord:
                                                        49                 21.7%
                                     Speciality:                                                                        5.0%               34          36      6.2%
   65            66            69                                          6.7%
                                     3.5%               39          41

  2018          2019          2020                    H1 2020    H1 2021             2018          2019          2020                    H1 2020     H1 2021

                                                                                                                                                                      21
Evidence of the flywheel working: Leading customer service and
claims capability delivering new partnership

   We hosted a claims webinar in which we                               We’ve announced a 10 year partnership with
        demonstrated our strengths                                              Motability Operations Ltd
    https://www.directlinegroup.co.uk/en/investors/dlg-claims-
    insight-webinar.html

                                                                                Supporting more than 600,000 customers

                                                                                Growing our Motor book by c. 15% to over 4.5 million

                                                                                Gross written premiums of c. £500 million per annum

                                                                                80% of risk is reinsured back to Motability Operations

                                             Strong alignment with our vision and purpose

                                                                                                                                         22
Evidence of our enhanced technical capabilities: Spotlight on
new Motor platform

                                                                                            New front-end system and          Modular cloud based
                    New back-end systems
                                                                                          comprehensive digital offering        infrastructure

                                 Data Centres

                         Radar Live
                A pricing engine providing
             quotes, policy, renewals capability

PolicyCenter
         PolicyCenter             ClaimCenter
                                          ClaimCenter BillingCenter
                                                        BillingCenter
       PolicyCenter                 ClaimCenter
                                       v9
                                                                 BillingCenter
     v9       v9                               v9             v9
All policies and    v9                    v9                  v9       v9
              All policies and   Upgrade for claims for claimsHandles billing
                                           Upgrade                     Handles billing
    products All policies
                  productsand      Upgrade
                                     handlersfor claims      Handles billing
                                                 handlers     managementmanagement       Send SMS
               products                handlers               management
                                                                                           Send
                                                                                          Initiate
                                                                                           Email
                                                                                           ID&V

                                                                        Architecture enables changes to be deployed at pace

                                                                                                                                                    23
Evidence of our enhanced technical capabilities: New Motor
platform

 Greater customer choice and more                     Improved pricing sophistication
                                                                                                       Innovate for sustainability
     efficient sales and service                               and agility

   Greater product choice with product tiering         Faster deployment of pricing changes with      Capability for greater speed to market for
   across all 3 brands                                 no loss of fidelity between models             new products and features

   Customers can move seamlessly between               Ability to integrate more granular data both   More efficient on-boarding of new partners
   channels                                            internal and external

                                                                                                      Platform can easily be scaled for M&A
   My Account portal enables customers to self         Greater underwriting sophistication through
   serve and store policy documents                    segmentation, granularity and time to
                                                       update
                                                                                                      Opportunity to apply machine learning to
   Full end to end digital processing of sales,                                                       pricing
   service and renewals                                Improved fraud detection capability

   High NPS supports                          Supporting a 20%
                                                                               Targeted improvement              Drive opportunities for
    strong retention                         reduction in cost to
                                                                                   in CY loss ratio                     growth
                                                    serve

                                                                                                                                                   24
Strategic overview: Innovating for sustainable success

   Consumer digitalisation              Product personalisation               Car technology                    Force for good

  • Darwin has grown to 90k+            • Direct Line is uniquely       • Largest insurer owned repair    • Signed up to Race to Zero
    policies                              positioned to offer             network; 22 sites                 campaign
                                          increasingly personalised
  • Significant progress in the           experience                    • Developing a roadmap for        • Active in forums such as ABI
    digitalisation of claims                                              electrification of UK fleets      Climate Change Roadmap
    journeys                            • New Direct Line products in
                                          train for H2                  • Training our technicians in     • ESG investor insight session
  • New Motor platform provides                                           ADAS calibration and electric     planned in 2022
    greater digitalisation and self                                       vehicle repairs
    serve
                                                                                                             Seeking to lead the
      New Motor claims                      Cycling insurance                In-house car tech              charge on the climate
       resolution hub                           launched                      training centre                  change agenda

                                  A win for society and strong alignment with our vision and purpose

                                                                                                                                           25
Summary: A Group with real momentum

                Our diversified portfolio has delivered strong results in H1 2021
 We want to
 create a
 world
 where
                Technology transformation now largely complete and the
 insurance      benefits are beginning to come through
 is personal,
 inclusive
 and a force
                We are a Group with real momentum and confidence, and we
 for good.
                continue to innovate to drive future growth

                                                                                    26
APPENDIX
           APPENDIX

                      27
Upcoming events                            Contacts

                                                             Paul Smith
August         Virtual roadshow
                                                       Director of Investor Relations

                                                    Paul.R.Smith@directlinegroup.co.uk
               Barclays Global Financial Services
14 September   Conference (Virtual)
                                                            +44 (0) 7795 811263

22 September   Bank of America 26th Annual                 Louise Calver
               Financials CEO Conference
                                                        Investor Relations Manager

                                                    Louise.Calver@directlinegroup.co.uk
9 November     Third quarter trading update
                                                            +44 (0) 1651 832877

22 November    JP Morgan Best of British Seminar             Jen Ramsey
                                                      Investor Relations Co-ordinator

7 December     Berenberg European Conference        Jen.Ramsey@directlinegroup.co.uk
                                                           +44 (0) 1651 831451

                                                                                          28
Strategic overview: Technology transformation largely complete

                                                            Improved sales and service
                                                             Greater pricing accuracy
                                                            Brilliant claims experience

             Motor              Home               Motor             Rescue            Micro & SME        Commercial               Travel
          Privilege new                           New brand                                Multiple           Digital               Digital
                               PCW hub                             Claims system
2019     business live on                       launched on 2                              product           platform              platform
                               launched                                 built
          new platform                              PCWs                                  launches          launched              launched
            Privilege                                              Claims system          All products
                               API &            Live on all four                                             Three                Migration
2020      renewals and                                               live, policy       live, migration
                            PCW capability        main PCWs                                               products live           complete
            migration                                               system built           underway
                                                 Continue to
2021 -    Churchill and        Build new                           Launch policy          Complete        Final product
                                                 enhance and
2022       Direct Line         platform                              platform             migration         launches
                                                    grow
           New pricing        New pricing                                                                                      New end to end
                                               New brand, new        New set of                           New pricing and      digital platform
         engine, customer   engine, customer                         customer            New digital
                                                 pricing, new                                              underwriting           for Travel
         service and back   service and back                          systems             platform
                                               operating model                                                 tools               partners
            office tools       office tools
                                                                                   New general ledger and claims
                                               Finance transformation                                                     IFRS17 go live 2022
                                                                                    payment system rolled out
                                                                                    New Counter-fraud operating
                                               Claims transformation                                                    Further digitalisation
                                                                                             system
                                                                                     Telephony and mainframe            End user computing
                                           Technology transformation
                                                                                            migration                        migration

                                                                                                                                                  29
Notes to financial disclosures

 1.   Direct own brands include in-force policies for Home and Motor under the Direct Line, Churchill, Darwin and
      Privilege brands, Rescue policies under the Green Flag brand and Commercial policies under the Direct Line for
      Business and Churchill brands.

 2.   The Group’s dividend policy includes an expectation that generally one-third of the regular annual dividend will
      be paid in the third quarter as an interim dividend and two-thirds will be paid as a final dividend in the second
      quarter of the following year.

 3.   See glossary of terms on pages 50 to 53

                                                                                                                          30
Motor
                                                                                 H1 2020   H1 2021
        In-force policies (000s)                                                  4,091    3,975
          Own brand in-force policies (000s)                                      3,972     3,867
          Partnerships in-force policies (000s)                                    119      108

        Gross written premium £m                                                  805       756
        Net earned premium £m                                                     740       728

        Loss ratio – current year                                                 65.5%    66.9%
        Loss ratio – prior years                                                 (11.2%)   (13.8%)
        Loss ratio                                                                54.3%     53.1%
        Commission ratio                                                          2.9%      3.1%
        Expense ratio                                                             24.7%    25.6%
        Combined operating ratio                                                  81.9%    81.8%

        Underwriting profit £m                                                     134       132
        Of which prior year releases £m                                            83        101

        Instalment and other income £m                                             59        53
        Investment return £m                                                       27        46
        Operating profit £m                                                        221       231

                                                                                                     31
                See notes on slide 30 and glossary of terms on slides 50 to 53
Home
                                                                                H1 2020   H1 2021

       In-force policies (000s)                                                  2,596    2,677
         Own brand in-force policies (000s)                                      1,782     1,880
         Partnerships in-force policies (000s)                                    814      797

       Gross written premium £m                                                  276       278
       Net earned premium £m                                                     278       274

       Loss ratio – current year attritional                                     53.0%    52.3%
       Loss ratio – prior years                                                 (0.9%)    (6.4%)
       Loss ratio – major weather events                                         6.4%      1.1%
       Loss ratio                                                                58.5%    47.0%
       Commission ratio                                                          6.8%      5.8%
       Expense ratio                                                             27.1%    26.2%
       Combined operating ratio                                                 92.4%     79.0%
                                                                                                    Normal weather assumed to be £49m in 2021
       COR Normalised for weather                                               94.2%     86.2%     (2020: £46m)

       Underwriting profit £m                                                     21        58
       Of which prior year releases £m                                            3         18

       Instalment and other income £m                                             10        10
       Investment return £m                                                       4         7
       Operating profit £m                                                        35        75

                                                                                                                                                32
               See notes on slide 30 and glossary of terms on slides 50 to 53
Rescue and other personal lines
   Rescue and other personal lines                                      H1 2020           H1 2021
                                                                                                    Rescue                       H1 2020   H1 2021
   In-force policies (000s)                                               7,161           6,969
                                                                                                    In-force policies (000s)      3,380     3,346
      Rescue (000s)                                                       3,380            3,346
      Travel (000s)                                                       3,567            3,324    Of which Green Flag (000s)    1,070     1,134

      Pet (000s)                                                            152             141
      Other personal lines (000s)                                           62              58      Gross written premium £m       81        82

                                                                                                    Combined operating ratio     76.5%     71.0%
   Gross written premium £m                                                210              187
   Net earned premium £m                                                    213             187
                                                                                                    Operating profit £m            24        29

   Loss ratio – current year                                             86.0%            60.7%
   Loss ratio – prior years                                               (1.9%)           (1.3%)
   Loss ratio                                                             84.1%           59.4%
   Commission ratio                                                       3.0%             8.2%
   Expense ratio                                                          24.2%           25.4%
   Combined operating ratio                                               111.3%          93.0%

   Underwriting profit / (loss) £m                                         (24)             13
   Of which prior year releases £m                                           4               2

   Operating profit £m                                                     (16)             21

                                                                                                                                                     33
                         See notes on slide 30 and glossary of terms on slides 50 to 53
Commercial
                                                                                H1 2020   H1 2021
      In-force policies (000s)                                                   785       850
        Own brands (000s)                                                        546       584
        NIG and other (000s)                                                     239       266

      Gross written premium £m                                                   289       336
      Net earned premium £m                                                      243       266

      Loss ratio – current year attritional                                     60.2%      61.1%
      Loss ratio – prior years                                                  (13.7%)   (12.1%)
      Loss ratio – major weather events                                          5.2%       n/a
      Loss ratio                                                                 51.7%    49.0%
                                                                                                    Normal weather assumed to be £20m in 2021
      Commission ratio                                                           17.7%     19.8%    (2020: £18m)
      Expense ratio                                                              25.5%     21.4%
      Combined operating ratio                                                  94.9%     90.2%
      COR Normalised for weather                                                93.4%     94.0%

      Underwriting profit £m                                                      12        26
      Of which prior year releases £m                                             33        32

      Instalment and other income £m                                               5        4
      Investment return £m                                                        8         14
      Operating profit £m                                                         25        44

                                                                                                                                                34
               See notes on slide 30 and glossary of terms on slides 50 to 53
Instalment and other operating income

 £m                                                                                     H1 2020   H1 2021

 Instalment income                                                                        55        49

 Other operating income:
                                                                                                            • Reduction in H1 2021 due to
      Revenue from vehicle recovery and repair services                                   11        10        impact of Covid-19 on new
                                                                                                              business volumes and claims
      Vehicle replacement and referral income                                             6         5
                                                                                                              volumes
      Legal services income                                                               5         4

      Other income                                                                        3         4

 Other operating income                                                                   25        23

 Total instalment and other operating income                                              80        72

                                                                                                                                            35
                       See notes on slide 30 and glossary of terms on slides 50 to 53
Current year contribution to operating profit

                  Normalised operating profit1                                                                       2020 normalised
                                                                                                                       H1 2021       operating
                                                                                                                               normalised      profitprofit
                                                                                                                                          operating
                                                                                                                                                      1     1

                                                                                                                                £370m
                                                                                                                                                                                                          A / B = 55%
                                                                                                                                                                    £340m
                                                                                                                                                    £30m

                                                                                                                                                                                                           £187m

                Prior year contribution              Current year contribution                                                                                                         £153m

                                                                                                                                                                      B                                      A
        70%                64%                61%                35%                50%
                                                                                                                            H1 2021 operating   Adjustment for     Normalised         Prior year      H1 2021 normalised
                                                                                                                                  profit        normal weather   operating profit                        current year
                                                                                                                                                                                                       operating profit

                                                                 65%                                                    2019 normalised
                                                                                                                         H1 2020        operating
                                                                                                                                 normalised       profit
                                                                                                                                            operating    1
                                                                                                                                                       profit 1

                                                                                    50%                                         £265m                                 £264m                               A / B = 53%
                           36%                39%                                                                                                    £1m

        30%
                                                                                                                                                                                                               £141m

                                                                                                                                                                                          £123m
        2017               2018               2019               2020           2021 target

                                                                                                                                                                        B                                        A

                                                                                                                            H1 2020 operating   Adjustment for       Normalised          Prior year       H1 2020 normalised
                                                                                                                                  profit        normal weather     operating profit                           current year
                                                                                                                                                                                                           operating profit

                                                                                                                                                                                                                               36
               1. Group operating profit normalised for weather, and Ogden rate changes, excludes restructuring and one-off costs
               See notes on slide 30 and glossary of terms on slides 50 to 53
Reinsurance
  Motor Excess of Loss (unlimited)                                                                                     Property catastrophe

   Accident   Deductible                                                                                                 Accident                             Deductible
     year        £m                                                                                                                         Limit £m
                                                                                                                           year                                  £m
     2021          11             • Cover renewed on 1 January 2021
                                                                                                                                                                           • Cover renewed on 1
                                                                                                                           2021/22              1,150            150         July 2021 for 12
     2020           1             • Retained £1m deductible (indexed) with
                                    partial placement:                                                                                                                       months
     2019           1                                                                                                                           1,125            130
                                            • Additional 25% retained in each                                              2020/21                                         • Cover has one full
                                              layer up to £10m                                                                                                               reinstatement for all
     2018          12
                                                                                                                                                                             programme and one
                                            • £37.5m aggregate deductible for                                              2019/20             c. 1,132         c. 132       additional
     2017           1
                                              layers above £10m                                                                                                              reinstatement up to
     2016           1                                                                                                                                                        £530m
                                  • Cover is unlimited in size and has an                                                  2018/19            c. 1,205          c. 139
                                    unlimited amount of cover                                                                                                              • Placed with a panel of
     2015           1               reinstatements                                                                                                                           reinsurers who are all
                                                                                                                           2017/18            c. 1,275          c. 150       at least ‘A-’ rated
     2014           1             • Placed on an uncapitalised basis

     2013          3              • Placed with a panel of reinsurers who
                                    are at least ‘A+’ rated                                                                2016/18              1,250           c. 150
     2012          3

     2011          3                                                                                                       2015/16              1,350           c. 150

     2010         10
                                                                                                                           2014/15             1,400            c. 150

                                                                                                                                                                                                     37
                1. Partial placement on all layers up to £10m. 25% retained in layers £10m have an additional £37.5m aggregate deductible
                2. Partial placement on lower layers. For 2018 90% of the first layer (£2m excess £1m) was placed with 10% retained
Balance sheet

  Group balance sheet £m                                   Dec-18               Dec-19     Dec-20   Jun-21

  Goodwill and other intangible assets                        567                  703      787      808

  Financial investments and cash                             6,214                5,914     6,194   5,977

  Reinsurance assets                                         1,209                1,251     1,129    1,111

  Other assets                                               1,545                1,566     1,512   1,414

  Total Assets                                               9,535               9,434     9,622    9,310

  Unearned premium reserve                                   1,506                1,506     1,497   1,487

  Insurance liabilities                                     4,006                3,820      3,617   3,557

  Other liabilities                                           1,119                1,118    1,462   1,313

  Total Liabilities                                          6,631               6,444     6,576    6,357

  Shareholders’ equity                                       2,558               2,644     2,700    2,606

  Tier 1 notes                                                346                  346      346      347

  Total Equity                                              2,904                2,990     3,046    2,953

                                                                                                             38
                      See notes on slide 310and glossary of terms on slides 50 to 53
Assets under management

                                                    Group assets under management, £m

           6,709
                                                 6,164                                                     6,150
                                                                            5,943                                               5,870

                          3,145
                                                               2,901
                                                                                       2,670                            2,592           2,514

                31-Dec-17                            31-Dec-18                31-Dec-19                      31-Dec-20            30-Jun-21

                                                             Assets under management           Net claims liabilities

                                                                                                                                                39
         See notes on slide 30 and glossary of terms on slides 50 to 53
Investment portfolio
                                                                                     UK               UK                          Total Group
                                                                                                                   Total Group
                                                                                 Insurance         Insurance                     interest rate
      As at 30 June 2021                                                                                             income
                                                                                   target           current                        duration
                                                                                                                      yield1
                                                                                 allocation         holding                         (years)

      Investment grade (incl private placements)                                    69.0%            67.5%              1.9%          2.8

      High yield                                                                     6.0%             6.8%              5.1%          1.9

      Credit                                                                        75.0%            74.3%             2.2%           2.7

      Sovereign                                                                      3.0%             0.2%              0.1%          1.7

      Total debt securities                                                         78.0%            74.5%             2.2%           2.7

      Infrastructure debt                                                           4.0%              4.5%              1.7%          0.2

      Commercial real estate loans                                                   6.5%             3.8%             2.8%           0.1

      Investment property                                                            5.5%             5.2%             4.7%            -

      Cash and cash equivalents                                                      6.0%             12.0%            0.0%            -

      Total                                                                        100.0%            100.0%            2.0%           2.0

                                                 3.1% of total debt securities rated as ‘AAA’ and 75.2% rated as ‘AA’ or ‘A’

                                                                                                                                                 40
              1. Gross investment income yield
              See notes on slide 30 and glossary of terms on slides 50 to 53
Movement in surplus capital

                                                                            Surplus in
                                                                           Movement capital
                                                                                       capitalwalk
                                                                                              surplus1
                                                                                                                      1

                                                                                                                                                                         Tier 2
                            £0.29bn                                                                                                                                      debt
                                                                                                                          £1.41bn                                       callable
                                                      (£0.02bn)                 (£0.03bn)                                                              £1.31m
     £1.22bn                                                                                              (£0.05bn)                                                     in 2022
                                                                                                                                    (£0.10bn)          £0.25bn

       191%                                                                                                                                             177%
                                                                                                                                                      excluding
                                                                                                                                                       T2 debt

 Capital surplus at 1 H1 2021 operating Market movements Change in capital Capital expenditure Capital surplus at                   2021 interim   Capital surplus at
   January 2021       capital generation                   requirement                         30 June 2021 pre                      dividend        30 June 2021
                                                                                                  dividends

                                                         Capital expenditure expected to be around £120m in 2021

               1. Figures estimated and based on partial internal model (PIM) output as at 30 June 2021                                                                            41
               See notes on slide 30 and glossary of terms on slides 50 to 53
IFRS to Solvency II bridge

                            Reconciliation of IFRS shareholders’ equity to solvency II own funds1

        £2.61bn                                                                                                                                                        £0.15bn        £2.68bn
                                                                                                                                                     £0.52bn

                                                                                                                                  £0.37bn
                                               £0.08bn
                         (£0.81bn)                                                                             £1.64bn
                                                                   (£0.09bn)
                                                                                         (£0.15bn)

         Total         Goodwill and           Change in         Other asset and Forseeable                   Tier 1 capital -   Tier 1 capital -    Tier 2 capital    Tier 3 capital Total own funds
     shareholders'      intangibles          valuation of          liability    dividend and                  unrestricted        restricted       (subordinated     (deferred tax)   as at 30 June
     equity as at 30                          technical          adjustments share buyback                                                              debt)                              2021
       June 2021                              provisions

                  1. Figures estimated and based on partial internal model (PIM) output as at 30 June 2021                                                                                             42
                  See notes on slide 30 and glossary of terms on slides 50 to 53
Solvency scenario and sensitivity analysis1

                                                                                                                                                                 140% - 180%
                                                                                                                                                                 Risk appetite
                                                                                                                                                                     range
   100 bps decrease in interest rates with no change in
                                                                                                                                                                                            193%
                                  the PPO discount rate

                     100 bps increase in credit spreads2                                                                                                                              186%
      Change in reserving basis for PPOs to use a real
                           discount rate of minus 1%3                                                                                                                                 186%
          One-off catastrophe loss based on extensive
                         flooding of the River Thames                                                                                                                                 186%
       One-off catastrophe loss equivalent to the 1990
                                         storm ‘Daria’                                                                                                                                186%
    Motor small BI deterioration equivalent to accident
                                  years 2008 and 2009                                                                                                                                    189%

                     30 June 2021 solvency capital ratio                                                                                                                                      195%

                                                                         40%             60%             80%            100%            120%            140%            160%            180%          200%

                   1. 2021 figures exclude from own funds the value of the £250 million Tier 2 subordinated debt which has a first call date of 27 April 2022.
                   2. Only includes the impact on AFS assets (excludes illiquid assets such as infrastructure debt) and assumes no change to the SCR                                                         43
                   3. The PPO real discount rate used in an actuarial judgement which is reviewed annually based on the economic outlook for wage inflation relative to the PRA discount rate curve
Book value and TNAV

                       Movement in tangible net asset value

   141.5p                                                                                                           134.6p

              £204m                                           £2,056m
                                                                                                                                                            30 June   30 June
  £1,913m                                                                                                         £1,799m
                              £38m                                                                                                                           2020       2021
                                               £22m                               £8m
                                                                                         £199m
                                                                                                       £50m                      Net asset value per
                                                                                                                                                             199.7     195.1
                                                                                                                                 share (pence)

                               +7.5%                                                                                             Tangible net asset value
                                                                                                                                                             141.5     134.6
                                                                                                                                 per share (pence)

  31 Dec 2020 Net income Movement in            Other        30 June pre Tier 1 coupon   2020 final    Buyback    30 June 2021
                                                                                                                                  Total unrealised AFS reserves of £45.5m
                            AFS                                 capital       paid       dividend     completed                         (net of tax) as at 30 June 2021
                                                             distributions

                                                                                                                                                                               44
                     See notes on slide 30 and glossary of terms on slides 50 to 53
Return on tangible equity and earnings per share calculations
         Return on tangible equity (RoTE)                                                                   Basic earnings per share (EPS)

                                                                      H1 2020          H1 2021                                                 H1 2020     H1 2021
                                                                        £m              £m                                                       £m         £m

  Profit before tax                                                     236.4           261.3
                                                                                                 Profit after tax                                192.6      203.8

  Add back: Restructuring and one-off costs                              15.0           91.5
                                                                                                 Coupon payments in respect of Tier 1 notes      (8.3)      (8.3)
  Coupon payments in respect of Tier 1 notes                             (8.3)          (8.3)
                                                                                                 Profit for the calculation of EPS              184.3       195.5
  Adjusted profit before tax                                            243.1          344.5
                                                                                                 Weighted average number of shares
                                                                                                                                                1,355.6    1,345.9
  Tax charge (using 2020 and 2021 UK standard                                                    (millions)
                                                                        (46.2)          (65.5)
  tax rate of 19%)
                                                                                                 Basic earnings per share (pence)                13.6       14.5
  Adjusted profit after tax                                             196.9          279.0

  Opening shareholders tangible equity                                  1,941.1        1,912.9   On 8 March 2021, the Direct Line Group plc announced a share
                                                                                                 buyback of Ordinary Shares for an aggregate purchase price of
  Closing shareholders’ tangible equity                                2,015.3         1,798.7   up to £100 million with an initial tranche of £50 million to be
                                                                                                 completed by 30 June 2021. The Group has repurchased
  Average shareholders’ tangible equity                               1,978.2          1,855.8
                                                                                                 16,623,215 Ordinary Shares for an aggregate consideration of
  RoTE annualised                                                      19.9%           30.1%     £50,311,788.

                                                                                                                                                                     45
                      See notes on slide 30 and glossary of terms on slides 50 to 53
H1 2021 segmental results
                                                                                                          Rescue and other
(£m)                                                                                  Motor     Home                         Commercial   Total Group
                                                                                                           personal lines
GWP                                                                                    755.6    278.3          186.5            336.1       1,556.5

Net earned premium                                                                     727.9    274.3          187.2           266.2        1,455.6

Net insurance claims                                                                  (386.6)   (128.9)        (111.2)         (130.4)      (757.1)

Commission expenses                                                                    (22.7)   (16.0)         (15.3)          (52.6)       (106.6)

Operating expenses                                                                    (186.2)   (71.7)         (47.6)           (57.1)      (362.6)

Underwriting profit / (loss)                                                           132.4     57.7           13.1            26.1         229.3

Investment return                                                                       45.6     6.9            2.0             13.9         68.4

Instalment and other operating income                                                   53.1     10.1           5.4              3.6         72.2

Operating profit / (loss)                                                              231.1     74.7           20.5            43.6         369.9

Restructuring and one-off costs                                                           -        -             -                -          (91.5)

Finance costs                                                                             -        -             -                -          (17.1)

Profit before tax                                                                         -        -             -                -          261.3

Tax                                                                                       -        -             -                -          (57.5)

Profit after tax                                                                          -        -             -                -          203.8

Loss ratio – current year                                                             66.9%     53.4%          60.7%            61.1%       62.5%

Loss ratio – prior year                                                               (13.8%)   (6.4%)         (1.3%)          (12.1%)      (10.5%)

Commission ratio                                                                        3.1%    5.8%           8.2%            19.8%         7.3%

Expense ratio                                                                          25.6%    26.2%          25.4%           21.4%        24.9%

Combined operating ratio                                                               81.8%    79.0%          93.0%           90.2%        84.2%

Combined operating ratio normalised for weather                                         n/a     86.2%           n/a            94.0%        86.3%

                                                                                                                                                        46
                               See notes on slide 30 and glossary of terms on slides 50 to 53
H1 2020 segmental results
                                                                                                          Rescue and other
£m                                                                                    Motor     Home                         Commercial   Total Group
                                                                                                           personal lines
GWP                                                                                    805.3    276.1           210.1          289.3        1,580.8

Net earned premium                                                                     740.4    277.8          213.2           243.0        1,474.4

Net insurance claims                                                                  (401.8)   (162.2)        (179.3)         (125.7)      (869.0)

Commission expenses                                                                    (21.4)   (19.0)          (6.4)          (43.0)       (89.8)

Operating expenses                                                                    (183.2)   (75.4)         (51.5)           (61.9)      (372.0)

Underwriting profit / (loss)                                                           134.0     21.2          (24.0)           12.4         143.6

Investment return                                                                       27.4     4.3             1.5             8.1         41.3

Instalment and other operating income                                                   59.1     9.8            6.3              4.8         80.0

Operating profit / (loss)                                                              220.5     35.3          (16.2)           25.3        264.9

Restructuring and one-off costs                                                           -        -              -               -          (15.0)

Finance costs                                                                             -        -              -               -          (13.5)

Profit before tax                                                                         -        -              -               -         236.4

Tax                                                                                       -        -              -               -         (43.8)

Profit after tax                                                                          -        -              -               -          192.6

Loss ratio – current year                                                              65.5%    59.4%          86.0%           65.4%        67.4%

Loss ratio – prior year                                                               (11.2%)   (0.9%)         (1.9%)          (13.7%)      (8.4%)

Commission ratio                                                                       2.9%     6.8%           3.0%            17.7%         6.1%

Expense ratio                                                                          24.7%    27.1%          24.2%           25.5%        25.2%

Combined operating ratio                                                               81.9%    92.4%          111.3%          94.9%        90.3%

Combined operating ratio normalised for weather                                         n/a     94.2%           n/a            93.4%        90.4%

                                                                                                                                                        47
                               See notes on slide 30 and glossary of terms on slides 50 to 53
2020 segmental results
                                                                                                            Rescue and other
(£m)                                                                                    Motor     Home                         Commercial   Total Group
                                                                                                             personal lines
GWP                                                                                     1,616.9   577.9          417.8           567.8        3,180.4

Net earned premium                                                                     1,484.8    555.8          422.9           497.0        2,960.5

Net insurance claims                                                                    (888.1)   (309.1)        (261.1)         (255.3)      (1,713.6)

Commission expenses                                                                     (47.4)    (45.0)         (69.4)          (92.9)       (254.7)

Operating expenses                                                                      (367.1)   (130.0)        (100.9)         (126.4)      (724.4)

Underwriting profit / (loss)                                                             182.2     71.7           (8.5)           22.4         267.8

Investment return                                                                        62.8      10.3           3.4             18.6          95.1

Instalment and other operating income                                                    118.5     19.4           11.9            9.4          159.2

Operating profit / (loss)                                                               363.5     101.4           6.8             50.4         522.1

Restructuring and one-off costs                                                            -         -              -               -          (39.4)

Finance costs                                                                              -         -              -               -          (31.3)

Profit before tax                                                                          -         -              -               -          451.4

Tax                                                                                        -         -              -               -          (84.2)

Profit after tax                                                                           -         -              -               -          367.2

Loss ratio – current year                                                               66.6%     57.5%          63.0%           62.8%        63.8%

Loss ratio – prior year                                                                 (6.8%)    (1.9%)         (1.3%)          (11.4%)      (5.9%)

Commission ratio                                                                         3.2%      8.1%          16.4%           18.7%         8.6%

Expense ratio                                                                           24.7%     23.4%          23.9%           25.4%        24.5%

Combined operating ratio                                                                87.7%     87.1%         102.0%           95.5%         91.0%

Combined operating ratio normalised for weather                                          n/a      90.3%           n/a            95.9%         91.7%

                               See notes on slide 30 and glossary of terms on slides 50 to 53                                                             48
2019 segmental results
                                                                                                            Rescue and other
(£m)                                                                                   Motor      Home                         Commercial   Total Group
                                                                                                             personal lines
GWP                                                                                    1,651.6    586.6          436.0           528.9        3,203.1

Net earned premium                                                                     1,507.7    573.6          425.2           478.4        2,984.9

Net insurance claims                                                                  (1,043.3)   (268.4)       (284.4)          (251.5)     (1,847.6)

Commission expenses                                                                     (39.9)    (55.7)         (27.2)          (88.7)       (211.5)

Operating expenses                                                                     (345.6)    (136.7)        (94.0)          (117.4)      (693.7)

Underwriting profit / (loss)                                                             78.9      112.8          19.6            20.8         232.1

Investment return                                                                        88.6      16.7           5.6             23.7         134.6

Instalment and other operating income                                                    135.1     21.1           13.9            10.1         180.2

Operating profit / (loss)                                                               302.6     150.6           39.1            54.6        546.9

Restructuring and one-off costs                                                            -         -             -                -          (11.2)

Finance costs                                                                              -         -             -                -         (26.0)

Profit before tax                                                                          -         -             -                -          509.7

Tax                                                                                        -         -             -                -         (89.8)

Profit after tax                                                                           -         -             -                -          419.9

Loss ratio – current year                                                               81.2%     54.0%          68.7%           66.3%         71.8%

Loss ratio – prior year                                                                (11.9%)    (7.2%)         (1.8%)          (13.6%)      (9.9%)

Commission ratio                                                                        2.6%       9.7%          6.4%            18.5%         7.1%

Expense ratio                                                                           22.9%     23.8%          22.1%           24.5%        23.2%

Combined operating ratio                                                               94.8%      80.3%          95.4%           95.7%        92.2%

Combined operating ratio normalised for weather                                          n/a      86.9%           n/a            99.2%        93.5%

                               See notes on slide 30 and glossary of terms on slides 50 to 53                                                             49
Glossary of terms
             Term                                                                            Definition

Actuarial best estimate      The probability-weighted average of all future claims and cost scenarios. It is calculated using historical data, actuarial methods and
(“ABE”)                      judgement. A best estimate of reserves will therefore normally include no margin for optimism or, conversely, caution.

Assets under
                             This represents all assets management or administered by or on behalf of the Group, including those assets managed by third parties.
management (“AUM”)

Available-for-sale (“AFS”)   Available-for-sale investments are non-derivative financial assets that designated as such, or are not classified as loans and receivables,
Investment                   held to maturity, or financial assets at fair value through profit or loss.

Average written
                             The total written premium at inception divided by the number of policies.
premium
                             The funds invested in the Group, including funds invested by shareholders and Tier 1 notes. In addition, subordinated loan capital in the
Capital
                             Group’s balance sheet is classified as Tier 2 capital for Solvency II purposes.

Claims frequency             The number of claims divided by the number of policies per year.

                             The sum of the loss, commission and expense ratios. The ratio measures the amount of claims costs, commission and operating
Combined operating ratio     expenses, compared to net earned premium generated. A ratio of less than 100% indicates profitable underwriting. Normalised
                             combined operating ratio adjusts loss and commission ratios for weather and changes to the Ogden discount rate.

Commission expenses          Payments to brokers, partners and price comparison websites for generating business.

Commission ratio             The ratio of commission expense divided by net earned premium.

Company                      Direct Line Insurance Group plc.

Current-year attritional     The loss ratio for the current accident year, excluding the movement of claims reserves relating to previous accident years and claims
loss ratio                   relating to major weather events.
Current-year combined
                             This is calculated using the combined operating ratio less movement in prior-year reserves.
operating ratio

                                                                                                                                                                           50
Glossary of terms
                    Term                                                                           Definition

Current-year operating profit         This is calculated by total operating profit less movement in prior-year reserves.

                                      Direct own brands include Home and Motor under the Direct Line, Churchill, Darwin and Privilege brands, Rescue under the
Direct own brands
                                      Green Flag brand and Commercial under the Direct Line for Business and Churchill brands.
                                      The amount of the Group’s profit after deduction of the Tier 1 coupon payments allocated to each Ordinary Share of the
Earnings per share
                                      Company.

Expense ratio                         The ratio of operating expenses divided by net earned premium.

Finance costs                         The cost of servicing the Group’s external borrowings and includes the interest on ROU assets.

Financial Conduct Authority (“FCA”)   An independent body responsible for regulating the UK's financial services industry.

Financial leverage ratio              Tier 1 notes and financial debt (subordinated Tier 2 notes) as a percentage of total capital employed.

Gross written premium                 The total premiums from contracts that were incepted during the period.

Group                                 Direct Line Insurance Group plc and its subsidiaries.

In-force policies                     The number of policies on a given date that are active and against which the Group will pay, following a valid insurance claim.

                                      This comprises insurance claims reserves and claims handling provision, which the Group maintains to meet current and future
Insurance liabilities
                                      claims.
International Accounting Standards    A not-for-profit public interest organisation that is overseen by a monitoring board of public authorities. It develops IFRS
Board (“IASB”)                        standards that aim to make worldwide markets transparent, accountable and efficient.
                                      The income earned from the investment portfolio, recognised through the income statement during the period (excluding
Investment income yield               unrealised and realised gains and losses, impairments and fair value adjustments) divided by the average assets under
                                      management (“AUM”). The average AUM derives from the period’s opening and closing balances for the total Group.
                                      The investment return earned from the investment portfolio, including unrealised and realised gains and losses, impairments
Investment return
                                      and fair value adjustments.

                                                                                                                                                                        51
Glossary of terms
                   Term                                                                          Definition

Investment return yield           The return divided by the average AUM. The average AUM derives from the period’s opening and closing balances.

Loss ratio                        Net insurance claims divided by net earned premium.

Management’s best estimate        These reserves are based on management’s best estimate, which includes a prudence margin that exceeds the internal ABE.

                                  The difference between the Group’s total assets and total liabilities, calculated by subtracting total liabilities (including Tier 1
Net asset value
                                  notes) from total assets.
                                  The element of gross earned premium less reinsurance premium ceded for the period where insurance cover has already been
Net earned premium
                                  provided.
                                  The cost of claims incurred in the period less any claims costs recovered under reinsurance contracts. It includes claims
Net insurance claims
                                  payments and movements in claims reserves.

Net investment income yield       This is calculated in the same way as investment income yield but includes the cost of hedging.

Ogden discount rate               The discount rate set by the Lord Chancellor and used by courts to calculate lump sum awards in bodily injury cases.

Operating expenses                These are the expenses relating to business activities excluding restructuring and one-off costs.

                                  The pre-tax profit that the Group’s activities generate, including insurance and investment activity but excluding finance costs,
Operating profit
                                  restructuring and one-off costs.
                                  These are claims payments as awarded under the Courts Act 2003. PPOs are used to settle some large personal injury claims.
Periodic payment order (“PPO”)
                                  They generally provide a lump-sum award plus inflation-linked annual payments to claimants who require long-term care.
Prudential Regulation Authority   The PRA is a part of the Bank of England. It is responsible for regulating and supervising insurers and financial institutions in the
(“PRA”)                           UK.

Reinsurance                       Contractual arrangements where the Group transfers part or all of the accepted insurance risk to another insurer.

                                                                                                                                                                          52
Glossary of terms
                  Term                                                                            Definition

Reserves                             Funds that have been set aside to meet outstanding insurance claims and IBNR claims.

                                     These are costs incurred in respect of the business activities where the Group has a constructive obligation to restructure its
Restructuring costs
                                     activities.

                                     This is calculated by dividing the profit attributable to the owners of the Company after deduction of the Tier 1 coupon payments
Return on equity
                                     by average shareholders’ equity for the period.

                                     This is adjusted profit after tax divided by the Group’s average shareholders’ equity less goodwill and other intangible assets.
Return on tangible equity (“RoTE”)   Profit after tax is adjusted to exclude restructuring and one-off costs and to include the Tier 1 coupon payments dividend. It is
                                     stated after charging tax using the UK standard rate of 19%.
                                     The capital adequacy regime for the European insurance industry, which became effective on 1 January 2016. It establishes
                                     capital requirements and risk management standards. It comprises three pillars: Pillar I, which sets out capital requirements for
Solvency II
                                     an insurer; Pillar II, which focuses on systems of governance; and Pillar III, which deals with disclosure
                                     requirements.

Solvency capital ratio               The ratio of Solvency II own funds to the solvency capital requirement.

                                     This shows the equity excluding Tier 1 notes and intangible assets (for comparability with companies who have not acquired
Tangible equity
                                     businesses or capitalised intangible assets).

Tangible net assets per              This shows the amount of tangible equity allocated to each ordinary share (for comparability with companies who have not
share                                acquired businesses or capitalised intangible assets).

Underwriting result                  The profit or loss from operational activities, excluding investment return and other operating income. It is calculated as net
profit / (loss)                      earned premium less net insurance claims and total expenses, excluding restructuring and other one-off costs.

                                                                                                                                                                         53
Disclaimer
Forward-looking statements

Certain information contained in this document, including any information as to the Group’s strategy, plans or future financial or operating performance, constitutes “forward-looking statements”.
These forward-looking statements may be identified by the use of forward-looking terminology, including the terms “aims”, “ambition”, “anticipates”, “aspire”, “believes”, “continue”, “could”, “estimates”,
“expects”, “guidance”, “intends”, “may”, “mission”, “outlook”, “over the medium term”, “plans”, “predicts”, “projects”, “propositions”, “seeks”, “should”, “strategy”, “targets”, “will” or "would" or, in each case,
their negative or other variations or comparable terminology, or by discussions of strategy, plans, objectives, goals, future events or intentions. These forward-looking statements include all matters
that are not historical facts. They appear in several places throughout this document and include statements regarding the intentions, beliefs or current expectations of the Directors concerning,
among other things: the Group’s results of operations, financial condition, prospects, growth, strategies and the industry in which the Group operates. Examples of forward-looking statements include
financial targets and guidance which are contained in this document specifically with respect to the return on tangible equity, solvency capital ratio, the Group’s combined operating ratio, percentage
targets for current-year contribution to operating profit, prior-year reserve releases, cost reductions, reductions in expense and commission ratios, investment income yield, net realised and unrealised
gains, capital expenditure and risk appetite range. By their nature, all forward-looking statements involve risk and uncertainties because they relate to events and depend on circumstances that may
or may not occur in the future and/or are beyond the Group’s control. Forward-looking statements are not guaranteeing future performance.

The Group’s actual results of operations, financial condition and the development of the business sector in which the Group operates may differ materially from those suggested by the forward-
looking statements contained in this document, for example directly or indirectly as a result of, but not limited to:
• United Kingdom (“UK”) domestic and global economic business conditions;
• the direct and indirect impacts and implications of the coronavirus Covid-19 pandemic on the economy, nationally and internationally, on the Group, its operations and prospects, and on the
   Group’s customers and their behaviours and expectations;
• the Trade and Co-operation Agreement between the UK and the European Union (“EU”) regarding the terms, following the end of the Brexit transition period, of the trading relationships between
   the UK and the EU and its implementation, and any subsequent trading and other relationship arrangements between the UK and the EU and their implementation;
• the terms of trading and other relationships between the UK and other countries following Brexit;
• the impact of the FCA pricing practices report and any new rules and regulations arising as a result of that report and of responses by insurers, customers and other third parties;
• market-related risks such as fluctuations in interest rates, exchange rates and credit spreads;
• the policies and actions and/or new principles, rules and/or changes to, or changes to interpretations of existing principles, rules and/or regulations, of regulatory authorities and bodies (including
   changes related to capital and solvency requirements or to the Ogden discount rate or rates or in response to the Covid-19 pandemic and its impact on the economy and customers) and changes
   to law and/or understandings of law and/or legal interpretation following the decisions and judgements of courts;
• the impact of competition, currency changes, inflation and deflation;
• the timing, impact and other uncertainties of future acquisitions, disposals, partnership arrangements, joint ventures or combinations within relevant industries; and
• the impact of tax and other legislation and other regulation and of regulator expectations, interventions and requirements and of court, arbitration, regulatory or ombudsman decisions and
   judgements (including in any of the foregoing in connection with the Covid-19 pandemic) in the jurisdictions in which the Group and its affiliates operate.

In addition, even if the Group’s actual results of operations, financial condition and the development of the business sector in which the Group operates are consistent with the forward-looking
statements contained in this document, those results or developments may not be indicative of results or developments in subsequent periods.

The forward-looking statements contained in this document reflect knowledge and information available as of the date of preparation of this document. The Group and the Directors expressly
disclaim any obligations or undertaking to update or revise publicly any forward-looking statements, whether because of new information, future events or otherwise, unless required to do so by
applicable law or regulation. Nothing in this document constitutes or should be construed as a profit forecast.

Neither the content of Direct Line Group’s website nor the content of any other website accessible from hyperlinks on the Group’s website is incorporated into, or forms part of, this document.

                                                                                                                                                                                                              54
You can also read