Santander UK Group Holdings plc - Investor Update for the six months ended 30 June 2017

Page created by Troy Owens
 
CONTINUE READING
Santander UK Group Holdings plc - Investor Update for the six months ended 30 June 2017
1

Santander UK Group Holdings plc

            Investor Update
       for the six months ended
             30 June 2017

                July 2017
Santander UK Group Holdings plc - Investor Update for the six months ended 30 June 2017
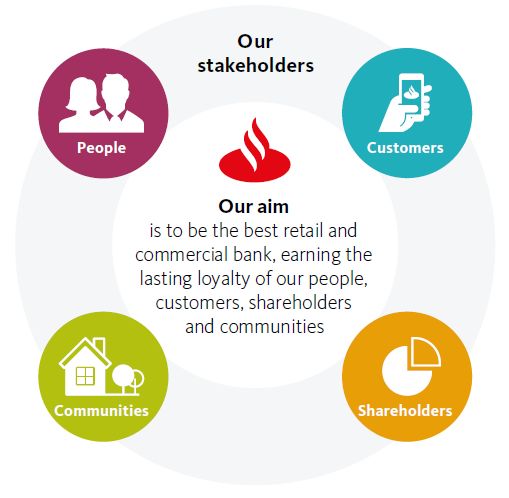
2
Disclaimer
Santander UK Group Holdings plc (Santander UK) is a subsidiary of Banco Santander SA (Santander).

This presentation provides a summary of the unaudited business and financial trends for the six months ended 30 June 2017 for Santander UK Group Holdings plc and its subsidiaries (Santander
UK), including its principal subsidiary Santander UK plc. Unless otherwise stated, references to Santander UK and other general statements refer to the business results of the same period in 2016.

This presentation was prepared for information and update purposes only and it does not constitute a prospectus or offering memorandum. In particular, this presentation shall not constitute or imply
any offer or commitment to sell or a solicitation of an offer, invitation, recommendation or commitment to buy or subscribe for any security or to enter into any transaction, nor does this presentation
constitute any advice or a recommendation to buy, sell or otherwise deal in any securities of Santander UK or Santander or any other securities and should not be relied on for the purposes of any
investment decision. This presentation has not been filed, reviewed or approved by any regulator, governmental regulatory body or securities exchange in any jurisdiction or territory.

Santander UK and Santander caution that this presentation may contain forward-looking statements. Words such as ‘believes’, ‘anticipates’, ‘expects’, ‘intends’, ‘aims’, ‘plans’, ‘targets’ and similar
expressions are intended to identify forward-looking statements, but are not the exclusive means of identifying such statements. By their very nature, forward-looking statements are not statements of
historical or current facts; they cannot be objectively verified, are speculative and involve inherent risks and uncertainties, both general and specific, and risks exist that the predictions, forecasts,
projections and other forward-looking statements will not be achieved. Forward-looking statements speak only as of the date on which they are made and are based on the knowledge, information
available and views taken on the date on which they are made; such knowledge, information and views may change at any time. Santander UK and Santander also caution recipients of this
Presentation that a number of important factors could cause actual results to differ materially from the plans, objectives, expectations, estimates and intentions expressed in such forward-looking
statements. Some of these factors are identified on page 303 of the Santander UK Group Holdings plc Annual Report for 2016. Investors and recipients of this Presentation should carefully consider
such risk factors and other uncertainties and events. Undue reliance should not be placed on forward-looking statements when making decisions with respect to Santander UK, Santander and/or their
securities. Nothing in this presentation should be construed as a profit forecast.

Statements as to historical performance, historical share price or financial accretion are not intended to indicate or mean that future performance, future share price or future earnings (including
earnings per share) for any period will necessarily match or exceed those of any prior year or period. This presentation reflects prevailing conditions as at the indicated date, all of which are subject to
change or amendment without notice. The future delivery of any amended information neither implies that the information (whether amended or not) contained in this presentation is correct as of any
time subsequent to its date nor that Santander UK or Santander are under an obligation to provide such amended information.

No representation or warranty of any kind is made with respect to the accuracy, reliability or completeness of any information, opinion or forward-looking statement, any assumptions underlying them,
the description of future operations or the amount of any future income or loss contained in this presentation or in any other written or oral information made or to be made available to any interested
party or its advisers by Santander UK or Santander’s advisers, officers, employees or agents. It does not purport to be comprehensive and has not been independently verified. Any prospective
investor should conduct their own due diligence on the accuracy of the information contained in this presentation.

Santander UK is a frequent issuer in the debt capital markets and regularly meets with investors via formal roadshows and other ad hoc meetings. In line with Santander UK’s usual practice, over the
coming quarter it expects to meet with investors globally to discuss the updates and results contained in this presentation as well as other matters relating to Santander UK.

To the fullest extent permitted by law, neither Santander UK nor Santander, nor any of their respective affiliates, officers, agents, employees or advisors, accept any liability whatsoever for any loss
arising from any use of, or reliance on, this presentation.

By attending / reading the presentation you agree to be bound by these provisions.

Source: Santander UK Q2 2017 results “Quarterly Management Statement for the six months ended 30 June 2017” or Santander UK Group Holdings Management Information (MI), unless otherwise
stated. Santander has a standard listing of its ordinary shares on the London Stock Exchange and Santander UK plc continues to have its preference shares listed on the London Stock Exchange.
Further information in relation to Santander UK can be found at: www.santander.co.uk/uk/about-santander-uk. Neither the content of Santander UK’s website nor any website accessible by hyperlinks
on Santander UK’s website is incorporated in, or forms part of, this presentation.
3
H117 business and financial highlights
                              Broadly
 Profit before                               Excluding specific gains, expenses and charges, adjusted
      tax
                 £1,063m       stable         PBT of £1,122m was up 13%
                              vs H116

   Digital                     +5%           Front book: 35% of total openings made digitally
 customers
                   4.8m
                             from Dec16       Back book: 47% of mortgages retained online

                                             Mortgage lending reflects management pricing actions in
                 £(0.2)bn     £0.7bn          late 2016 that impacted new mortgage completions in H117
 Net lending
                 mortgages   corporates      Lending to UK corporates driven by ongoing demand from
                                              medium and large corporate customers

                                             Banking NIM supported by retail liability margin
    NIM /         1.53%       +5bps
                                              improvement, partially offset by SVR mortgage attrition
 Banking NIM      1.91%       +12bps
                                              and pressure on new asset margins

 CET1 ratio /     12.1%       +50bps         CET1 and leverage ratio improvement driven by steady
Leverage ratio     4.4%       +30bps          profit and capital generation
4
2017 outlook
   We expect solid UK economic growth in 2017. However, we see greater uncertainty in the outlook, with the
    concern that some downside risks could materialise later this year and into 2018. Lower consumer spending growth
    combined with a potentially more challenging macro environment, adds a degree of caution to our outlook

   Consistent with an uncertain operating environment, we continue to purposefully control growth in the business
    areas with higher margins that have also been noted as potentially higher risk. We believe that our proactive risk
    management policies and low risk appetite will deliver a resilient performance in the business

   We expect Banking NIM to be slightly higher than in 2016, driven by improvements in liability margin and
    predicated on no change to the Bank of England Base Rate in 2017. The downward pressures will continue to be
    driven by SVR attrition and increased competition in new mortgage pricing

   Cost management will remain a key focus, with a comprehensive programme of ongoing cost initiatives including
    digitalisation, organisational simplification to further improve customer experience and operational efficiency

   Gross mortgage lending growth to be broadly in line with the market, supported by our continued focus on customer
    service and retention. Mortgage approval volumes so far this year have been higher than in late 2016, and as a result
    we expect completions to normalise in the coming months

   Corporate lending growth to trading business customers will continue to outpace the market, partially offset by the
    continued active management of our CRE exposures. This will result in slower overall growth than in recent years
5
2018 strategy creating value for all our stakeholders
 Our purpose is to help people and businesses
                                                            Our strategic priorities
                    prosper

                                                Customers
                                                 Grow customer loyalty and market share
                                                 Deliver operational and digital excellence

                                                Shareholders
                                                 Achieve consistent, growing profitability
                                                   and a strong balance sheet

                                                People
                                                 Live the Santander Way through our
                                                   behaviours

                                                Communities
                                                 Support communities through skills,
                                                   knowledge and innovation
6
Delivering on our 2016-18 commitments
                                                                                                                                     FY16                      H117      2018 target

                                    Loyal retail customers                                                                       3.7 million              3.9 million    4.7 million
                                    Loyal SME and Corporate customers                                                              290,000                  300,000       308,000
    Customers                       Retail customer satisfaction (FRS)                                                              62.9%                    61.7%         Top 3
                                        average of 3 highest performing peers                                                        62.5%                    62.9%
                                    Digital customers                                                                            4.6 million              4.8 million    6.5 million

                                    Adjusted Return on Tangible Equity / RoTE                                                       10.9%                     11.4%        8-10%
                                    Cost-to-income ratio (CIR)                                                                        50%                      48%        50-52%
   Shareholders                     Non performing loan (NPL) ratio                                                                 1.50%                    1.32%
7
Well positioned as the only UK full-service scale challenger
               Meaningful scale and opportunity…                                                            …a more diversified retail and commercial bank…

Retail                                           Corporate                                                          £200bn customer loans
                                                                                                                                                 77%                            14%
826 branches                                     65 Corporate Business                                                                       Mortgages                     Corporate loans
                                                 Centres                                                                                                                (up from 12% in 2013)
                                                                                                                    £174bn customer deposits
c80% financial centre                            636 Relationship Managers1
coverage                                                                                                                          38%                         36%               19%
                                                                                                                         Current Accounts                    Savings          Corporate
 3rd     UK Mortgage              lender2          5th    UK Commercial                 lender2                        (up from 19% in 2013)                                   deposits
                                                                                                                               Other customer loans and deposits

       …a growing retail current account provider…                                                               …a full-service corporate market challenger

 Retail Current Account volumes3                                                                                      Lending to UK companies4
 (m)                                                                                                                  (£bn)
                                      8%                                                                                                                     8%
                                                              8.5
                    6.7                                                                                                                                                        28.3
                                                                                           Santander UK CAGR
                                         1%                                                                                            22.1
                                                                                           Market CAGR                                                          0%

                   2013                                     Q117                                                                       2013                                   Q117
1. Excludes structured finance, product and international relationship managers | 2. Santander UK analysis, as at Q217. Commercial lending refers to loans to small and mid
sized corporate clients by UK retail and commercial banks and building societies | 3. Market source: CACI’s CSDB, Stock, Volume data as at December 2013 and March 2017
| 4. Market source: Bank of England Bankstats (March 2017), Private Non-Financial Companies (PNFCs). Data as at December 2013 and March 2017
8
Good progress in implementing ‘wide’ ring-fence structure
 Our ‘wide’ ring-fence model will serve our retail, commercial and corporate customers - providing
 greater certainty and minimal disruption.
 It also provides longer term flexibility, while lowering the overall programme implementation costs with
 the creation of the ring-fence now involving the transfer of fewer customers.

       Santander UK Group Holdings plc

      Santander UK plc1 – Ring-fenced bank                                                   Banco Santander SA /
                                                                                                London Branch

     No change for the majority of our customers                                            Servicing more sophisticated
                                                              Prohibited activities,         needs of c100 of our global
   Retail, Business Banking, SMEs, Mid/Large corporates       crown dependencies                     customers

 Customers who cannot be served and services which are not permitted within a ring-fenced bank will be transferred to
  Banco Santander, or its London branch
 We intend to use a Part VII Ring-Fence Transfer Scheme to transfer the majority of the prohibited business of the
  Santander UK group to Banco Santander
9
Timeline of ring-fencing implementation
 We are on track to complete the implementation of our ring-fence plans in advance of the legislative
 deadline of 1 January 2019, subject to regulatory and court approvals and various other authorisations.

                                                                               Expected
                                                                         representations date
                                                                         for written objections                                        Legal deadline for
                    New booking unit                                      to Part VII transfer                                         implementation of
                   readiness complete                                        scheme filed                       Migrations complete   ring-fencing regime

                                                                                                                                          1st Jan
                        Q3 2017                                             May 2018                               July 2018
                                                                                                                                           2019

                                                February
                                                                                            June 2018              July 2018
                                                  2018

                                            Directions hearing                            Sanctions hearing       Legal transfers
                                            and notification of                          for approval of Part        effective
                                             Part VII transfer                           VII transfer schemes
                                           scheme programme

Indicative timeline of ring-fencing implementation, subject to change.
10

Putting the customer at the heart of everything we do
11
Retail customer experience impacted by 1I2I3 World changes
                  Retail customer satisfaction (%) 1                                                                    Retail complaints received (indexed)2

                                                                                                             100                                                            Q314 indexed to 100
                                 62.9                    62.9                     62.9
                                                                                                                      87 86 83
                                                         62.5                                                                                 76              73 73 74 74 76 76
        60.4                     62.0                                                                                                                 68
                                                                                  61.7

        59.7                                                                                                                                                       3pp yoy

      Dec14                    Dec15      Dec16                                  Jun17
                               12 months ending

              Santander UK
              Average of 3 highest performing peers

1. As measured by FRS. Refer to Appendix 1 in the H117 Quarterly Management Statement for a full definition and glossary at www.santander.co.uk/uk/about-santander-
uk/investor-relations-glossary | 2. Source: Santander UK management information. All unique core complaints included. Those relating to legacy issues e.g. PPI and advice
related complaints are not included
12
1I2I3 Current Account has transformed our franchise
                                                                                                                                                  Non 1I2I3                1I2I3 Current
   An outstanding proposition for many customers
                                                                                                                                                Current Account              Account

  Simple and transparent                                                                               Deeper
   Clear value offer supported by 1I2I3 calculator                                                                                                        26%      loyal       68%
                                                                                                        relationships
  Fee paying account
   Adaptable to market conditions and interest rates                                                    Improved                                                  select /
                                                                                                                                                           6%                  34%
  Front book and back book                                                                             customer profiles                                         affluent
   Available to new and existing customers
  Reduced customer attrition                                                                           More valuable
   Driving customer long-term transactionality                                                                                                             1.5    products      2.1
                                                                                                        relationships

                                                                                                        Improved liquidity                                        average
                                                                                                                                                           1.0x                5.3x
                                                                                                        stability                                                 balance

                                                                                                        Customer
                                                                                                                                                         67.7%                70.0%
                                                                                                        satisfaction (FRS)1

1. Current account, GfK FRS 12 months ending Jun17. No significant difference in satisfaction scores between Non 1I2I3 Current Account vs 1I2I3 Current Account
13
Improving corporate customer experience
              Corporate customer satisfaction (%) 1                                                                Corporate complaints received (volume)2

                                                                                                          700

                                                        62                    61

             55                    56
                                                                                                                429
                                                        56                                                                                                                   274
             54                    54                                                                                       282                                                    250
                                                                              53                                                                           212         210
                                                                                                                                               182

         Dec14                 Dec15                Dec16                 Jun17                          Q413 Q214 Q414 Q215 Q415 Q216 Q416 Q217

              Santander UK                              Market average

1. Source: Charterhouse Business Banking Survey. Refer to Appendix 1 in the Q217 Quarterly Management Statement for a full definition and glossary at
www.santander.co.uk/uk/about-santander-uk/investor-relations-glossary. June 17 data based on corporate customers with annual turnover of £250,000 to £500m, previous
periods on £250,000 to £50m | 2. Source: Santander UK management information. Complaints relate to our commercial and corporate banking businesses
14
Enhanced offering for our corporate and commercial clients
                         No. of
                       customers
                                       Customer loans     Clear strategy to grow corporate franchise

                                                         Leverage Banco Santander’s international
  Business banking      709,000           £2.0bn
                                                          presence and Latin America expertise
  Commercial                                             Further develop digital platform and simplify
                         13,000           £19.6bn
  Banking
                                                          product offering to improve service proposition
  GCB                     350             £6.5bn         Event driven finance, looking to meet client needs
                                                          at key milestones in their growth

                                                         Widening product base to help build a scaled Asset
         Innovative, international offerings
                                                          Finance business

                                                         Increasing connectivity between Commercial
                                                          Banking and GCB, focusing on a client-centric
                                                          approach and creating long-term relationships

                                                         New mergers and acquisitions advisory team that
                                                          will strategically complement our existing product
                                                          capabilities and support fee income growth
   Trade corridors
15
Enhancing digital capability to meet changing customer needs
Continuous focus on improved customer journeys                Total digital customers (m)

                                                                                               6.5
               Touch ID
               Push notifications                                   4.6               4.8
Mobile
               Financial management tools             3.2
               Device token security

               Intuitive customer journey
Online         Intelligent personalisation            FY14         FY16           H117      2018 target
 bank          Enhanced accessibility
               Fraud prevention systems
                                                             Total digital transactions (m)

               Enhance mortgage, fraud and digital                                    150
Website
               journey models
                                                                   117
                                                      92

                                                                                      71         91
                                                      43            55

                                                     FY14         FY15            FY16         H117
                                                                          Half Year
16
Digital transformation improving operational efficiency
       Digital openings (% of total openings)                                  Impact of digitalisation

   2014
                               46                                      From                                To
   H117
            34          36
                                                  31         Branch based mortgage             Digital end-to-end
                                                             application - 3 hours             application - c50 mins
     22
                                           17                No video link capability for      Apply for a mortgage via
                                                             applications                      video link to an advisor

                                                             Online internal transfers -       Online internal transfers -
   Current account      Credit card   Business banking a/c   none                              47%

                                                                              Bolstering cyber security

 In late 2016, we started to roll out a new customer         Protecting our customers, systems and information is a
  relationship management tool, to help us deliver a truly     top risk and a key area of focus. We have increased our
  omnichannel customer experience                              resources and are leveraging connections with Banco
 By bringing together internal, external and market data      Santander’s Cyber Security Operations Centre
  to personalise our conversations and further simplify       Our Cyber Resilience programme operates with a
  key processes in our interaction with customers              layered defence approach, continually evolving and
                                                               adapting to cyber threats
17

Consistently profitable, sustainable business
18
Consistently profitable, sustainable business
                                Banking NIM (%) 1                                                                                    Profit before tax (£m)

   NIM                                                                                                     Adjusted RoTE / RoTE
      1.52%                   1.53%                   1.48%                    1.53%                                                                           10.9%    11.4%
                                                                                                              10.4%
                                                                                                                                        8.2%

                                                                               1.91                                                                             1,914
        1.82                    1.83                   1.79
                                                                                                               1,399                    1,342

                                                                                                                                         928                    1,078   1,063
                                                                                                                 545

      Dec14                   Dec15                  Dec16                   Jun17                             FY14                     FY15                    FY16    H117
                                                                                                                                          H1 Profit before tax

1. Banking NIM is calculated as annualised net interest income divided by average customer loans. NIM is considered the most comparable IFRS measure to Banking NIM.
19
Operational efficiency well managed
           Operating expenses (£m)                      Cost discipline is part of our ‘DNA’

Cost-to-income ratio                             Improved cost-to-income ratio, with operational
                                                  efficiency absorbing investment in business growth and
  54%         53%                                 digital
                                50%
                                        48%
                                                 Our costs were also well managed, despite inflationary
                                                  pressures
                                                 Adjusting for Banking Reform costs, operating
 2,397        2,403             2,417
                                                  expenses were down £2m

                                                  Comprehensive programme of cost initiatives

                                                 On-going simplification and digitalisation of
                                                  processes across our businesses
 1,223        1,201             1,206   1,216    Omni-channel platform with optimised distribution,
                                                  leading digital tools and remote service and advice
                                                 Leveraging Banco Santander’s scale through shared
  FY14        FY15              FY16    H117      capabilities across countries
             H1 Operating expenses
20
Improved retail customer primacy and liability spread
     Retail Banking current account balances (£bn)                                                                            Retail Banking deposits (£bn)1

                                                                                                            Deposits spread2
                                                                                                             (0.76)%                 (0.63)%                  (0.57)%    (0.27)%
                                                        64.8                     66.3

                                                                                                                                                                 148.1    148.7
                                53.2                                                                                                    140.3
                                                                                                                132.9

       41.1
                                                                                                                 53%                      61%                     64%     64%

     Dec14                    Dec15                   Dec16                    Jun17                           Dec14                    Dec15                   Dec16    Jun17
            1I2I3 Current Account balances                                                                           Deposits by primary account customers

1. Retail Banking customer deposits include savings and bank accounts for personal and business banking customers, includes Jersey and Cater Allen | 2. Retail Banking
customer deposit spreads against the relevant swap rate or LIBOR.
21
Prime residential mortgage book of £154.1bn
            Mortgage product profile (stock, Jun17)                                                                      Geographical distribution (stock %, Jun17)

            Standard Variable
            Rate (SVR)                 17%                                                                            31
                                                                                                                                    24
                                                                                                                                                  15            13
                                 21%                                                                                                                                          11
            Variable   rate1                                          Fixed rate
                                                           62%                                                                                                                                4             2

                                                                                                                    South East     London        North      Midlands and  South West,      Scotland   Northern Ireland
                                                                                                                                                             East Anglia Wales and Other

          Mortgage borrower profile (stock, Jun17)                                                                                          Mortgage lending (£bn)
                                     Buy to Let (BTL)
                                                                                                                                            11.6                                    11.6
                                             4%
           First-time buyers        19%                                                                                                                      (11.8)
                                                            44% Home movers                                          154.3                                                                            154.1

                Remortgagers          33%
                                                                                                                       Dec16         New business Redemptions                      Internal             Jun17
                                                                                                                                                  & repayments                     transfer

            33% interest only mortgages (Dec16: 34%)2                                                                            c75% of maturing mortgages retained3

1. Variable rate includes tracker and base rate linked products | 2. Full interest only loans and the element of part-and-part attribution to interest only balances |
3. Refer to glossary at www.santander.co.uk/uk/about-santander-uk/investor-relations-glossary for a full definition
22
Consistently prudent mortgage lending criteria
                       Mortgage loan distribution                                                                                  Loan to value (LTV)

                                                               Dec16              Jun17                                                                Dec16        Jun17

   Loan size distribution (stock)                                                                             Simple average LTV2

       Less than £0.25m                                        71.6%              70.3%                            new lending                           65%        63%
       £0.25m - £0.5m                                          21.3%              22.3%                            stock                                 43%        43%
       £0.5m - £1m                                              6.3%               6.6%
       £1m - £2m                                                0.7%               0.7%                       Indexed LTV distribution (stock)
       Over £2m                                                 0.1%               0.1%
                                                                                                                   > 85% - 100%                          4%          4%
                                                                                                                   > 100%                                1%          1%
   Average loan size distribution (new business)
                                                                                                              New lending % with LTV > 85%               17%        20%
       London and South East                                   £264k              £263k
       Rest of UK                                              £144k              £146k
       All UK                                                  £198k              £198k
                                                                                                                       10,900 first-time buyers (£1.8bn gross lending)
   Loan-to-income multiple1                                      3.16               3.18                                2,700 BTL mortgages (average LTV of 62%)

1. Average earnings multiple of new business at inception in the periods | 2. Unweighted average loan-to-value of all accounts
23
Robust residential mortgage credit performance
                                                                                   Mortgage loan loss allowances
                             Mortgage NPLs (£m)
                                                                                        and write-offs (£m)
   Balance (£bn)                                                         Loan loss allowance
        150.1                  152.8                    154.3    154.1
                                                                             579
                                                                                          424
                                                                                                        279        251
         2,459
                                2,252
                                                       2,110
                                                                1,936
                                                                           Dec14        Dec15       Dec16      Jun-17

       1.64%                                                             Write-offs during the period
                              1.47%                                          68
                                                      1.37%
                                                                1.26%                     40
                                                                                                        33
                                                                                                                    11

                     1
        Dec14                  Dec15                  Dec16     Jun17       FY14         FY15       FY16           H117
                                             NPL ratio

1. Residential mortgages NPL ratio for Dec14 excludes PIPs
24
Managing growth in consumer and unsecured lending
                     Consumer finance loans (£bn)                 Credit cards and unsecured loans (£bn)

   NPL ratio (%)                                            NPL ratio (%)
          0.45             0.44        0.47         0.48        1.80          1.52           1.73                 1.67

                           6.3         6.8           6.9
                                                                               5.6           5.2                   5.2
                                                                5.0
         3.3                                                                   2.8           2.7                   2.8
                                                                2.8

                                                                2.2            2.8           2.5                   2.4

       Dec14              Dec15       Dec16         Jun17     Dec14          Dec15          Dec16                 Jun17
                                                                         Unsecured loans1          Credit cards

   Prime vehicle finance business, with an average loan     Prime unsecured and credit card business, with
    size of c£12,000                                          average loan size of c£9,500 and average credit card
   7 manufacturer partners (joint ventures with PSA          balance of c£1,200
    Peugeot Citroen, Hyundai)                                Defaults stable and at low levels
   Prudent underwriting criteria including manual           Negligible exposure to assumed future income flows
    assessment for higher risk cases

1. Includes overdrafts
25
Prudent approach in corporate lending
                                                       Corporate lending loan loss allowances
            Corporate NPLs (£m)
                                                                and write-offs (£m)
Balance (£bn)                                      Loan loss allowance
   24.0          26.5               27.4    28.1
                                                       392
                                                                   307            334     327

   726
                                689
                 604
                                           559       Dec14       Dec15       Dec16      Jun-17
  3.03%
                                                   Write-offs during the period

                                                                   118
                               2.51%       1.99%       92
                2.28%
                                                                                  34      25

  Dec14         Dec15         Dec16        Jun17      FY14        FY15        FY16       H117
                        NPL ratio
26
Well diversified CRE portfolio
                              Credit performance                                                                                    Sector analysis (stock %, Jun17)

                                                               Dec16                Jun17                         25
                                                                                                                           19
    Total committed exposure                                   £9.0bn               £8.7bn                                             15           14
                                                                                                                                                                 11
                                                                                                                                                                              8
        Up to 70% LTV                                               88%                  88%
                                                                                                                                                                                          4
                                                                                                                                                                                                      2          2
        70% to 100% LTV                                                  2%                1%
        > 100% LTV                                                       1%                    -                  Office   Retail    Industrial   Mixed use   Residential Standardised Hotels and Student acc
                                                                                                                                                                            portfolio   leisure
                                                                                                                                                                                                                Other

        Standardised portfolio1                                          7%                8%
        Total with collateral                                       98%                  97%                       No new business written above 70% LTV (Dec16: 0%)

        Development loans                                                2%                3%                      83% written at or below 60% LTV (Dec16: 95%)

                                                                  100%                100%                         Weighted average LTV on exposures Jun17: 49%
                                                                                                                    (Dec16: 50%)2

                                                               Dec16                Jun17                          Average loan size of £4.8m at Jun17 (Dec16: £4.8m)
                                                                                                                   NPL ratio decreased primarily due to the sale of
    NPL ratio                                                    2.00%               1.06%
                                                                                                                    collateral to repay two impaired loans, as well as other
    NPL coverage ratio                                              32%                  63%
                                                                                                                    redemptions and write-offs of older vintage loans

1. Consists of smaller value transactions, mainly commercial mortgages   |   2. Excludes standardised portfolio
27

Strong capital, liquidity and funding position
28
Existing wholesale funding issuance model
                         Banco Santander – multiple point of entry resolution group
                   Santander UK Group Holdings plc – single point of entry resolution group

   The PRA regulates capital and liquidity (including dividends) and large exposures
   We are required to satisfy the PRA that we can withstand capital and liquidity stresses on a standalone basis

                          Banco Santander SA

                   NO GUARANTEE            100% OWNED
                                                                        Subordinated debt
                    Santander UK Group Holdings plc       issues
                                                                        Senior unsecured notes
                   NO GUARANTEE           100% OWNED
                                                                        Mortgages used for RMBS
                            Santander UK plc              issues        Covered Bonds

                   GUARANTEE              100% OWNED                    Senior unsecured notes

                   Abbey National Treasury Services plc   issues        Structured notes
                                                                        Short term funding
29
Robust capital and leverage levels
                    CET1 and T1 leverage ratio (%)                                                                                       Total capital ratio

                                                                                                                  19.3%
                                                                               12.1                                                                17.9%              17.8%
          11.9                                                                                                    T2 4.2%
                                                                                                                                                    T2 3.1%           T2 3.3%3
                                 11.6                   11.6
                                                                                                                 AT1 &
                                                                                                             Legacy T1 3.0%                        AT1 2.7%           AT1 2.5%2

                                                                                4.4
                                                                                                                    CET1                             CET1               CET1
                                                         4.1                                                        12.1%                            12.1%              c12%
                                  4.0
            3.8

        Dec14                  Dec15                  Dec161                 Jun17 1                               Jun17                           Jun17           2018 end-point
                                                                                                                  (OpCo)                          (HoldCo)           (HoldCo)
                                         T1 Leverage ratio (%)

 HoldCo and OpCo total capital difference is driven by the recognition of minority interests, at June 2017 there was a
  0.3% T1 and 1.1% T2 minority interest deduction at HoldCo
 At 31 December 2016, Santander Group Holdings plc had £4.2bn of distributable reserves

1. Dec16 and Jun17 leverage ratios were calculated applying the amended definition, as published in the Jul16 PRA statement. | 2. Current minimum AT1 regulatory
requirement is Pillar 1 1.5% and Pillar 2A 0.95% | 3. Current minimum T2 requirement is Pillar 1 2.0% and Pillar 2A 1.25%
30
Well placed to meet evolving capital requirements
     We have an end 2018 target CET1 ratio of c12%, this target is based on the known static CET1 end-point
      requirements

     Our CET1 target will be managed according to the static end point CET1 and dynamic countercyclical CET1 buffer.
      It is our current intention to target a CET1 management buffer that is of sufficient size to absorb changes in the
      regulatory minimum requirement (e.g. application of any dynamic buffers) and cyclical volatility

                                                                                                                                 Management buffer

                                                                                                     SRFB 1.0%3                          1.0%3

                                                                                                      CCB 2.5%2                          2.5%2
                                          CCB   1.25%2                 CCB 1.875%2
            CCB 0.625%2
                                                                                                                                                                     Current known
                                        CET1 Pillar 2A                                                                                                                 static end

                                                                                                                                                            Static
           CET1 Pillar 2A                                                  2.8%¹                         2.8%¹                           2.8%¹
                                           2.8%¹                                                                                                                      point CET1
              2.2%
                                                                                                                                                                     requirements
                                                                                                                                                                        10.80%

            CET1 CRD IV
                                            min 4.5%                     min 4.5%                      min 4.5%                        min 4.5%
             min 4.5%

       December 2016                      2017                          2018                         2019                       2019 end-point
        requirement                    requirement                   requirement                  requirement                       CET1 6
1. Santander UK’s Pillar 2A requirement was 5.0% at 1 January 2017, Pillar 2A guidance is a point in time assessment | 2. 2.5% capital conservation buffer phased in from
2016-2018 | 3. 1% systemic risk buffer (note this applicable from 2019 for the ring-fence bank). | 4. On 27 June 2017, the FPC increased the UK Countercyclical buffer
(CCyB) rate from 0% to 0.5% with binding effect from 27 June 2018. The FPC expects to increase the rate to 1% at its November 2017 meeting, with binding effect a year after
that, absent of any material change in the outlook. Santander UK’s geographical allocation of the CCyB is 90%.
31
2016 PRA stress test; Santander UK most resilient of UK banks

                              CET1 drawdown (bps)1                                                                                  Santander UK 2016 results

 Santander                                                                                                     Significantly exceeded the PRA’s stress test CET1
    UK               Lloyds           HSBC           Barclays Nationwide                  RBS                   threshold requirement of 7.3%, with a stressed CET1
                                                                                                                ratio of 9.9%
                                                                                                               Exceeded the leverage threshold requirement of
     170
                      250              280                                                                      3.0%, with a stressed leverage ratio of 3.6% after
                                                        310
                                                                                                                allowed management actions
                                                                                                               The outcome of the stress test underlines the quality
                                                                                                                and strength of our UK-based balance sheet as well
                                                                         700                                    as our strong risk management practices
                                                                                          880

   2017 PRA stress test assumptions2                                                                             More severe stressed scenario for global economy

       2017 GDP growth                                                           (4.7)%                          Includes increase in rate of return demanded for
       Unemployment rate                                                          9.5%                            sterling assets alongside depreciation in currency
       Inflation                                                                  2.7%                           New biennial exploratory scenario designed to
       House price inflation                                                     (33)%                            examine banks’ strategic response to a structurally
       Base rate                                                                   4%                             more challenging operating environment

1. Source: Bank of England, Stress testing the UK banking system: 2016 results. CET1 drawdown is defined as CET1 ratio as at Dec15 less minimum stressed ratio (after the
impact of ‘strategic’ management actions and conversion of AT1) | 2. Source: Bank of England, Stress testing the UK banking system: key elements of the 2017 stress test
32
Strong liquidity and funding position
                   LCR eligible liquidity pool (£bn)                                                                               Loan-to-deposit ratio (%)

   Liquidity coverage ratio (LCR)

                                                        139%
                                                                                 133%                                124
                               120%                                                                                                         121
      110%
                                                                                                                                                                       116
                                                                                                                                                                              114

                                                        50.7                    50.1
          39.5                   38.7

        Dec14                  Dec15                  Dec16                   Jun17                                Dec14                  Dec15                   Dec16      Jun-17

A glossary of the main terms used in the Quarterly Management Statement is available on our website at www.santander.co.uk/uk/about-santander-uk/investor-relations-
glossary
33
Improved funding profile with reduced encumbrance
                      MTF maturities (£bn, Jun17)1                                                                       Wholesale funding stock (Jun17)
                                                                                                                                                   TFS
         Senior unsecured2                Covered bonds                Securitisation3
                                                                                                                                                     12%
                                                                                                                                                                      23%   Covered bonds
 >5yrs          3.6          3.3     6.9                                                                                Securitisation2      10%
                                                                                                                                                     Outstanding
3-5yrs                     9.6                             7.8             1.3 18.7                                                                    stock:
                                                                                                                                                                        9% Subordinated debt
                                                                                                                      Money markets        14%       £64.0bn
1-2yrs            4.7         2.0      6.7
                                                                                                              Average duration:
34
Non-binding indicative MREL requirements
                                                                                                     Non-binding indicative MREL glide path

  In March 2017 the Bank of England
   (BoE) confirmed Santander UK’s non-
   binding indicative MREL requirements.                                                                                                                          End State
   The requirements over and above                                                                                                                               25.9% RWA
   regulatory capital start in 2019, step up                                                                 Transitional Period

   in 2020 and become fully implemented
                                                                                                                   20.9% RWA              20.9% RWA
                                                                                      6% Leverage
   in 2022                                                                            19.8% RWA²                                                                   MREL
                                                                                                                                                               recapitalisation
                                                                                                                                            MREL
  The indicative requirements include both                                              MREL
                                                                                                                     MREL
                                                                                                                 recapitalisation       recapitalisation
                                                                                                                                                                    13%
                                                                                                                                                                                  3
                                                                                     recapitalisation                                         8%
                                                                                                                       8%
   the Pillar 1 and Pillar 2A capital                                                     6.9%

   requirements and the MREL
   recapitalisation requirements. They do
                                                                                   Pillar 1 & Pillar 2A         Pillar 1 & Pillar 2A   Pillar 1 & Pillar 2A   Pillar 1 & Pillar 2A
   not take into account any combined                                                requirements¹                requirements¹          requirements¹          requirements¹
                                                                                           13%                          13%                    13%                    13%
   buffer requirements which effectively ‘sit
   on top’ of the MREL requirements
  Final MREL requirements may change
   as the BoE continues to review                                                      January                     January                January                January
                                                                                        2019                        2020                   2021                   2022
   Santander UK’s resolution strategy

1. Assumes Pillar 2A requirement remains at c5%   | 2. Calculated using RWA and UK leverage exposure as at 31 December 2016
35
Well placed to meet non capital MREL requirements
                     OpCo MTF maturities (£bn)                                                                    MREL recapitalisation requirements²

         Secured
                                                       6.1                  20.2
         Unsecured
                                                       1.9

                                8.6                    4.2
                                                                             11.7
                                5.8

          5.5                   2.8
                                                                                                                                                                     £11.4bn3
          4.0                                                                8.5
                                                                                                           £5.6bn1                £6.1bn                £7.0bn
          1.5
        2017                  2018                   2019            Total OpCo                        Senior HoldCo           Est. 2019              Est. 2020 &    Est. 2022
                                                                                                         issuance             MREL recap.             2021 MREL     MREL recap.
                                                                      maturities                          to date                req.                 recap. req.      req.

 MREL recapitalisation requirement to be largely met through gradual refinancing of existing OpCo maturities. It will not
  be additive to wholesale funding requirements
 It is our current intention to have an MREL recapitalisation management buffer in excess of the value of HoldCo senior
  unsecured paper that is due to become MREL ineligible over the immediately preceding 6 months

1. GBP equivalent at 30 June 2017 | 2. Requirements are based off Santander UK’s Non-binding indicative MREL requirements communicated by the BoE in Q117 and end
of Q117 RWA balances. Minimum leverage ratio of 3.0% assumed in calculation of MREL requirements.
36
UK resolution regime; transparent HoldCo downstream model
1   ‘No creditor worse off’                                                                                       2
    principle enshrined in                                                                                           Losses at HoldCo can only apply to the extent of any write-
    the UK resolution regime                   Operating Company (OpCo)                                              down of its intercompany assets
    – respecting the creditor
    hierarchy regardless of                                  Excluded Liabilities
    whether the liability is                                                                                                                                                   3
    internally or externally                     Inter-co Senior               External Senior                          Holding Company (HoldCo)                                   Losses
    issued                                                                                                                                                                         limited to
                                                                 Inter-co    LAC1                                                             Senior
                                                                                                                                                                                   write down of
                                               Inter-co Sub Debt             External Sub Debt                                       Subordinated Debt                             intercompany
                      Losses arise
                      at OpCo
                                                                                                                                                                                   assets2
                                                                       Equity                                                                  Equity

       Under the end-state MREL / TLAC regime HoldCo senior unsecured debt will be down-streamed in a form that is
                 subordinated to OpCo senior unsecured debt but senior to subordinated capital instruments

                             Santander UK                                               Current
                           Group Holdings plc
                                                                                                                                             Santander UK plc
                                                                                     down-streaming
                                                                                                                                Senior - £5.6bn3     OpCo Senior
                             Senior - £5.6bn3
                                                                                                                                           Internal MREL
                                                                                        End-state
                                 T2 - £1.2bn3                                                                                      T2 - £1.2bn3                        Legacy T2
                                                                                      down-streaming
                               AT1 - £2.05bn                                                                                      AT1 - £2.05bn                        Legacy T1

1. Inter-co Loss Absorbing Capacity (LAC) may require terms to be included in the intercompany trade to make it subordinated to non LAC senior liabilities | 2. The write-
down of the intercompany assets will be determined by the relevant authority following valuations conducted per BRRD Art 36 | 3. GBP equivalent at 30 June 2017
37
Credit ratings – July 2017
                                                    S&P                     Moody’s                   Fitch

                   Senior unsecured                  BBB                      Baa1                      A
                        outlook                     stable                   negative                 stable
 Santander
 UK Group
 Holdings
                          Tier 2                    BB+                        Baa1                    A-
    plc
                           AT1                       B+                        Ba2                    BB+

                   Senior unsecured                  A                         Aa3                      A
                        outlook                   negative                   negative                 stable

 Santander
  UK plc
                       Short-term                    A-1                        P-1                    F-1

                   Standalone rating                bbb+                        a3                    baa1

 S&P affirmed the long-term rating for Santander UK plc at A, with an outlook of negative in Jun17
38

UK economic outlook
39
Potentially more challenging UK macro environment
           Annual GDP1 growth (%, annual average)                                                                       Bank of England base rate (%, year end)
                                                                                              HMT                                                                                             HMT
                                                                                             Range                                                                                           Range

         3.1                                                                                   2.6
                            2.2                                                                                                                                                              1.00
                                               1.8                1.5                1.4                            0.50               0.50                                           0.50
                                                                                                                                                          0.25             0.25
                                                                                                    0.4

        2014               2015               2016            2017 (f)           2018 (f)                           2014               2015               2016            2017 (f)   2018 (f) 0.05

      Annual CPI2 inflation rate (%, annual average)                                                                       GBP/Euro exchange rates (year end)
                                                                                              HMT
                                                                                             Range
                                                                                                                    1.28               1.36
                                                                                                                                                          1.17             1.17       1.17
                                                                  2.9                               3.6
                                                                                     2.5
         1.5
                                                                                                    1.7
                                               0.7
                            0.0

        2014               2015               2016            2017 (f)           2018 (f)                           2014               2015               2016            2017 (f)   2018 (f)

Source: Office for National Statistics and Bank of England. 2017 (f) and 2018 (f) are forecasts by Santander UK (July 2017). External forecast ranges from HMT Treasury
Consensus June 2017. Only forecasts made in the latest 3 months (Apr, May and Jun) have been included in the high / low range.
1. Data revisions to Quarter 1 2017 in the third estimate of GDP (published 29 June 2017) | 2. Consumer Price Index
40
Housing and labour markets could come under pressure

                         Unemployment rate (ILO1)                                                                             Property transactions (sa2, 000s)
                                                                                              HMT
                                                                                             Range

                                                                                               6.4                 1,223              1,226              1,229              1,231      1,250
         5.7                5.1                                                      5.3
                                               4.7                4.9

                                                                                               4.4

      Dec'14             Dec'15             Dec'16           Dec'17 (f) Dec'18 (f)                                  2014               2015               2016            2017 (f)    2018 (f)

                          Average weekly earnings
                                                                                                                                             House prices3 (%)
                          (annual, % inc. bonuses)
                                                                                              HMT                                                                                               HMT
                                                                                             Range                                                                                             Range
                                                                                                                                        9.5
                                                                                                    4.0               7.8                                                                        7.9
                                                                                                                                                           6.5
                                               2.6                2.5                2.6
         2.1                1.9                                                                                                                                              3.0
                                                                                                                                                                                        2.0
                                                                                                    1.8

                                                                                                                                                                                             (2.0)
        2014               2015               2016            2017 (f)           2018 (f)                         Dec'14             Dec'15             Dec'16            Dec'17 (f) Dec'18 (f)
Source: Office for National Statistics and Bank of England. 2017 (f) and 2018 (f) are forecasts by Santander UK (July 2017). External forecast ranges from HMT Treasury
Consensus June 2017. Only forecasts made in the latest 3 months (Apr, May and Jun) have been included in the high / low range.
1. International Labour Organisation | 2. Seasonally adjusted | 3. Halifax house prices (Source: IHS Markit)
41
Housing market growth expected to slow in 2017
                              House price change                                                                             House price change by region
                               (annual %, nsa1)                                                                                May17 (annual %, nsa1)
        February
                                                                                                                                   7.2           7.5
        March
        April                                                                                                                             5.3                          5.5
                                                                                                                                                               4.8           5.0
                                                                                                                            4.4                                                                4.3
                                                                                                                     3.8                                                           3.8
                                                                                                                                                        3.0                              3.5
         5.8                                                          5.4           5.9
                       5.3
                4.5                                    4.7                                                    1.6
                                        3.7                                  3.8

                                               1.5

                UK                            London                    South East

        House purchase and remortgage approvals                                                                                      House price inflation
                       (000s, sa2)                                                                                                     (annual %, sa2)
                                                                                                                           Halifax index (May17): +2.6% annual 3m/3m % (sa)
140                                                                                                                        House price decline:
                                              House Purchase             Remortgage
120                                                                                                                        Peak (Aug’07) to Trough (Apr’09): -23%

100

 80

 60

 40

 20                                                                                                                                               House price:
  0                                                                                                                                               Trough to latest (Jun17): +39%
   Aug-Feb-Aug-Feb-Aug-Feb-Aug-Feb-Aug-Feb-Aug-Feb-Aug-Feb-Aug-Feb-Aug-Feb-Aug-Feb-
    07 08 08 09 09 10 10 11 11 12 12 13 13 14 14 15 15 16 16 17
Sources: House price change and House price change by region Apr17 (annual %, nsa): Office for National Statistics. House purchase and remortgage approvals to May17
(000s, sa): Bank of England. House price inflation (annual %, sa): Halifax (IHS Markit) data to Jun17
1. nsa: not seasonally adjusted | 2. sa: seasonally adjusted
42

        www.aboutsantander.co.uk

         Results and Presentations                          Debt Investors

            Quarterly, half yearly and                        Funding information and details of the
            annual financial results and presentations        covered bond, securitisation and other debt
                                                              issuance programmes

         Glossary                                           Key dates1

            A glossary of the main terms is available at:     Banco Santander Strategy Update: 10 October 2017
            www.santander.co.uk/uk/about-santander-           Q317 results: 26 October 2017
            uk/investor-relations-glossary

        Investor Relations                                  Treasury

         Bojana Flint                                       Tom Ranger
            Head of Investor Relations                        Treasurer of Santander UK
            +44 20 7756 6474                                  +44 20 7756 7107
            ir@santander.co.uk                                mtf@santander.co.uk

1. Indicative, dates subject to change.
Santander UK Group Holdings plc
You can also read