Origins of stream salinization in an upland New England watershed
←
→
Page content transcription
If your browser does not render page correctly, please read the page content below
Environ Monit Assess (2018) 190:523
https://doi.org/10.1007/s10661-018-6802-4

Origins of stream salinization in an upland New England
watershed
D. M. Evans & A. M. Villamagna & M. B. Green &
J. L. Campbell

Received: 16 February 2018 / Accepted: 12 June 2018
# Springer International Publishing AG, part of Springer Nature 2018

Abstract Salinity levels are above historical levels in                Introduction
many New England watersheds. We investigated poten-
tial sources of salinity in the Pemigewasset River, a                  Anthropogenic salinization of freshwater streams and
relatively undeveloped watershed in northern New En-                   rivers is increasing globally through activities such as
gland. We utilized a synoptic sampling approach on six                 mining, agriculture, discharge of saline wastewater
occasions between April and September 2011 paired                      (Williams 2001), and application of de-icing salts
with a novel land use analysis that incorporated tradi-                (Kaushal et al. 2005; Ramakrishna and Viraraghavan
tional watershed and riparian zones as well as a local                 2005; Kaushal et al. 2018). In dryland agricultural sys-
contributing area. We established background specific                  tems, irrigation and the subsequent evaporation, concen-
conductivity (SC) and found that SC was above                          tration, and leaching of salts and minerals in irrigation
established background levels in both the mainstem of                  and soil water are the primary cause of freshwater sali-
the river (peak of 172 μS cm−1) and multiple tributaries.              nization (Williams 1987). Mining contributes to the
Specific conductivity was highest during low flow con-                 salinization of freshwaters by fragmenting and exposing
ditions (June) indicating potential groundwater storage                geologic materials that then oxidize and release salts and
and release of de-icing salts applied during winter                    ions such as SO42−, HCO3−, Ca2+, and Mg2+ into
months. Development in the watershed and riparian                      streams (Griffith 2014; Evans et al. 2014). In cold
zone was found to be more strongly associated with                     regions of North America and Europe, application of
elevated SC, compared to roads. The local contributing                 de-icing salts, such as NaCl, can lead to salt runoff and
area was not found to be strongly associated with SC;                  leaching and subsequent increases in Cl− and total dis-
however, there was evidence that the local contributing                solved solids (TDS) in freshwater streams and rivers
area may contribute to SC under low flow conditions.                   (Godwin et al. 2003; Kaushal et al. 2005; Gardner and
                                                                       Royer 2010; Kelting et al. 2012).
                                                                           The negative impacts of freshwater salinization are
Keywords Conductivity . Land use . Pollution                           extensive, including salinized water being less suitable
transport . Pollution storage . Freshwater                             for industry, agriculture, freshwater biota, and drinking
                                                                       water (Williams 1987). In the USA, Cl− and total dis-
D. M. Evans (*) : A. M. Villamagna : M. B. Green                       solved solids (TDS) are not regulated as primary water
Plymouth State University, Plymouth, NH, USA                           pollutants, but they are listed as nuisance pollutants. The
e-mail: Dmevans1@plymouth.edu                                          United States Environmental Protection Agency
M. B. Green : J. L. Campbell
                                                                       (USEPA 2018) recommends a limit of 250 mg L−1 for
U.S. Forest Service Northern Research Station, Newtown Square,         Cl− and 500 mg L−1 for TDS in human drinking water
PA, USA                                                                (USEPA 2018) and suggests a chronic impact threshold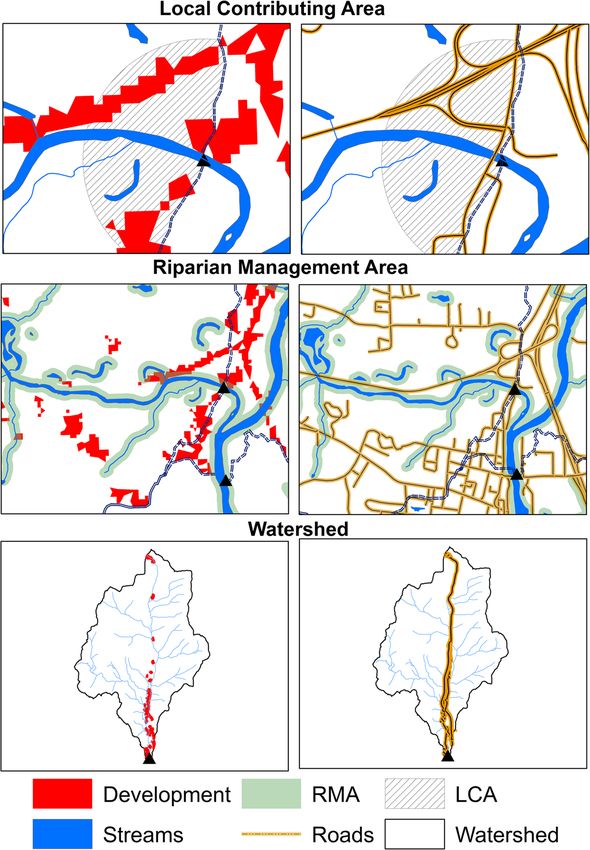
523    Page 2 of 12                                                      Environ Monit Assess (2018) 190:523

of 230 mg Cl L−1 and an acute impact threshold of            developed areas within the watershed where both de-
860 mg Cl L−1 to maintain freshwater aquatic ecosystem       icing salts and other land management activities, such as
health (USEPA 2006).                                         housing development, can lead to salinization. We used
   Salinity levels are above historical levels in many       multivariate analysis to test for relationships between
watersheds of NH, USA (Rosenberry et al. 1997;               SC and development and roads across three zones of
Daley et al. 2009), a state with greater than 80% forest     influence: (1) the riparian management area (RMA), (2)
cover, relatively little current agriculture, industry, or   the local contributing area (LCA), and (3) the watershed
mining and few large urban centers compared to other         (WSH) on a monthly time step. Our primary hypothesis
Northeastern states. Efforts to understand and manage        was that SC would have stronger relationships with land
regional stream salinity levels have often focused on        use in the LCA compared to the WSH and RMA due to
more urban areas where salinity is highest and anthro-       de-icing salt application adjacent to these areas that
pogenic sources of salinity can be more varied and           creates small pollution plumes in adjacent soil and
concentrated. However, investigating background and          groundwater that are diluted as they enter streams and
anthropogenic salinity in headwaters is also critical for    travel downstream.
understanding the full breadth of salinity sources and for
developing cost-effective management efforts to reduce
salt loading across greater watershed areas. In cold         Methods
regions, as paved areas expand and negative impacts
on water quality increase with them, maintaining high-       Site description
quality headwaters will become increasingly important
because of their capacity to dilute downstream inputs        The PEMI River at Plymouth, NH, drains 1613 km2 and
and provide refugia for susceptible biota.                   contains the smaller Baker, Mad, Lost, Beebe, and East
   We investigated the temporal and spatial pattern of       Branch PEMI Rivers. The PEMI basin has an elevation
salinity in the Pemigewasset River (PEMI) watershed in       range of 1600 to 140 m at Plymouth, NH, the lowest
central New Hampshire, a relatively rural watershed          sample point in this study. The basin is predominantly
dominated by national forest, private forest lands, rural    forested with scattered rural residential development
residential housing, and small villages and towns. The       and small towns and minor agricultural operations in
PEMI merges with the Winnipesaukee River to form the         the basin valleys. Much of the upper area of the PEMI
Merrimack River, where water quality is increasingly         basin is part of the White Mountain National Forest,
influenced by larger towns and small cities, often ex-       managed by the U.S. Forest Service and private forest
ceeding USEPA-suggested guidelines for Cl− in its low-       landholders. The total population of the basin upstream
er reaches (Daley et al. 2009). This watershed is well       of Plymouth is approximately 19,000 in 2015, distrib-
suited to address the origins of freshwater salinity be-     uted among the towns of Plymouth, Rumney, Orange,
cause of its relatively simple land use pattern and prev-    Bethlehem, Sandwich, Benton, Orford, Dorchester,
alence of sub-watersheds with few anthropogenic              Piermont, Wentworth, Groton, Warren, Ellsworth,
impacts.                                                     Thornton, Holderness, Lincoln, Campton, Waterville
   This research utilized a monthly synoptic water qual-     Valley, Franconia, and Woodstock. The PEMI basin
ity sampling on the mainstem of the PEMI River and           contains a four-lane interstate and a two-lane parkway
across sub-watersheds with no to low anthropogenic           that is generally parallel the river in the basin valley and
sources of salinity, as well as watersheds with some         numerous paved state and county roads. Outdoor tour-
minor development and roads. We show the spatial             ism drives much of the local economy with three ski
and temporal patterns of specific conductivity (SC, a        resorts, popular scenic auto tour routes, and extensive
measure of salinity) for one ice-free season. In order to    snowmobile corridors. The Hubbard Brook Experimen-
evaluate potential sources or pathways that contribute to    tal Forest (HBEF), located in the center of the basin,
salinization in this upland watershed, we conducted a        receives a mean annual precipitation of 1400 mm, with a
spatial analysis of land use parameters associated with      snow pack generally persisting from December to mid-
potential anthropogenic salinity. We quantified primary      April (Campbell et al. 2010), a period when de-icing
and secondary roads where de-icing salts are utilized        salts are commonly used on primary and secondary
within the PEMI watershed and quantified the                 roads, as well as sidewalks and parking lots. The mean
Environ Monit Assess (2018) 190:523 Page 3 of 12 523
annual temperature at the HBEF is 6 °C (Bailey et al. the density of winter maintained roads (hereafter,
2003). Stream discharge is generally highest during roads) and percent development in each of the water-
spring snowmelt and lowest in mid-summer when sheds and contributing areas. We defined RMA as
ground water contributions to flow dominate land within 100 m of a stream or river and defined
(Campbell et al. 2011). LCA as 0.4 km upslope from the sample location
The geology in the PEMI basin above Plymouth (Fig. 3). For each sample location, we delineated
includes many bedrock outcrops, exposed by the Wis- the watershed area (km2) using a 10-m digital eleva-
consin glaciation approximately 12,000 YBP, and val- tion model (USGS 2009). We calculated road density
leys filled with fluvial deposits (Cotton and Olimpio (km km−2) for the three influence zones using a New
1996). Soils of the basin are dominated by spodosols; Hampshire Department of Transportation dataset that
however, variations of typical spodosols occur in re- identifies primary and secondary roads that are clas-
sponse to hydrologic conditions (Bailey et al. 2014). sified as maintained in winter months (NHDOT
The geologic production of solutes in the HBEF are 2013). Roads that are noted as not maintained, unas-
very low, approaching precipitation concentrations of signed, or private were excluded since we could not
major ions and decreasing as evidenced in Likens and confirm winter maintenance for these roads. We cal-
Buso (2012). The similar geologic environment of the culated the developed land (%) in each watershed
PEMI basin to the HBEF suggests that the background using the National Land Cover Dataset (Homer
weathering potential of geologic materials is similarly et al. 2015). We considered all lands classified as
low. medium and high development in the dataset to be
developed for our analysis, which generally includes
Field and lab methods dense suburban areas, but not rural residential hous-
ing or low-density suburban areas. Both the road and
We measured in situ SC and collected water samples at land cover data sets were utilized without field
13 sampling sites along the mainstem of the PEMI River verification.
and 35 sites on tributaries (Table 1). The sampling This GIS analysis provides six combinations of
locations were selected to cover the length of the PEMI scales and land uses (Fig. 3) for multivariate analysis.
River and as many of its major tributaries as possible We conducted all spatial analyses in ArcMap 10.3
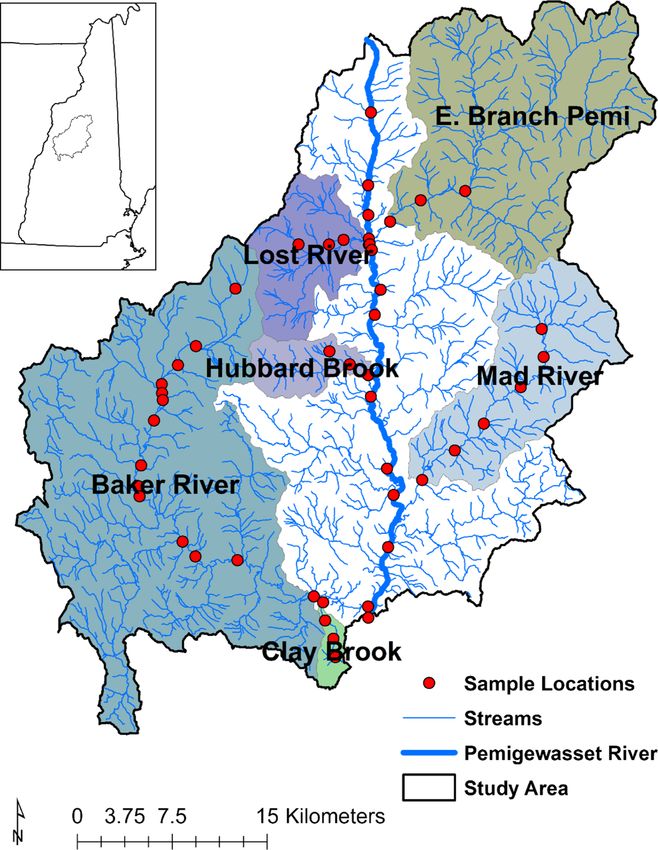
(Fig. 1). In order to ensure that field sampling could (ESRI, Middleton, MA, USA) and, where needed
occur using synoptic methods (< 36 h), sampling loca- given the overlapping nature of the sub-watersheds,
tions were constrained to sites that could be safely developed iterative models using ArcMap Model
accessed near public roads that did not require long Builder.
hikes or traversing larger waters. We conducted field
measurements monthly for one growing season (April–
September 2011) (Fig. 2). Specific conductivity was Statistical analysis
measured in situ using a Yellow Springs Instruments,
Inc. multimeter. Water samples were collected in boro- We tested the relationship between SC and Cl− across all
silicate glass bottles and stored at room temperature of our sites using simple linear regression. We utilized
before analysis. Samples from May, July, and Septem- principle component analysis (PCA) to test for associa-
ber were analyzed for Cl− using ion chromatography tions between two land use variables (roads and devel-
(Metrohm 761) with an inline cellulose membrane filter opment) at three spatial levels (RMA, LCA, and water-
(0.15-μm pore size). Daily runoff data for the PEMI at shed) (Fig. 3) and monthly SC to allow for groupings of
Plymouth, NH (station 01076500), was acquired multicollinear variables to be included in the analysis.
through the US Geological Survey website (USGS Pearson correlations were used to test for associations
2016). between PCA loadings and PEMI River runoff
(mm day−1) at Plymouth, NH, during each monthly
GIS analysis sampling. This analysis was intended to identify the site
attributes that were most strongly associated with SC
To evaluate the potential contribution of land use on levels to develop new hypotheses about the basin’s
SC at each of the 48 sample locations, we quantified water quality and hydrology.523 Page 4 of 12 Environ Monit Assess (2018) 190:523
Table 1 Watershed attributes for the Pemigewasset River above Results
Plymouth, NH
Watershed Number of Area Lowest sample Land use
sample locations (km2) elevation (m)
The land use analysis revealed that 3 of 48 sample
Paradise Brook 1 1.4 417.1
sites had no roads at the LCA, including two sites
Clay Brook 4 11.0 146.1
on Clay Brook and the most downstream site on the
Hubbard Brook 2 33.6 181.9
East Branch of the PEMI (Table 2). Four additional
Lost River 4 77.1 215.2 sites had low road densities with less than
Mad River 6 150.3 187.5 1 km km−2 at the LCA scale. There were no sites
East Branch PEMI 3 297.6 240.2 without roads at the RMA and WSH scale. We
Baker River 15 549.7 141.2 found the highest road densities for all contributing
PEMI above Baker 12 1012.6 157.5 areas in the lower reaches of the PEMI and Baker
PEMI at Plymouth 1 1612.6 140.6 watersheds. As was expected due to a highway
PEMI Pemigewasset River interchange, the most downstream site on the Baker
River had the maximum road density
(14.51 km km−2) for the study at the LCA level.
There were unexpectedly high road densities in the
Fig. 1 Sample locations along
the Pemigewasset River and
tributariesEnviron Monit Assess (2018) 190:523 Page 5 of 12 523
80 0
70 50
Mean Daily Runoff (mm day-1)
60 100
Precipitaon (mm day-1)
50 150
40 200
30 250
20 300
10 350
0 400
PEMI Discharge at Plymouth, NH Sample Dates
Precipitaon at Hubbard Brook
Fig. 2 Sample dates in relation to precipitation and runoff on the Pemigewasset River watershed at Plymouth, NH
LCA at more headwater locations such as the Hub- Specific conductivity
bard Brook and Lost River (Table 2), caused by
small clusters of roads being contained within the Specific conductivity was a strong predictor of Cl−.
LCA. In May, the R2 for the simple linear regression was
Development and road density were lowest at the 0.73 (SC = 2.9 × Cl− + 6.8), while in July, the R2 was
WSH level and were highest at the LCA level 0.91 (SC = 3.5 × Cl− + 19.7) and in September, the
(Table 2), which was presumably caused by small R 2 was 0.87 (SC = 3.1 × Cl − + 14.6). During our
confined areas of development adjacent to and up- study period, the mean SC was lowest during the
stream from the sample location. As with road den- May and August sample when runoff was relatively
sity, development was highest in the lower sites high and highest during the June and July sample
along the PEMI and Baker Rivers with a maximum when runoff was relatively low (Table 3). Across all
in the LCA of 36.8%. Conversely, 19 sample loca- sample locations, SC was highest in the PEMI and
tions had no development in the LCA, indicating Baker Rivers (Fig. 4). Specific conductivity in-
that the LCA is effectively representing a wide creased as watershed size increased in all months
range of land use near the sample points. Develop- except April (Table 4); however, these relationships
ment in the RMA and WSH was an order of mag- were strongest during June, July, and September
nitude lower than the LCA at most sites, indicating sample periods with relatively low discharge
that the LCA is quantifying land use that is not (Figs. 3 and 4).
represented by the more conventionally studied Specific conductivity of our least impacted head-
RMA and WSH. water stream, Paradise Brook, was low with a mean523 Page 6 of 12 Environ Monit Assess (2018) 190:523 Fig. 3 Land use analysis for development (left cells) and roads (right cells) at influence zones including local contributing area (top two cells), riparian management area (middle two cells), and the watershed scale (bottom two cells) of 9 μS cm−1 (± 3.1 SD). However, there were nota- (148 μS cm−1). However, higher SC was recorded ble spikes in SC up to 18 μS cm −1, particularly at more upstream locations on the PEMI River. during the July sampling date when runoff was low. During the low-runoff July sample, the highest SC These results demonstrate the variability in SC in a for all sample locations (172 μS cm−1) and dates headwater stream, likely associated with relative con- was recorded at a site 15 km upstream of the outlet tribution of groundwater, and show that background on the mainstem of the PEMI River. Additional spikes and seasonal trends in SC can occur in an sample locations upstream of Plymouth on the PEMI undeveloped northern New England headwater River had relatively high SC during the July and watershed. April samples (Fig. 4). The mean SC at the lowest elevation sample point in the study on the PEMI River in Plymouth, NH, Land use associations with specific conductivity was 58 μS cm−1 (± 46.8). At this location, SC was lowest during the high-runoff May and August sam- Specific conductivity strongly loaded on the first ple periods (18 and 20 μS cm−1 respectively) and principle component for each of the monthly princi- highest during the lowest runoff in July ple component analyses. Eigenvalues for these first
Environ Monit Assess (2018) 190:523                                                                                Page 7 of 12 523

Table 2 Land use and specific conductivity in major watersheds of the Pemigewasset River

Focus watershed          Percentage developed               Road density (km km−2)             Mean SC (μS cm−1)      SD          Range

                         RMA       LCA          WSH         RMA       LCA        WSH

Paradise Brook           0.0        0.0         0.0         0.13        0.34     0.05           9.3                    3.1         5–14
Clay Brook               0.0        0.0         0.0         0.76        0.00     1.09          28                     10.0        14–43
Hubbard Brook            0.2        0.0         0.1         1.04        6.52     0.52          27                     18.1        14–63
Lost River               0.2        1.4         0.1         0.62        1.71     0.34          38                     27.1        16–88
Mad River                0.3       12.9         0.3         1.26        0.42     0.72          38                     14.3        24–63
East Branch PEMI         0.4       12.6         0.2         0.17        0.00     0.07          21                      8.1        10–31
Baker River              0.4       26.0         0.2         1.29      14.51      0.82          51                     33.5        22–112
PEMI above Baker         0.6       12.8         0.4         0.86        6.21     0.53          47                     30.0        21–99
PEMI at Plymouth         0.5       13.0         0.3         1.05        8.67     0.66          58                     46.8        25–148
Mean of 48 Sites         0.3        5.1         0.2         0.70        2.95     0.39
Max of 48 Sites          2.2       36.8         0.8         2.92      14.51      1.09
# of Sites = Zero        9         19           9           0           3        0

Italicized types denote independent watersheds. RMA riparian management area, LCA local contributing area, WSH watershed, SC specific
conductivity is from lowest sample point on watershed, PEMI Pemigewasset River

components ranged from 3.29 to 3.60, indicating                         Discussion
that the first components represented much of the
variability in the data. Therefore, we elected to only                  Background specific conductivity
present the first principle component due to SC
being the dependent variable of interest (Table 5).                     Understanding how anthropogenic activities affect
For each month, development in the RMA and the                          stream water SC requires establishing a benchmark or
WSH were strongly loaded with SC. In July, road                         background range of SC that can be expected in a
density at the LCA level was loaded with SC, and in                     region. We expected that our most headwater stream
August, road density at the RMA level was loaded                        with no development or roads could be used to establish
with SC. Development at the LCA level did not load                      this benchmark for our study and the region. At our most
strongly with SC during any month. However, dur-                        undeveloped headwater stream in the HBEF, Paradise
ing periods of low flow, loadings were higher for the                   Brook, we observed highest SC during lower runoff
land use variables at the LCA scale, particularly for                   sample periods. However, these increases in SC were
road density (Table 5). Across the monthly sam-                         minor relative to other streams in this study and were
plings, runoff was also negatively correlated (a <                      below 20 μS cm−1 for all sample dates. Long-term
0.05) with loadings for road density and develop-                       monitoring in the HBEF by Likens and Buso (2012)
ment and LCA scales (Table 6).                                          revealed that SC in precipitation and water in a reference

Table 3 Temporal summary of specific conductivity and discharge at the Pemigewasset River

                                   April              May              June             July            August               September

Mean SC                            24                 18               41               65              21                   38
Median SC                          24                 20               41               70              21                   40
SD                                 11.8               6.7              17.2             33.6            6.0                  13.8
Max                                70                 32               82               172             35                   66
                    −1
Discharge (mm day )                6.2                5.9              1.1              0.2             7.1                  1.0

Maximum SC values occurred at three sample points on the Pemigewasset River upstream of Plymouth, NH. N = 48. Summary statistics
include sites that are nested
523 Page 8 of 12 Environ Monit Assess (2018) 190:523
Fig. 4 Specific conductivity across the Pemigewasset River Watershed and tributaries for one ice-free season
stream adjacent to Paradise Brook had mean annual they project that the mean annual precipitation EC will
averages below 10 μS cm−1 and had a trend of decreas- approach 3 μS cm−1 in this region and the mean annual
ing electrical conductivity (EC) since the 1970s. These stream water EC will approach 5 μS cm−1 over the next
authors suggest the EC will continue to stay at these one to two decades in the HBEF due to recovery from
levels and may even decrease in non-impacted streams. historic acid deposition. Specific conductivity values
Through analysis of 40+-year datasets from the HBEF, and trends in streams at the HBEF are likely at the low
range of a potential regional background benchmark for
SC. The watersheds in the HBEF may have different
Table 4 Pearson correlations between specific conductivity and
watershed area land use histories and geologic weathering rates com-
pared to other regional watersheds, which may result in
r (p value) lower SC relative to the region (Kaushal et al. 2018).
Griffith (2014) developed regional reference condi-
April 0.057 (0.732)
tions for SC based on 25th percentiles of first- through
May 0.320 (0.027)
fourth-order streams in third-order ecoregions using an
June 0.568 (< 0.001)
extensive list of national datasets. Much of New Hamp-
July 0.682 (< 0.001)
shire and our study area is classed as Northeastern
August 0.238 (0.102)
highlands ecoregion which had a 25th percentile for
September 0.535 (< 0.001)
SC of < 46 μS cm−1 in Griffith (2014). The 25th per-
n = 48 centile of all measured streams in the ecoregion includesEnviron Monit Assess (2018) 190:523 Page 9 of 12 523
Table 5 Eigenvalues and eigenvectors for principle component analysis addressing potential land use factors that associate with specific
conductance in the Pemigewasset River watershed, New Hampshire
April May June July August September
Eigenvalue 3.57 3.40 3.50 3.40 3.29 3.60
Percentage variability explained 51.0 48.6 49.95 48.64 46.94 51.30
Road density (RMA) 0.346 0.398 0.320 0.303 0.408 0.316
Road density (LCA) 0.335 0.363 0.390 0.411 0.379 0.380
Road density (watershed) 0.133 0.250 0.160 0.146 0.283 0.163
Development (RMA) 0.475 0.424 0.454 0.458 0.415 0.449
Development (LCA) 0.327 0.328 0.349 0.356 0.338 0.350
Development (watershed) 0.455 0.417 0.443 0.452 0.400 0.438
Specific conductance 0.459 0.431 0.442 0.421 0.405 0.461
Italicized eigenvectors indicate significance at 0.40 threshold. RMA riparian management area, LCA local contributing area. Only first
principle component is presented because specific conductance loaded on first component during each month
some streams with paved roads and development in their Land use signature
watersheds; hence, SC for the 25th percentile is likely
higher than a truly undisturbed reference. Our sites Our land use analysis selected development as a stron-
generally fall below this benchmark, with only seven ger predictive variable for SC when compared to roads.
of our sample locations having a mean SC above this Similar results were also reported by Daley et al. (2009)
threshold, all of which were on are the mainstem of the for southeastern New Hampshire streams. They found
PEMI and the Baker Rivers. The uppermost sample sites that percent impervious surface was more strongly as-
on our independent tributaries had mean SC values sociated with Na+ and Cl− compared to roads. This
generally well below this threshold with the upper sam- association of stream water SC with metrics describing
ple points on the Mad River, Clay Brook, Hubbard the total development in a watershed can potentially be
Brook, Baker River, and the East Branch of the PEMI caused by de-icing salt application on parking lots and at
all having a mean SC below 20 μS cm−1. This suggests private residences (e.g., driveway, walkways) that
that much of our study area can still be considered a SC would not be represented by road density metrics. In a
reference for the greater ecoregion. However, at down- rural stream in New York State, Kelly et al. (2008)
stream river sites, we see temporary increases of SC up estimated 83% of Cl− was from road salt and 8% was
to four times this background threshold. This could from parking areas suggesting that contributions from
reduce the capacity of this headwater watershed to dilute parking lots can be important. However, in New Hamp-
higher salinity levels that are found in more urban shire and elsewhere in the Northeast, there is little ac-
downstream locations. counting of the amount of salt that is applied by
Table 6 Unrotated loadings for first principle components and correlation with runoff
April May June July August September The Pearson r p value
Road density (RMA) 0.654 0.735 0.598 0.560 0.739 0.599 0.92 0.0094
Road density (LCA) 0.633 0.670 0.730 0.758 0.687 0.720 − 0.87 0.0258
Road density (watershed) 0.252 0.461 0.299 0.269 0.512 0.309 0.63 0.1754
Development (RMA) 0.898 0.782 0.850 0.844 0.753 0.851 − 0.43 0.3906
Development (LCA) 0.617 0.606 0.652 0.657 0.613 0.664 − 0.96 0.0022
Development (watershed) 0.859 0.769 0.829 0.834 0.724 0.830 − 0.57 0.2381
Specific conductance 0.868 0.795 0.826 0.776 0.734 0.874 − 0.28 0.5823
Runoff (mm d−1) 6.15 5.89 1.05 0.23 7.05 0.96
Italicized p values indicate significance at alpha = 0.05. RMA riparian management area, LCA local contributing area523 Page 10 of 12 Environ Monit Assess (2018) 190:523
homeowners, business owners, and small companies stored in shallow subsurface waters. In the aforemen-
offering plowing and de-icing services. In New Hamp- tioned study of a rural stream in New York State, Kelly
shire, there is currently a general education campaign to et al. (2008) found increases in summer Cl− concentra-
reduce the overuse of de-icing salts on roads at the tions and reported a lag effect, with mass balances
government agency level through programs such as indicating that the salt being released was from previous
voluntary state applicator certifications. However, it is build-up and storage. In a study that investigated Cl−
unknown if education campaigns are reaching citizens above and below road salt applications in the
and small de-icing operators who manage residential Adirondack Mountains of New York, Demers and
and commercial driveways, sidewalks, and parking lots. Sage (1990) found elevated Cl− levels in tributary
Nevertheless, the use of de-icing salts by these groups streams for 4–6 months after the last salt application.
undoubtedly contributes to the total loads in some areas In a southern New Hampshire stream, Harte and
in, which may help explain the strong relationship we Trowbridge (2010) found that EC was highest during
found between SC and development. baseflow and suggested it was due to advective flow of
high EC groundwater entering surface waters. Kaushal
Specific conductivity flowpaths et al. (2005) also found elevated Cl− throughout the year
in more urban and suburban streams and suggested that
Our hypothesis that there would be a relationship be- this was due to gradual accumulations of Cl− in ground
tween SC and land use at the LCA level was not sup- water. Understanding how these potential pollutant
ported by our data. We expected that application of de- flowpaths, storage, and release mechanisms function in
icing salts in areas just upstream of our sample locations a headwater watershed is critical for developing de-icing
would drive this relationship. In contrast, we found that salt management strategies that can be used to reduce
the strongest and most consistent associations between salinity in these upland watersheds.
SC and land use were at the RMA level and the WSH
level. This may be due to the sporadic timing of spring
thaws which drive timing of spring flushes of de-icing Conclusions
salt into local waterways. Localized contributions of de-
icing salts may have previously runoff or entered Specific conductivity in the majority of our mainstem
groundwater before our monthly sampling could safely and tributary sites was below regional background
occur. We also identified a negative relationship be- levels for the Northeastern highlands ecoregion. How-
tween runoff and PCA loadings for both road density ever, individual sample SC was above background
and development at the LCA scale (Table 4), suggesting levels at some sites in the mainstem of the PEMI and
there may be a seasonal or runoff-based factor that is Baker Rivers and even some smaller tributaries had
controlling the relationship between land use and SC. individual samples above background. If these increases
We found the highest SC in summer months during in SC are persistently above background in these head-
baseflow conditions, many months after de-icing salts water watersheds, it means they have little capacity to
were washed off treated surfaces. This suggests that dilute higher SC levels at more downstream locations.
salinity sources such as de-icing salts are entering sub- The goal of this study was to begin the process of
surface pathways or groundwater and are returning to understanding the sources of salinity and the pollutant
surface waters at downstream locations through return transport pathways in this headwater system. We hy-
flow, springs, or groundwater meeting a gaining stream. pothesized that development and roads in LCAs would
These potential pollutant pathways have been reported be associated with SC because of de-icing salt being
by other authors in northern regions. In an early study, applied in localized areas near streams and river cross-
Kunkle (1972) found that EC in one Vermont stream ings. Conversely, our study found that development and
peaked in summer during baseflow and suggested that roads in the LCA were not strongly associated with SC.
Cl− entered groundwater and was released during Higher loadings for the LCA during low runoff provides
baseflow. In a study using a mass balance approach, some evidence that the LCA could be functioning as a
Howard and Haynes (1993) found that only 55% of road source of SC during low-runoff periods. It is also pos-
salt was being exported annually from a stream in the sible that our sampling intensity could have missed
Toronto, Canada area, while the remainder was being flushes of salt from LCAs into surface waters. HighEnviron Monit Assess (2018) 190:523 Page 11 of 12 523
SC levels in the drier summer months also indicate the Demers, C. L., & Sage, R. W. (1990). Effects of road deicing salt
on chloride levels in four adirondack streams. Water, Air, &
potential subsurface transport and storage of salts in this
Soil Pollution, 49, 369–373.
system. Future research should address this potential for Evans, D. M., Zipper, C. E., Donovan, P. F., & Daniels, W. L.
both temporary flushes of road salt into surface waters (2014). Long-term trends of specific conductance in waters
and for salts to percolate into groundwater. Identifying discharged by coal-mine valley fills in central Appalachia,
these local hydrologic pollutant pathways that explain USA. Journal of the American Water Resources Association,
50(6), 1449–1460.
the patterns that we have observed will aid in develop- Gardner, K. M., & Royer, T. V. (2010). Effect of road salt appli-
ing de-icing management plans that can reduce impacts cation on seasonal chloride concentrations and toxicity in
on freshwater biota during low summer flows when south-central Indiana streams. Journal of Environmental
surface water temperatures tend to be high and during Quality, 39, 1036–1042.
Godwin, K. S., Hafner, S. D., & Buff, M. F. (2003). Long-term
spring emergence when many biota are beginning to
trends in sodium and chloride in the Mohawk River, New
increase metabolism but their movement may be York: the effect of fifty years of road-salt application.
constrained by ice. Environmental Pollution, 124, 273–281.
Griffith, M. B. (2014). Natural variation and current reference for
specific conductivity and major ions in wadeable streams of
Acknowledgements The authors wish to acknowledge Kristin the conterminous USA. Freshwater Science, 33(1), 1–17.
Brandt for field and lab contributions and Scott Bailey for reviews Harte, P. T., & Trowbridge, P. R. (2010). Mapping of road-salt-
of methods and manuscript drafts. The quality of this manuscript contaminated groundwater discharge and estimation of chlo-
has been improved through the comments of anonymous ride load to a small stream in southern New Hampshire,
reviewers. USA. Hydrological Processes, 24, 2349–2368.
Homer, C. G., Dewitz, J. A., Yang, L., Jin, S., Danielson, P., Xian,
G., Coulston, J., Herold, N. D., Wickham, J. D., & Megown,
K. (2015). Completion of the 2011 National Land Cover
Database for the conterminous United States—representing
References a decade of land cover change information. Photogrammetric
Engineering and Remote Sensing, 81(5), 345–354.
Howard, K. W., & Haynes, J. (1993). Groundwater contamination
Bailey AS, Hornbeck JW, Campbell JL, Eagar C. (2003). due to road de-icing chemical-salt balance implications.
Hydrometeorological database for Hubbard Brook Geoscience Canada., 20(1), 1–8.
Experimental Forest: 1955–2000. US For Serv Gen Tech Kaushal, S. S., Groffman, P. M., Likens, G. E., Belt, K. T., Stack,
Rep; 305. Available: http://www.treesearch.fs.fed. W. P., Kelly, V. R., Band, L. E., & Fisher, G. T. (2005).
us/pubs/5406. Accessed 6 February 2018. Increased salinization of fresh water in the northeastern
Bailey, S. W., Brousseau, P. A., McGuire, K. J., & Ross, D. S. United States. Proceedings of the National Academy of
(2014). Influence of landscape position and transient water Sciences of the United States of America, 102(38), 13517–
table on soil development and carbon distribution in a steep, 13520.
headwater catchment. Geoderma, 226–227, 279–289. Kaushal, S. S., Likens, G. E., Pace, M. L., Utz, R. M., Haq, S.,
Campbell, J. L., Ollinger, S. V., Flerchinger, G. N., Wicklein, H., Gorman, J., & Grese, M. (2018). Freshwater salinization
Hayhoe, K., & Bailey, A. S. (2010). Past and projected future syndrome on a continental scale. Proceedings of the
changes in snowpack and soil frost at the Hubbard Brook National Academy of Sciences, 201711234, E574–E583.
experimental forest, New Hampshire, USA. Hydrological https://doi.org/10.1073/pnas.1711234115.
Processes, 24, 2465–2480. Kelly, V. R., Lovett, G. M., Weathers, K. C., Findlay, S. E. G.,
Campbell, J.L., Driscoll, C.T., Pourmokhtarian, A., Hayhoe, K. Strayer, D. L., Burns, D. J., & Likens, G. E. (2008). Long-
(2011). Streamflow responses to past and projected future term sodium chloride retention in a rural watershed: legacy
changes in climate at the Hubbard Brook Experimental effects of road salt on streamwater concentration.
Forest, New Hampshire, United States. Water Resources Environmental Science and Technology, 42(2), 410–415.
Research, 47, W02514. https://doi.org/10.1029/2010 Kelting, D. L., Laxson, C. L., & Yerger, E. C. (2012). Regional
WR009438. analysis of the effect of paved roads on sodium and chloride
Cotton JE, Olimpio JR. (1996). Geohydrology, yield, and water in lakes. Water Research, 46(8), 22749–22758.
quality of stratified-drift aquifers in the Pemigewasset River Kunkle, S. H. (1972). Effects of road salt on a Vermont stream.
basin, central New Hampshire [Internet]. Report No.: 94– Journal of American Water Works Association, 64(5), 290–
4 0 8 3 . Av a i l a b l e : h t t p : / / p u b s . e r. u s g s . 295 Published by: American Water Works Association Stable
gov/publication/wri944083. Accessed 6 of February 2018. URL : http://www.jstor.org/.
Daley, M. L., Potter, J. D., & McDowell, W. H. (2009). Likens, G. E., & Buso, D. C. (2012). Dilution and the elusive
Salinization of urbanizing New Hampshire streams and baseline. Environmental Science and Technology, 46(8),
groundwater: effects of road salt and hydrologic variability. 4382–4387.
Journal of the North American Benthological Society, 28, NHDOT (2013). New Hampshire Department of
929–940. Transportation. NH Public Roads (GIS Shapefile).523 Page 12 of 12 Environ Monit Assess (2018) 190:523
Av a i l a b l e a t h t t p : / / w w w. g r a n i t . u n h . c h e m i c a l s . h t t p s : / / w w w . e p a .
edu/data/downloadfreedata/category/databycategory.html gov/dwstandardsregulations/secondary-drinking-water-
Ramakrishna, D., & Viraraghavan, T. (2005). Environmental im- standards-guidance-nuisance-chemicals. Accessed 19
pact of chemical deciers—a review. Water, Air, and Soil January 2018.
Pollution, 166, 49–63. USGS (2009). U.S. Geological Survey. National elevation dataset
Rosenberry, D. O., Bukaveckas, P. A., Buso, D. C., Likens, G. E., (NED) (1/3 arc second—10 meter resolution). https://viewer.
Shapiro, A. M., & Winter, T. C. (1997). Movement of road nationalmap.gov/advanced-viewer/. Accessed 19 January
salt to a small New Hampshire lake. Water, Air, and Soil 2018.
Pollution, 109, 179–206. USGS (2016). U.S. Geologic Survey. Daily data. https://waterdata.
USEPA (2006). U.S. Environmental Protection Agency. National usgs.gov/nwis/dv/?referred_module=sw. Accessed 19
recommended water quality criteria. 4304T. https://www.epa. January 2018.
gov/wqc/national-recommended-water-quality-criteria- Williams, W. (1987). Salinization of rivers and streams: an impor-
aquatic-life-criteria-table. Accessed 9 August 2018. tant environmental hazard. Ambio Ambocx, 16(4), 180–185.
USEPA (2018). U.S. Environmental Protection Agency. Williams, W. D. (2001). Anthropogenic salinization of inland
Secondary drinking water standards: guidance for nuisance waters. Hydrobiologia, 466, 329–337.You can also read