Impact of detention dams on the probability distribution of floods
←
→
Page content transcription
If your browser does not render page correctly, please read the page content below
Hydrol. Earth Syst. Sci., 25, 4231–4242, 2021
https://doi.org/10.5194/hess-25-4231-2021
© Author(s) 2021. This work is distributed under
the Creative Commons Attribution 4.0 License.

Impact of detention dams on the probability distribution of floods
Salvatore Manfreda1 , Domenico Miglino1 , and Cinzia Albertini1,2
1 Dipartimento   di Ingegneria Civile, Edile e Ambientale, Università degli Studi di Napoli Federico II, 80125 Naples, Italy
2 Dipartimento   di Scienze Agro Ambientali e Territoriali, Università degli Studi di Bari Aldo Moro, 70126 Bari, Italy

Correspondence: Salvatore Manfreda (salvatore.manfreda@unina.it)

Received: 25 January 2021 – Discussion started: 22 February 2021
Revised: 7 June 2021 – Accepted: 8 June 2021 – Published: 30 July 2021

Abstract. Detention dams are one of the most effective prac-       1   Introduction
tices for flood mitigation. Therefore, the impact of these
structures on the basin hydrological response is critical for
flood management and the design of flood control structures.       During the last decades, the growing number of hydrologi-
With the aim of providing a mathematical framework to in-          cal extremes have raised economic losses and risk percep-
terpret the effect of flow control systems on river basin dy-      tion at the global scale (Peduzzi, 2005; Di Baldassarre et al.,
namics, the functional relationship between inflows and out-       2010; Winsemius et al., 2016). The impact of natural dis-
flows is investigated and derived in a closed form. This al-       asters has been quantified in a recent study by Wallemacq
lowed the definition of a theoretically derived probability dis-   and Below (2015), which is based on the Emergency Events
tribution of the peak outflows from in-line detention basins.      Database (EM-DAT). According to EM-DAT, flooding im-
The model has been derived assuming a rectangular hydro-           pacted on nearly 2.5 billion people in the period 1994–
graph shape with a fixed duration and a random flood peak.         2013. A more recent study by Munich Re (NatCatSERVICE,
In the present study, the undisturbed flood peaks are assumed      Munich Reinsurance Company (MunichRe), 2020) reported
to be Gumbel distributed, but the proposed mathematical for-       3798 flash flood events that produced economic losses of
mulation can be extended to any other flood-peak probability       about USD 592 billion and killed around 100 000 people
distribution. A sensitivity analysis of parameters highlighted     worldwide during the last two decades (2000–2018).
the influence of detention basin capacity and rainfall event          In this context, climate change and anthropic activities are
duration on flood mitigation on the probability distribution       probably accelerating the number of extremes (Fischer and
of the peak outflows. The mathematical framework has been          Knutti, 2016; Papalexiou and Montanari, 2019). In fact, these
tested using for comparison a Monte Carlo simulation where         two factors are significantly modifying river basin hydrology
most of the simplified assumptions used to describe the dam        (Di Baldassarre et al., 2017), which now requires renewed
behaviours are removed. This allowed demonstrating that the        methods and techniques. Therefore, the need to find appro-
proposed formulation is reliable for small river basins char-      priate measures for flood hazard prevention and mitigation is
acterized by an impulsive response. The new approach for           becoming more and more pressing.
the quantification of flood peaks in river basins characterized       Flood risk management is a complex challenge for hydrol-
by the presence of artificial detention basins can be used to      ogists that need to identify dynamic solutions for flood miti-
improve existing flood mitigation practices and support the        gation. Plate (2002) underlined the need to update flood mit-
design of flood control systems and flood risk analyses.           igation plans according to the changing conditions (e.g. cli-
                                                                   mate, populations, land use). Hence, the design of flood miti-
                                                                   gation systems requires rapid methodologies to evaluate sce-
                                                                   narios and intervention measures and obtain effective flood
                                                                   risk management strategies (Franzi et al., 2016).
                                                                      One of the most effective actions for the attenuation of
                                                                   peak discharges is represented by a detention basin system
                                                                   or coordinated reservoir operations (e.g. UDFCD, 2016; Ja-

Published by Copernicus Publications on behalf of the European Geosciences Union.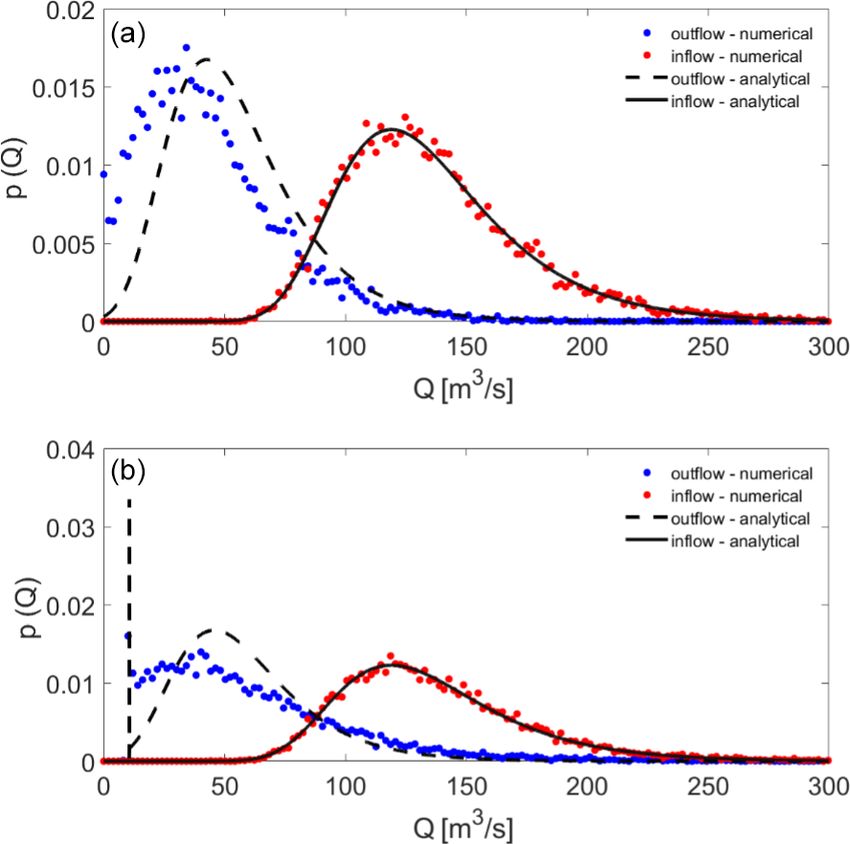
4232                                 S. Manfreda et al.: Impact of detention dams on the probability distribution of floods

cob et al., 2019; Seibert et al., 2014). The proper design of a    conditions. When water levels rise above the spillway, the
detention basin is an extremely complex task given the large       dam restricts the amount flowing through the opening, de-
number of factors that are involved in the decision process:       creasing peak flow. Since detention dams minimally affect
technical engineering features of the structure, site selection    rivers’ natural flows, under normal conditions negative en-
and environmental characteristics. For this reason, Bellu et       vironmental and socioeconomic impacts, such as sediment
al. (2016) proposed an innovative method to optimize the di-       accumulation, restriction of water flow to downstream com-
mensioning and site selection of a flood mitigation system.        munities and ecosystems, and breaching during very extreme
The method follows three steps that include a preliminary          flood events, can be minimized or avoided altogether.
sizing, a site location and optimization according to environ-        The schematization of the detention dam has been simpli-
mental objectives. Nevertheless, the sizing of the detention       fied with the aim to obtain a mathematical description of the
volume is based, in most of the cases, on a given design flood     outflows associated with a given hydrograph. In particular,
event neglecting the random nature of the phenomena and the        we assumed that the dam body has two openings: a low-level
impact of the structure on a large spectrum of events.             opening at the basement and a crest spillway. The former is
   The flood attenuation caused by the presence of artificial      assumed to let pass the flow below a given control value,
reservoirs is influenced by hydrologic and hydraulic factors,      while the latter starts functioning only when the volume of
such as flood wave shape and duration, as well as by the           the dam is completely filled up to the crest level. Thereafter,
storage capacity and geometric parameters of the detention         the water starts to flow from both the openings, and the con-
basin. Therefore, it is crucial to build a mathematical scheme     trol is mainly exerted by the basin volume above the emer-
able to interpret the functional relationships, even in a sim-     gency spillway (crest level). This scheme can be described
plified form, among the mentioned variables.                       in closed form that may help the construction of a derived
   With this aim, the present article introduces a theoretically   probability distribution of the outflow from a detention dam.
derived probability distribution (TDD) of detention basin
outflows, which is obtained assuming the incoming flood            2.1   The hydraulic characteristics of the problem
peaks randomly distributed and characterized by rectangu-
lar hydrographs of fixed duration (see e.g. Manfreda et al.,       Let us first introduce the key equations controlling the dy-
2018). In the present case, flood distribution is assumed to       namics of a system like the one under study. The first equa-
be Gumbel for the sake of simplicity, but the proposed ap-         tion to introduce is represented by the stage-storage capacity
proach can be applied to any flood-peak probability distribu-      curve which is able to describe the morphology of the gorge
tion. Performances of the proposed method are investigated         closed by a specific dam. The function is generally repre-
under different configurations and are tested with a numerical     sented by a power law:
simulation of flood mitigation. This method can be applied         W (h) = w1 hn ,                                             (1)
to improve existing flood mitigation approaches and support
the design of flood control systems, flood risk and damage         where W (h) [m3 ] is the water storage of detention basin, w1
analyses.                                                          [m3−n ] is the parameter of the stage-storage capacity curve,
   This paper is organized as follows: in Sect. 2, the con-        h [m] is the water level in the reservoir and n [–] is the expo-
ceptual scheme of the detention basin adopted to derive the        nent influenced by the shape of the control volume. The ex-
mathematical formulation of outflows is described. Further-        ponent ranges between 1 and 4.5, where 1 is associated with a
more, the hydraulic concepts and assumptions to analytically       prismatic geometry with vertical surrounding walls and 4.5 is
compute the derived probability distribution of the peak out-      associated with a more complex morphology closed by more
flows are introduced; in Sect. 3, the proposed methodology is      gentle lateral slopes.
tested under different reservoir configurations and compared          The streamflow of the river system reaching the reservoir
with the results of the numerical simulations, and a brief de-     is altered by it based on the hydraulic characteristics of the
scription of the numerical model is also provided; in Sect. 4      dam. The outflow will be controlled by the amount of water
main findings and results are discussed.                           accumulated in the system according to the continuity equa-
                                                                   tion:
                                                                   dW (t)
2   The conceptual scheme                                                 = Qin (t) − Qout (t),                                (2)
                                                                    dt
In-line detention dams (also known as flow-through dams)           where Qin (t) is the incoming flux and Qout (t) is the outflow
are constructed solely with the purpose of flood control and       from the reservoir.
mitigation of flood risks in downstream communities and               The outflow can be computed using the traditional for-
ecosystems. Unlike reservoir dams, which are primarily built       mulation of hydraulics based on the variation of the wa-
for water storage or power generation, the spillway (open-         ter level, h, in the reservoir, which can be derived from the
ing) is located at the same height as the riverbed level, al-      stage-storage capacity curve (Eq. 1) and continuity equation
lowing the river to continue its natural flow under normal         (Eq. 2). In particular, we can assume that the outflow for a

Hydrol. Earth Syst. Sci., 25, 4231–4242, 2021                                        https://doi.org/10.5194/hess-25-4231-2021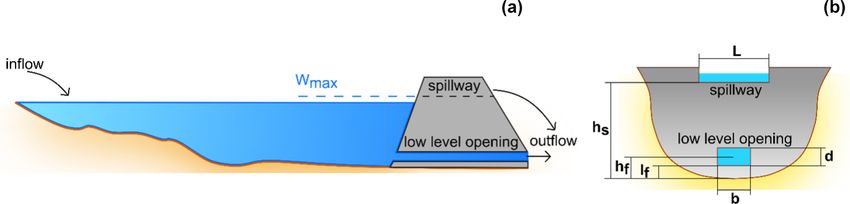
S. Manfreda et al.: Impact of detention dams on the probability distribution of floods 4233
Figure 1. Sketch of a detention basin section with a basin capacity Wmax , composed of a low-level opening, with an area equal to the product
between b and d, and a crest spillway of length L and height hs .
simple scheme with two openings (the low-level opening and
the emergency spillway) and the characteristics described in
Fig. 1 may vary according to four different discharge laws ex-
pressed as a function of the reservoir water level stage. The
outflow can be described as follows:
0, 0 < h ≤ l
f
µ b√2g(h − l ) 32 , l < h ≤ h
s f f f
Qout = √ 1 (3)
µf A 2g(h − hf ) 2 , hf < h ≤ hs
√ 1 √ 3
µf A 2g(h − hf ) 2 + µs L 2g(h − hs ) 2 , h > hs ,
Figure 2. Example of flood mitigation induced by the presence of
where µf [–] is the coefficient of discharge of the low-level
a detention basin obtained via numerical simulation. Other parame-
opening at the basement (suggested values may range be- ters are b = 1 m; d = 1 m; n = 1.9; hf = lf +d/2; hs =4; µf = 0.85;
tween 0.6 (assuming a thin sharp edge) and 0.8 (assuming a µs = 0.385; L = 3 m, Wmax = 15 000 m3 .
wall with thickness 2 times larger than the opening height)),
A [m2 ] is the area of the low-level opening (i.e. the product
of the opening width, b [m], and the minimum dimension be- For the scope of the present study, the outflow has been
tween the top of the flow surface at the opening exit and the simplified through the following set of equations:
bottom of the opening), µs [–] is the coefficient of discharge
of the spillway crest (suggested values range around 0.3–0.4 Qin , 0 < h ≤ hf
Qout = Qc , hf < h ≤ hs (4)
based on the geometry of the weir), lf [L] is the height of √ 1 √ 3
µf A 2g(h − hf ) 2 + µs L 2g(h − hs ) 2 , h > hs ,
the low-level opening at the basement, L [m] is the effected
crest length, hf [m] is the height of the barycentre of the low- where Qc is the control value of discharge that is computed
level opening, hs [m] is the height of the spillway crest, and using the discharge equation of the submerged opening and
g [m/s2 ] is the acceleration due to gravity. assuming h = hs .
The above expression includes the three main configura- Assuming a rectangular hydrograph of the incoming flow,
tions that may occur in the proposed scheme with the in- it is possible to derive the peak flow associated with an in-
crease of the water level stage in the reservoir. A detailed coming flood peak. Following the simplifying assumption
description of the scheme proposed along with graphical in- given in Eq. (4), the outflow is not affected by the presence
dication of the parameters meaning is given in Fig. 1. In par- of the dam for lower streamflow values, while it is modified
ticular, the opening at the bottom does not exert a significant when the inflow exceeds the control discharge. In particular,
control on the incoming flow as long as the water level does the outflow remains almost constant as long as the reservoir
not generate a submergence of the opening (i.e. as long as is filled and, thereafter, it is controlled by the crest spillway.
h ≤ hs ). The water flow starts to be limited when the water In this last configuration, it is possible to use the linear reser-
stage reaches the value hf , after which the opening is sub- voir concept for the water volume accumulated above the el-
merged. This allows filling the storage volume of the reser- evation of the crest spillway.
voir up to the level of the crest spillway. After this stage, the In order to estimate the peak flow associated with a spe-
reservoir tends to operate a mitigation that is influenced by cific rectangular hydrograph of constant discharge equal to
the water storage capacity of the reservoir above the crest Qmax , we should recall the expression of the peak flow gen-
level and the hydraulic characteristics of the spillway. An ex- erated by a simple linear reservoir, which can be described as
ample of flood mitigation obtained via numerical simulation follows:
is given in Fig. 2, which provides a comparison between a
synthetic hydrograph and the outflow from a detention dam. Qlam = Qmax (1 − e−tp /k ), (5)
https://doi.org/10.5194/hess-25-4231-2021 Hydrol. Earth Syst. Sci., 25, 4231–4242, 2021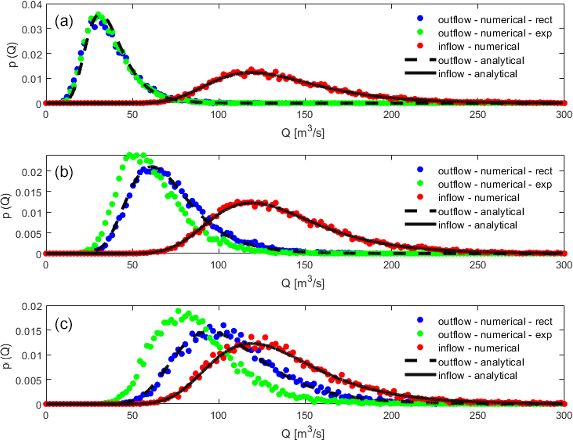
4234                                 S. Manfreda et al.: Impact of detention dams on the probability distribution of floods

where tp [s] is the event duration, and k [s] is the delay con-    Estimation of the event duration
stant of the conceptual linear reservoir.
   The above equation should be modified, in the present           The assumption of a rectangular hydrograph may produce
case, considering that the flood event should fill the dam wa-     a significant overestimation of the flood volume. Therefore,
ter storage capacity (or detention basin) before reaching the      the parameter tp should be defined accounting for the real
crest spillway. Therefore, the crest spillway will be activated    volume associated with a realistic flood hydrograph. In this
only after a time:                                                 context, we can rely on the flow duration frequency reduction
                                                                   curve (FDF) proposed by the NERC (Natural Environment
                Wmax                                               Research Council, 1975), which describes the maximum av-
tfilling =                ,
             (Qmax − Qc )                                          erage discharge q(D) as a function of the event duration D:
                                                                                    D
where Wmax is the volume of water accumulated in the dam           q(D) = Qmax e− ω ,                                          (9)
at the crest level hs .
   When the volume below the spillway crest is totally filled,     where ω represents the characterizing basin time response
the crest spillway starts functioning for discharge values         that is frequently associated with the lag time of the river
above the control discharge that is released at the bottom.        basin.
Therefore, the peak outflow, Qp,out , assumes the following           Adopting the above formulation, Fiorentino (1985) sug-
form:                                                              gested a simple form of synthetic hydrograph redistributing
                                                                   the volume symmetrically with respect to the time of the
Qp,out = Qc + (Qmax − Qc )                                         peak. This leads to the following form of hydrograph:

                           Wmax                                                     |t|
         1 − Exp − tp −                /keq ,               (6)    q (t) = Qmax e−2 ω .                                       (10)
                        (Qmax − Qc )
                                                                   Based on the above formulation, it is possible to impose that
where keq [s] is the equivalent delay constant of the concep-      the duration tp of the equivalent rectangular event has the
tual reservoir associated with the outflow. This parameter can     same volume of the synthetic hydrograph of Eq. (10) in the
be derived exploiting the characteristics of the spillway and      temporal window of ω around the peak flow. This led to the
the stage-storage capacity curve. In particular, according to      following equivalence:
the linearity concept, the two functions should have the same
exponent. Under such a hypothesis, the parameter keq can be               (e − 1) ∼
                                                                   tp =          ω = 0.632 ω.                                 (11)
estimated as                                                                 e
           w2                                                      Given the above assumption, the term tp will be named equiv-
keq =       √ ,                                             (7)
        µs L 2g                                                    alent event duration from now on.

where w2 is the coefficient of the rescaled stage-storage ca-      2.2    Functional relationship between the incoming
pacity curve above the crest level. Such a parameter should               discharge and the outflow
be computed in order to get the best approximation of the
function describing the volumes above the mentioned level,         The possibility to identify the analytical relationship between
hs imposing a coefficient n equal to 1.5 for the rescaled stage-   two processes where one represents the stochastic forcing
storage capacity curve (referred to the stage-storage capacity     allows determining the derived probability distribution of
curve above the crest level). With this aim, the parameter can     the variable. This approach has been used several times for
be computed by comparing the two functions and imposing            flood maxima (Eagleson, 1972; De Michele and Salvadori,
that they are equal in a point hm which is representative of the   2002; Gioia et al., 2008), soil moisture (Rodríguez-Iturbe
range of variability of the water level above the crest level.     and Porporato, 2007; Manfreda and Fiorentino, 2008), and
                                                                   scour process (Manfreda et al., 2018). In the present case, the
        W1 (hs + hm )n − W1 hns                                    methodology has been applied to the laminated flood peak.
w2 =                            .                           (8)       With this aim, it is critical to identify the inverse func-
                 h1.5
                  m
                                                                   tion describing the laminated flood peaks as a function of the
Within the present article, we assumed the parameter hm was        maximum floods reaching the detention dam. Equation (6)
set equal to hs .                                                  cannot be inverted in a closed form. Therefore, the function
   These assumptions allowed deriving a functional relation-       has been approximated using a Taylor expansion of the first
ship between the reservoir inflow and outflow, which can be        order about the point 2Qc + Wtmax p
                                                                                                        , where Qc + Wtmaxp
                                                                                                                             repre-
used to invert the function with respect to the incoming flow      sents the incoming discharge that leads to overspilling. This
and associate a probability with each flow discharged value        approximation allows defining a closed form of the inverse
by exploiting the theory of derived distributions (Benjamin        function, which represents a good approximation for theoret-
and Cornell, 2014).                                                ical derivation.

Hydrol. Earth Syst. Sci., 25, 4231–4242, 2021                                       https://doi.org/10.5194/hess-25-4231-2021
S. Manfreda et al.: Impact of detention dams on the probability distribution of floods 4235
Given the above approximations, it is possible to derive the 3 Applications
inverse function of the peak discharge function of the peak
outflow. This equation can be obtained mathematically by in- 3.1 Examples of application of the TDD of the
verting Eq. (6) and exploiting the parametrization introduced detention basin outflows under different
above. The inverse function assumes the following form: configurations
Qmax = g −1 Qp,out
Wmax tp
In order to explore the behaviour of the proposed for-
tp
Wmax 2Qc tp + Wmax − keq Qc Qc tp + Wmax e keq (Qc tp +Wmax ) + keq Qc tp + Wmax Qp,out e k mulation, we investigated the effects of different types of
= Wmax tp
.
tp
keq Qc tp + Wmax e k + tp Wmax − keq Qc tp + Wmax e keq (Qc tp +Wmax )
parametrization on the derived distribution starting from a
(12) single distribution of floods. In Fig. 3, the influence of the
storage capacity and hydrograph duration on the outflow of
This expression can be used to analytically compute the de- the reservoir is shown. We depicted the probability density
rived probability distribution of the peak outflow from a de- functions (PDFs) associated with increasing storage capac-
tention dam characterized by a storage capacity Wmax , an ity obtained by raising the crest level from 2 m up to 8 m
equivalent delay constant keq , invested by flood hydrograph (moving top–down in the figure) and considering two distinct
of equivalent event duration tp . With this aim, any probability equivalent event durations of 30 min and 1 h. As expected,
distribution of the flood peaks can be used given the mono- hydrographs with longer duration tend to saturate sooner the
tonic nature of the above expression. The expression of the water storage capacity of the reservoir, reducing also the lam-
TDD will be (see Benjamin and Cornell, 2014) ination effects. On the other hand, the increase in water stor-
dg −1 (y) age capacity leads to a proportional growth of flood peak
fy (y) = fx (g −1 (y)), (13) mitigation. These graphs describe the behaviour of a reser-
dy
voir providing an output consistent with the dynamics of the
where the derivative of g −1 Qp,out assumes the following
process.
form: In Fig. 4, we modified the coefficient of the stage-storage
capacity curve, w1 , using the values of 5000 and 10 000
dg −1 Qp,out
= and explored equivalent event durations ranging from half
dQp,out
an hour to 2 h. Graphs display how the PDFs of outflows are
tp
keq Qc tp + Wmax e keq altered by the presence of a dam with these characteristics.
.
tp Wmax tp In the present example, the impact of the lower opening can
( )
keq
keq Qc tp +Wmax
keq Qc tp + Wmax e + tp Wmax − keq Qc tp + Wmax e be better appreciated with a mass probability around Qc that
(14) is equal to 52 m3 /s. It must be clarified that the cross-section
of the opening has been increased in this second example on
In order to describe the probability distribution of the out-
purpose to emphasize its impact on the proposed mathemat-
flows, we should divide it according to the three potential
ical scheme.
configurations of the detention dams: (1) undisturbed flow,
(2) accumulation of water in the reservoir, and (3) activation
of the crest spillway. Based on these assumptions, the proba- 3.2 Testing the reliability of the proposed method
bility distribution of the outflow is subdivided into three com-
ponents and modelled by the following set of equations: In the current work, a numerical simulation of flood mit-
igation through a detention basin with the characteristics
pQmax Qp,out , Qp,out < Qc
Wmax
reported in Fig. 1 was carried out using the same forcing
tp R +Qc adopted for the proposed TDD. Therefore, we adopted the
p(Qp,out ) = pQmax Qp,out dq, Qp,out = Qc (15) Gumbel distribution as the reference distribution to generate
Q c
dg −1 (Qp,out ) random values of discharge and numerically simulate the dy-
fQp,out (g −1 (Qp,out )), Qp,out > Qc .
dQp,out
namics of the detention dam and its peak outflows. It must
Equation (15) describes the general form of the probabil- be clarified that any probability distribution of floods (e.g.
ity distribution of the outflow from a detention dam, where generalized extreme value, three-parameter log-normal, gen-
the first component coincides with the distribution of the in- eralized logistic and Gumbel distributions) can be applied.
coming flow as long as it is below the control discharge of An example of the numerical simulation is given in Fig. 2
the lower opening (Qp,out < Qc ). Assuming that the lower with the consequent attenuation of the hydrograph due to the
opening is able to control the outflow around Qc after sub- detention dam.
mergence, there is a mass probability in Qc depending on The numerical simulation was carried out with the main
the storage volume of the reservoir (Qp,out = Qc ). After scope of testing the theoretically derived probability distri-
these two phases, the outflow is affected by the lamination bution of laminated peak flows and also quantifying the im-
due to the water volume accumulation above the crest level pact of the approximations adopted to obtain a closed form
(Qp,out > Qc ). of the solution. Therefore, the comparison of the theoretically
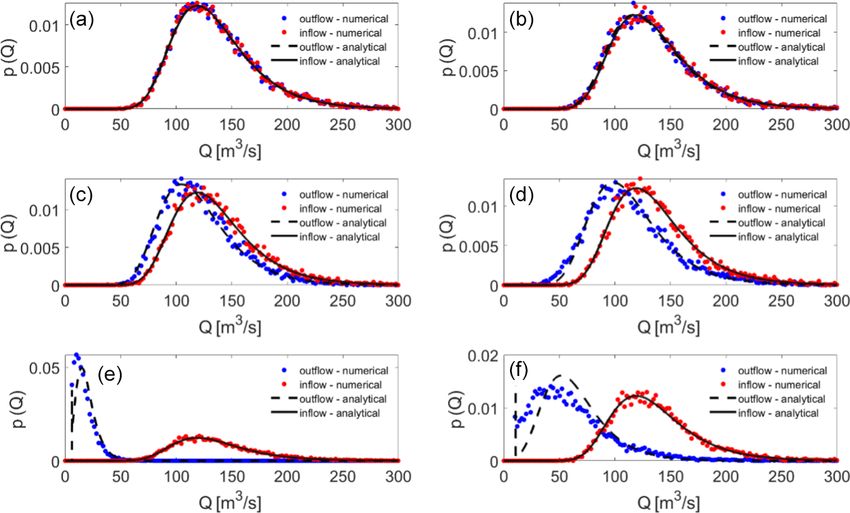
https://doi.org/10.5194/hess-25-4231-2021 Hydrol. Earth Syst. Sci., 25, 4231–4242, 20214236 S. Manfreda et al.: Impact of detention dams on the probability distribution of floods Figure 3. Derived probability density functions of the peak outflow obtained by modifying the height of the spillway crest (hs ) and the equivalent event duration tp . Graphs on the left (a, c, e) are associated with a duration of half an hour and those on the right (b, d, f) to a duration of 1 h, while elevation of the crest changes between 2 (a, b), 4 (c, d) and 8 m (e, f). Other parameters are α = 30 m3 /s; β = 120 m3 /s; b = 1 m; d = 1 m; n = 1.5; hf = lf + d/2 = 0.5 m; hs = 2; µf = 0.85; µs = 0.385; L = 5 m. Figure 4. Derived probability density functions of the outflow associated with different equivalent event durations, tp , using two different coefficients of the stage-storage capacity curve, w1 , which was set equal to 5000 in (a), (c), and (e), while it assumes values of 10 000 m3 in (b), (d), and (f). Event duration changes between 0.5 (a, b), 1 (c, d), and 2 h (e, f). Other parameters are α = 30 m3 /s; β = 120 m3 /s; b = 4 m; d = 2 m; n = 1.5; hf = lf + d/2; hs = 4; µf = 0.85; µs = 0.385; L = 6 m. derived distribution and numerical outflows helps understand charge from the submerged opening induces a small disper- the reliability of the proposed methodology. Results are given sion of values around the control value of discharge, Qc , that in the following graphs. the theoretical probability distribution is not able to capture. Figure 5 provides a comparison of different PDFs ob- Moreover, the adopted approximations slightly overestimate tained, modifying the maximum water storage capacity of the the outflows which can be interpreted as a safety approxima- dam and its height. It can be noted that the values of the prob- tion for flood mitigation planning. ability distribution replicate fairly well those obtained with Comparing the different PDFs, it should be clarified that the numerical simulations. The approximation of a fixed dis- the parameters have been changed, looking for combinations Hydrol. Earth Syst. Sci., 25, 4231–4242, 2021 https://doi.org/10.5194/hess-25-4231-2021
S. Manfreda et al.: Impact of detention dams on the probability distribution of floods                                                 4237

Figure 5. Comparison between derived probability density functions of the outflow (continuous black line for the inflow and dashed black line
for the outflow) and the empirical PDFs obtained via numerical hydraulic simulation (red dots for inflow and blue dots for outflow). Graphs
provide the following parameterizations: (a) w1 = 2000; hs = 4 m; (b) w1 = 1500; hs = 9 m; (c) w1 = 5000; hs = 4 m; (d) w1 = 3000;
hs = 10 m; (e) w1 = 40 000; hs = 4 m; (f) w1 = 6000; = 10 m. Remaining parameters are α = 30 m3 /s; β = 120 m3 /s; b = 1 m; d = 1 m;
n = 1.9; hf = d/2; µf = 0.85; µs = 0.385; L = 4 m; tp = 2 h.

Figure 6. Comparison between derived probability density functions of the outflow (continuous black line for the inflow and dashed black
line for the outflow) and the empirical PDFs obtained via numerical hydraulic simulation (red dots for inflow and blue dots for outflow)
obtained by assuming the absence (a) or the presence (b) of the low-level opening. Remaining parameters are α = 30 m3 /s; β = 120 m3 /s;
w1 = 6500; hs = 10 m; b = 1 m; d = 1 m; n = 1.9; hf = d/2; µf = 0.85; µs = 0.385; L = 4 m; tp = 2 h.

https://doi.org/10.5194/hess-25-4231-2021                                              Hydrol. Earth Syst. Sci., 25, 4231–4242, 2021
4238                                   S. Manfreda et al.: Impact of detention dams on the probability distribution of floods

Figure 7. Comparison between derived probability density functions of the outflow (continuous black line for the inflow and dashed black
line for the outflow) and the empirical PDFs obtained via numerical hydraulic simulation (red dots for inflow, blue dots for outflow obtained
by incoming rectangular hydrographs and green dots for outflow obtained by incoming exponential hydrographs), assuming three equivalent
event durations tp of half an hour (a), 1 h (b) and 2 h (c). Remaining parameters are α = 30 m3 /s; β = 120 m3 /s; w1 = 5000; hs = 4 m;
b = 1 m; d = 1 m; n = 1.9; hf = d/2; µf = 0.85; µs = 0.385; L = 3 m.

of dam heights, hs , and coefficient w1 leading to similar wa-           ated how the use of an equivalent event duration produced
ter storage capacity on each row. This allows demonstrating              probability distributions of the outflow that look very similar
that it is much more effective to increase the area flooded by           to those obtained with a symmetric exponential hydrograph.
the reservoir (the parameter w1 represents the rate of increase          It must also be underlined that with the increase of the dura-
of the water storage with the water level) rather than increase          tion of the event such an approximation tends to deteriorate
the height of the dam.                                                   the result of the proposed model.
   The last analysis performed is given in Fig. 6, where we
tested the performances of the TDD assuming the lower
opening closed. Such a condition may be representative of                4   Conclusion
an ordinary dam with an assigned flood retention volume or
used for water supply purposes, where the volume above the               The present article introduces a new formulation useful to
crest spillway leads to a lamination of floods. This configura-          quantify the impact of detention dams on the probability dis-
tion has been compared with the scheme described in the pre-             tribution of floods. We must acknowledge that the formula-
vious sections that includes the presence of the lower open-             tion was obtained with several simplifying assumptions that
ing. The difference between the two configurations is given              include the shape of the incoming hydrograph, the approxi-
in Fig. 6a (closed opening) and b (lower opening active). The            mation used to interpret the flow through the lower opening,
two graphs show the ability of the mathematical formulation              and the approximation of a linear reservoir for the flow above
to properly interpret also the present configuration, offering a         the crest level. Summing all these, it is really satisfying to
wide spectrum of potential applications in hydraulic design.             see that the obtained formulation can interpret the dynam-
   Finally, in order to test the impact of the assumption of             ics of such hydraulic infrastructures fairly well, providing
rectangular inflow hydrograph, we also compared the results              an analytical description of the impact of artificial reservoirs
of a numerical simulation where the hydrograph is assumed                on flood dynamics. This may be extremely useful in prop-
to be a symmetric exponential one according to the expres-               erly addressing the effects of water infrastructures on floods.
sion given in Eq. (11). The comparison is given in Fig. 7 for            The TDD can be used for detention dams, but the formalism
three different equivalent event durations. It can be appreci-           can also be applied to ordinary dams just setting the control
                                                                         discharge to zero and assigning a given value of the water

Hydrol. Earth Syst. Sci., 25, 4231–4242, 2021                                              https://doi.org/10.5194/hess-25-4231-2021
S. Manfreda et al.: Impact of detention dams on the probability distribution of floods 4239 level in the dam. Therefore, the formalism is versatile and The scheme can be used to carry out preliminary dimen- can be applied in different contexts. The strongest assump- sioning of these structures and eventually could be coupled tion is represented by the rectangular hydrograph which can with other tools to identify optimal configurations for flood be realistic for small river basins characterized by relatively mitigation. Moreover, the scheme can be applied to any prob- short concentration time. With the aim of minimizing the im- ability distribution of floods, including the case of floods that pact of such a choice, we adopted an equivalent event dura- are already subject to laminations allowing the description of tion in the formulation that allowed accounting for the flood a scheme of nested dams. variability during a specific event. However, this assumption This topic is still under investigation, and its study will may become limitative in large river basins where a hydro- be applied to identify optimal solutions in flood control sys- graph evolves over large areas and its shape is also not simple tems quantifying the impact of structure on the full spectra to be predicted. In fact, large river basins may display com- of floods. plex hydrographs with multiple peaks that require a specific approach. The proposed method may be used in some contexts such as the projects and design of small lamination dams and de- tention dams in small river basins. For instance, there are sev- eral river basins along the coastline that drain a high amount of water in short durations, affecting cities and towns devel- oped along the waterfront. These areas are typically exposed to frequent flood events that may impose the need to properly identify potential solutions for flood mitigation. https://doi.org/10.5194/hess-25-4231-2021 Hydrol. Earth Syst. Sci., 25, 4231–4242, 2021
4240                               S. Manfreda et al.: Impact of detention dams on the probability distribution of floods

Appendix A: Notations

 α [–]            Scale parameter of Gumbel distribution
 β [–]            Location parameter of Gumbel distribution
 µf [–]           Coefficient of discharge of the submerged low-level opening
 µs [–]           Coefficient of discharge of the crest spillway
 A [m2 ]          Area of the low-level opening
 b [m]            Width of the low-level opening rectangular section
 d [m]            Height of the low-level opening
 g [m/s2 ]        Acceleration due to gravity
 h [m]            Variable water level within the detention basin
 hm [m]           Mean of water levels over the spillway crest
 hs [m]           Height of the spillway crest
 hf [m]           Height of the barycentre of the low-level opening
 k [s]            Storage coefficient of the linear reservoir method
 keq [s]          Equivalent delay constant of the conceptual reservoir associated with the outflow
 L [m]            Effected crest length
 n [–]            Exponent of the stage-storage capacity curve
 p(Q) [–]         Probability density function of outflows
 lf [m]           Height of the low-level opening
 Qc [m3 /s]       Design outflow from the low-level opening
 Qin [m3 /s]      Inflow in the detention basin
 Qmax [m3 /s]     Peak flow incoming in the detention basin
 Qout [m3 /s]     Outflow from the detention basin
 Qp,out [m3 /s]   Peak outflow from the detention basin
 t [s]            Time
 D [s]            Flood event duration
 tfilling [s]     Time after which the crest spillway starts functioning
 tp [s]           Equivalent flood duration
 ω [s]            Lag time of the river basin
 Wmax [m3 ]       Water storage capacity at the crest level
 W [m3 ]          Variable storage capacity of the detention basin
 w1 [m3−n ]       Parameter of the stage-storage capacity curve
 w2 [m3/2 ]       Parameter of the equivalent stage-storage capacity curve

Hydrol. Earth Syst. Sci., 25, 4231–4242, 2021                                     https://doi.org/10.5194/hess-25-4231-2021
S. Manfreda et al.: Impact of detention dams on the probability distribution of floods                                                  4241

Code and data availability. Codes used to generate the                   Fiorentino, M.: La valutazione dei volumi dei volumi di piena nelle
theoretical distributions introduced in the present arti-                   reti di drenaggio urbano, Idrotecnica, 3, 141–152, 1985.
cle are available on MATLAB Central at the following                     Fischer, E. M. and Knutti, R. Observed heavy precipitation increase
link        https://it.mathworks.com/matlabcentral/fileexchange/            confirms theory and early models, Nat. Clim. Change, 5, 560–
95813-peak-outflows-of-a-detention-basin (Manfreda, 2021).                  564, 2016.
                                                                         Franzi, L., Pezzoli, A., and Besana, A.: Flood Lamination Strate-
                                                                            gies for Risk Reduction, River Basin Management, 113, 315,
Author contributions. SM conceived and coordinated the work,                https://doi.org/10.5772/63553, 2016.
DM supported the coding and numerical simulations, and CA sup-           Gioia, A., Iacobellis, V., Manfreda, S., and Fiorentino, M.: Runoff
ported the review and interpretation of the results. All authors con-       thresholds in derived flood frequency distributions, Hydrol. Earth
tributed to the writing and review of the article.                          Syst. Sci., 12, 1295–1307, https://doi.org/10.5194/hess-12-1295-
                                                                            2008, 2008.
                                                                         Jacob, A. C. P., Rezende, O. M., de Sousa, M. M., de França
Competing interests. The authors declare that they have no conflict         Ribeiro, L. B., de Oliveira, A. K. B., Arrais, C. M., and Miguez,
of interest.                                                                M. G.: Use of detention basin for flood mitigation and urban re-
                                                                            qualification in Mesquita, Brazil, Water Sci. Technol., 79, 2135–
                                                                            2144, 2019.
                                                                         Manfreda, S.: Peak outflows of a detention basin, MAT-
Disclaimer. Publisher’s note: Copernicus Publications remains
                                                                            LAB Central File Exchange [model code], available at:
neutral with regard to jurisdictional claims in published maps and
                                                                            https://www.mathworks.com/matlabcentral/fileexchange/
institutional affiliations.
                                                                            95813-peak-outflows-of-a-detention-basin,          last    access:
                                                                            27 July 2021.
                                                                         Manfreda, S. and Fiorentino, M.: A stochastic approach for the de-
Financial support. This research has been supported by the Italian          scription of the water balance dynamics in a river basin, Hydrol.
Ministry of Environment, Land and Sea with the research project             Earth Syst. Sci., 12, 1189–1200, https://doi.org/10.5194/hess-12-
entitled “Hydraulic risk mitigation in coastal basins with in-line ex-      1189-2008, 2008.
pansion tanks: an integrated sizing approach”.                           Manfreda S., Link, O., and Pizarro, A.: The Theoretically De-
                                                                            rived Probability Distribution of Scour, Water, 10, 1520,
                                                                            https://doi.org/10.3390/w10111520, 2018.
Review statement. This paper was edited by Giuliano Di Baldas-           Munich Reinsurance Company [MunichRe]: Geo Risks
sarre and reviewed by two anonymous referees.                               Research,       NatCatSERVICE.        ©      2020       Münchener
                                                                            Rückversicherungs-Gesellschaft, NatCatSERVICE, available
                                                                            at: https://www.munichre.com/en/solutions/for-industry-clients/
                                                                            natcatservice.html, last access: 26 May 2020.
References                                                               Natural Environmental Research Council (NERC): Estimation of
                                                                            Flood Volumes over Different Duration, in: Flood Studies Re-
Bellu, A., Fernandes, L. F. S., Cortes, R. M., and Pacheco, F. A.: A        port; Volume I, NERC: London, UK, pp. 352–373, 1975.
  framework model for the dimensioning and allocation of a deten-        Papalexiou, S. M. and Montanari, A.: Global and regional increase
  tion basin system: The case of a flood-prone mountainous water-           of precipitation extremes under global warming, Water Resour.
  shed, J. Hydrol., 533, 567–580, 2016.                                     Res., 55, 4901–4914, 2019.
Benjamin, J. R. and Cornell, C. A.: Probability, statistics, and de-     Peduzzi, P.: Is climate change increasing the frequency of hazardous
  cision for civil engineers, Courier Corporation, Mineola, New             events?, Environment and Poverty Times, 3, p. 7, 2005.
  York, 2014.                                                            Plate, E. J.: Flood risk and flood management, J. Hydrol., 267, 2–11,
De Michele, C. A. R. L. O. and Salvadori, G.: On the derived flood          2002.
  frequency distribution: analytical formulation and the influence       Rodríguez-Iturbe, I. and Porporato, A.: Ecohydrology of water-
  of antecedent soil moisture condition, J. Hydrol., 262, 245–258,          controlled ecosystems: soil moisture and plant dynamics, Cam-
  2002.                                                                     bridge University Press, Cambridge, USA, 2007.
Di Baldassarre, G., Montanari, A., Lins, H., Koutsoyiannis, D.,          Seibert, S. P., Skublics, D., and Ehret, U.: The potential of coordi-
  Brandimarte, L., and Bloeschl, G.: Flood fatalities in Africa:            nated reservoir operation for flood mitigation in large basins – A
  from diagnosis to mitigation, Geophys. Res. Lett., 37, L22402,            case study on the Bavarian Danube using coupled hydrological –
  https://doi.org/10.1029/2010GL045467, 2010.                               hydrodynamic models, J. Hydrol., 517, 1128–1144, 2014.
Di Baldassarre, G., Martinez, F., Kalantari, Z., and Viglione,           Urban Drainage and Flood Control District (UDFCD): Ur-
  A.: Drought and flood in the Anthropocene: feedback mecha-                ban Storm Drainage Criteria Manual, Volume 2, Denver,
  nisms in reservoir operation, Earth Syst. Dynam., 8, 225–233,             Colorado, available at: https://udfcd.org/wp-content/uploads/
  https://doi.org/10.5194/esd-8-225-2017, 2017.                             uploads/vol2criteriamanual/USDCMVolume2.pdf (last access:
Eagleson P. S.: Dynamics of flood frequency, Water Resour Res., 8,          15 June 2020), 2016.
  878–98, 1972.

https://doi.org/10.5194/hess-25-4231-2021                                              Hydrol. Earth Syst. Sci., 25, 4231–4242, 2021
4242 S. Manfreda et al.: Impact of detention dams on the probability distribution of floods Wallemacq, P. and Below, R. : The human cost of natural disasters: A global perspective, Centre for Research on the Epidemiology of Disasters, Brussels, Belgium, 2015. Winsemius, H. C., Aerts, J. C., Van Beek, L. P., Bierkens, M. F., Bouwman, A., Jongman, B., Kwadijk, J. C., Ligtvoet, W., Lucas, P. L., van Vuuren, D. P. and Ward, P. J.: Global drivers of future river flood risk, Nat. Clim. Change, 6, 381–385, 2016. Hydrol. Earth Syst. Sci., 25, 4231–4242, 2021 https://doi.org/10.5194/hess-25-4231-2021
You can also read