Numerical modelling of the Caspian Sea tides - Ocean Science
←
→
Page content transcription
If your browser does not render page correctly, please read the page content below
Ocean Sci., 16, 209–219, 2020
https://doi.org/10.5194/os-16-209-2020
© Author(s) 2020. This work is distributed under
the Creative Commons Attribution 4.0 License.

Numerical modelling of the Caspian Sea tides
Igor P. Medvedev1,2 , Evgueni A. Kulikov1 , and Isaac V. Fine3
1 ShirshovInstitute of Oceanology, Russian Academy of Sciences, Moscow, Russia
2 Roshydromet,  Fedorov Institute of Applied Geophysics, Moscow, Russia
3 Department of Fisheries and Oceans, Institute of Ocean Sciences, Sidney, B.C., Canada

Correspondence: Igor P. Medvedev (medvedev@ocean.ru)

Received: 18 July 2019 – Discussion started: 31 July 2019
Revised: 29 November 2019 – Accepted: 13 December 2019 – Published: 5 February 2020

Abstract. The Caspian Sea is the largest enclosed basin on         represented as the sum of two types of oscillations: (1) the
Earth and a unique subject for the analysis of tidal dynam-        co-oscillating tide, caused by a tidal exchange with adja-
ics. Tides in the basin are produced directly by the tide-         cent basins, and (2) the independent tide, generated directly
generating forces. Using the Princeton Ocean Model (POM),          by the tide-generating forces (Defant, 1961). Co-oscillating
we examine details of the spatial and temporal features of the     tides dominate in marginal seas and are generated by tidal
tidal dynamics in the Caspian Sea. We present tidal charts of      waves entering from an adjoining ocean or sea. In isolated in-
the amplitudes and phase lags of the major tidal constituents,     land seas (e.g. the Black Sea and the Baltic Sea), independent
together with maps of the form factor, tidal range, and tidal      tides strongly prevail, as tidal waves from adjacent basins
current speed. Semi-diurnal tides in the Caspian Sea are de-       cannot significantly penetrate the sea (Medvedev et al., 2013,
termined by a Taylor amphidromic system with anticlock-            2016; Medvedev, 2018). The Caspian Sea is a unique sub-
wise rotation. The largest M2 amplitude is 6 cm and is located     ject for the analysis of independent tide formation as it is the
in Türkmen Aylagy (called Turkmen Bay hereafter). For the          largest fully enclosed basin on Earth.
diurnal constituents, the Absheron Peninsula separates two            Tides in the Caspian Sea have been studied for a long time,
individual amphidromes with anticlockwise rotation in the          although not on a regular basis. Malinovsky (1926) showed
north and in the south. The maximum K1 amplitudes (up              that semi-diurnal tides dominate the Caspian Sea and that the
to 0.7–0.8 cm) are located in (1) the south-eastern part of        spring tidal range was 7.7 cm, based on an analysis of 30 d
the basin, (2) Türkmenbaşy Gulf, (3) Mangyshlak Bay; and          records of hourly water levels from three tide gauges. Ger-
(4) Kizlyar Bay. As a result, the semi-diurnal tides prevail       man (1970) performed a spectral analysis of 3-month obser-
over diurnal tides in the Caspian Sea. The maximum tidal           vational series at eight tide gauges and distinguished the di-
range, of up to 21 cm, has been found in Turkmen Bay. The          urnal and semi-diurnal constituents through different gener-
strongest tidal currents have been located in the straits to the   ation mechanisms; semi-diurnal tides had a gravitational ori-
north and south of Ogurja Ada, where speeds reach 22 and           gin, while diurnal tides were formed by sea-breezes. Kosarev
19 cm s−1 , respectively. Numerical simulations of the tides       and Tsyganov (1972) found the maximum tidal range to be
using different mean sea levels (within a range of 5 m) indi-      12 cm at Ogurja Ada (Fig. 1). Spidchenko (1973) estimated
cate that spatial features of the Caspian Sea tides are strongly   the amplitudes and phase lags at seven sites, and they found
sensitive to changes in mean sea level.                            the mean spring tidal range to be 8.3 cm at Krasnovodsk.
                                                                   Analysing annual series of hourly observations at six tide
                                                                   gauges, Levyant et al. (1994) hypothesised that the semi-
                                                                   diurnal tidal wave is represented by a anticlockwise-rotating
1   Introduction                                                   Kelvin-wave type amphidromic system with its centre in the
                                                                   area of the Absheron Threshold.
Tides, one of the major drivers of oceanic motions, are               Medvedev et al. (2017) estimated the amplitudes and
formed by the tide-generating forces of the Moon and the           phase lags of major tidal constituents for different parts of the
Sun under the influence of Earth’s rotation. Tides can be

Published by Copernicus Publications on behalf of the European Geosciences Union.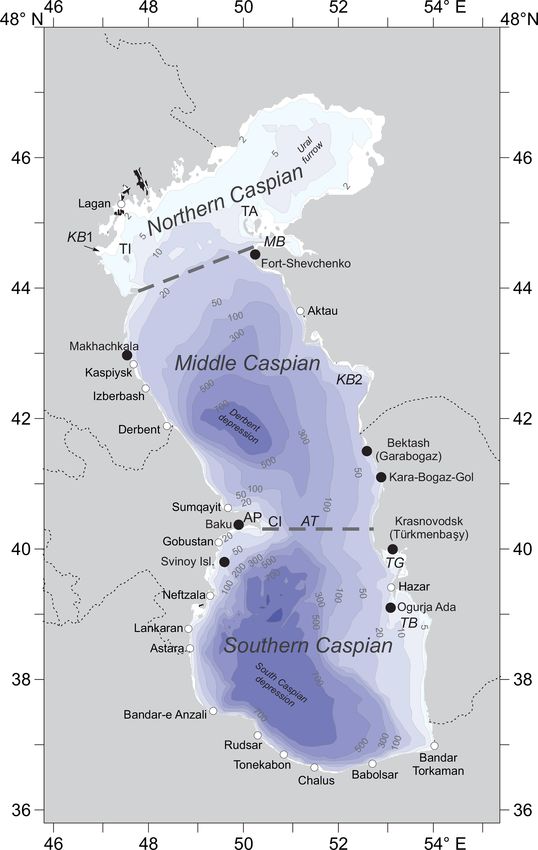
210 I. P. Medvedev et al.: Caspian Sea tides
The semi-diurnal tide dominates the Middle Caspian and
Southern Caspian regions.
Analyses of the tide gauge data allow for the examination
of specific tidal features at different sites but not for the esti-
mation of the spatial structure of tides in the deep-water areas
of the Caspian Sea. Therefore, in order to capture these spa-
tial structures we used the numerical Princeton Ocean Model
(POM) adapted for the Caspian Sea (see Medvedev et al.,
2019). The adapted POM reproduces the tides and meteoro-
logical sea level variability for periods ranging from several
hours to a month. In the present paper, we use this model to
characterise the spatial and temporal properties of the tidal
dynamics for the entire Caspian Sea.
2 Data and methods
2.1 Numerical model description
The tidal motions examined in this study are based on a 2-
D version of the Princeton Ocean Model (Mellor, 2004). The
forcing term in the two-dimensional shallow-water equations
is specified through gradients in the tidal potential over the
Caspian Sea:
F T = − (1 + k − h) ∇, (1)
where is the tidal potential and k and h are the Love num-
bers, which relate the body Earth tide (and associated pertur-
bations) to the potential. We used frequency-dependent val-
ues of h and k calculated by Wahr (1981) (Table 1). The tidal
potential was calculated for spherical harmonics via formu-
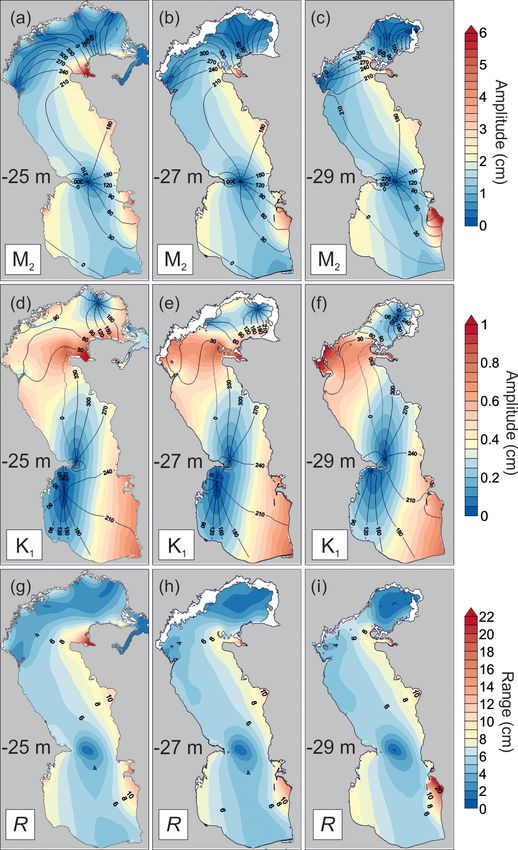
Figure 1. The bathymetry of the Caspian Sea according to the
lae provided by Munk and Cartwright (1966) and included all
GEBCO database. Numbers on the contours indicate the depths the main tidal components (> 80), including the major diur-
below mean sea level (MSL), which is −28 m with respect to the nal, semidiurnal, and long-period constituents. Additionally,
Baltic Height System (BHS). Black points denote sites of tide our numerical model includes the ocean tidal loading poten-
gauges used for validation of the numerical model. Other designa- tial obtained from FES2014 (Finite Element Solution tidal
tions are given: TI is Tyulen’i (Tyuleny) island, TA is the Tyulen’i model), produced by NOVELTIS, LEGOS, and CLS Space
(Tyuleniy) archipelago, MB is Mangyshlak bay, KB1 is Kizlyar bay, Oceanography Division and distributed by AVISO, with sup-
KB2 is Kazakh bay, AP is the Absheron Peninsula, AT is the Ab- port from Centre National D’Etudes Spatiales (CNES) (http:
sheron Threshold, CI is the Chilov (Zhiloy) island, TG is Türkmen- //www.aviso.altimetry.fr/, last access: 20 November 2019).
başy Gulf, and TB is Turkmen Bay. In the numerical model, energy dissipation is through
the vertical component of turbulent viscosity. The frictional
force in the momentum equations is determined by the speed
of the bottom flow and the friction coefficient:
Caspian Sea based on analysis of long-term hourly data from τbx , τby = (Cb ub |ub | , Cb vb |ub |) , (2)
12 tide gauges. A maximum tidal range of 21 cm was found
at Aladga (eastern part of the Southern Caspian). Medvedev where ub = (ub , vb ) is the flow velocity above the bot-
et al. (2017) also performed a high-resolution spectral anal- tom boundary layer (which is assumed to be equal to the
ysis and determined that the diurnal sea level oscillations in barotropic velocity ub for the 2-D model), and Cb is the bot-
the Middle Caspian have a gravitational origin, while those tom friction coefficient, which has the following form:
in the Southern Caspian are mainly caused by radiational ef-
κ2
fects (the amplitude of the diurnal radiational constituent S1 Cb = max , 0.0025 , (3)
(ln {0.5H /z0 })
is much higher than those of the gravitational constituents
O1 , P1 , and K1 ). In the Northern Caspian, there are no gravi- where κ = 0.4 is the von Kármán constant and z0 is the bed
tational tides and only weak radiational tides are observed. roughness length. A minimum value for the bottom friction
Ocean Sci., 16, 209–219, 2020 www.ocean-sci.net/16/209/2020/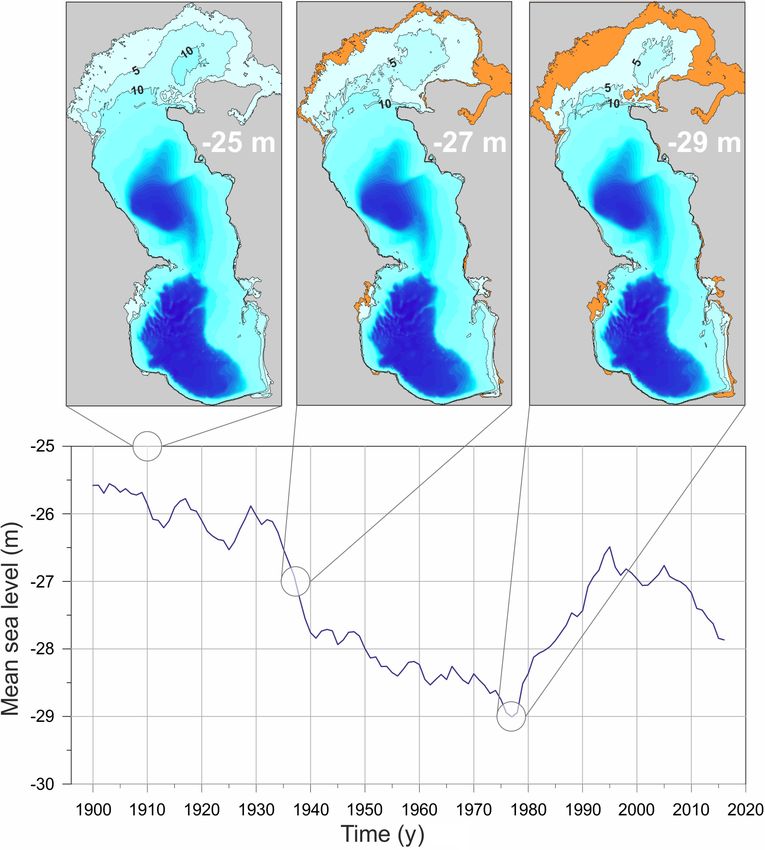
I. P. Medvedev et al.: Caspian Sea tides                                                                                           211

Table 1. Love numbers for the major tidal constituents (Wahr, 1981;
Kantha and Clayson, 2000). “cpd” is cycles per day.

           Constituent    Frequency         h        k
                               (cpd)
                  long-period           0.606    0.299
           Q1                 0.8932    0.604    0.298
           O1                 0.9295    0.603    0.298
           P1                 0.9973    0.581    0.287
           K1                 1.0027    0.520    0.256
           J1                 1.0390    0.611    0.302
                                                                      Figure 2. Comparisons of (a) amplitudes and (b) phase lags of har-
                  semidiurnal           0.609    0.302                monics M2 (red) and K1 (blue) estimated by the numerical mod-
                                                                      elling (Hmodel and Gmodel ) and from tide gauge observations (Hobs
                                                                      and Gobs ).

coefficient, Cb = 0.0025, was applied in order to avoid a van-
ishing bottom drag in very deep water.                                lag errors varied from 1 to 50◦ . All phase lags are relative to
   The numerical simulations were performed on a grid of              Greenwich, using Coordinated Universal Time (UTC).
507 by 659 nodes with a step of 1 arcmin in latitude and
longitude, created from the General Bathymetric Chart of
the Oceans (GEBCO) bathymetry data of the Caspian Sea                 3     Results
with a resolution of 30 arcsec. For this region, GEBCO uses
the gridded data set provided by Hall (2002). This dataset is         3.1    Numerical modelling of tides
based on over 280 000 bathymetric soundings digitised from
bathymetric contours, taken from 107 Russian navigational             A numerical model with a MSL of −28 m with respect to
charts. In Sect. 3.1, a mean sea level (MSL) for the Caspian          the BHS was used. Amplitudes and phase lags of the major
of −28 m with respect to the Baltic Height System (BHS,               tidal constituents were calculated using classical harmonic
relative to the zero level of the Kronstadt tide gauge) was           analysis (Pugh and Woodworth, 2014). In this section, we
adopted in the numerical modelling. In the numerical exper-           examine the spatial pattern of diurnal and semi-diurnal tides
iments in Sect. 3.4, the MSL of the Caspian was varied from           taking the major constituents K1 and M2 as examples.
−25 to −30 m with respect to the BHS. The boundary con-                  The diurnal tidal pattern includes a complicated am-
ditions for the tidal model are zero flow normal to the coast         phidromic system in the Middle Caspian (Fig. 3a). The Ab-
(at the 2 m depth contour).                                           sheron Peninsula splits this system into separate north and
                                                                      south amphidromes. Both amphidromic systems feature a an-
2.2   Tidal model validation                                          ticlockwise rotation. Near the Absheron Peninsula, the K1
                                                                      amplitude is less than 0.15 cm. The maximum K1 amplitudes
In Medvedev et al. (2019), the model results for the Caspian          (up to 0.7–0.8 cm) are located in (1) the south-eastern part
Sea were validated using hourly sea level observations from           of the Caspian Sea, (2) Türkmenbaşy Gulf, (3) Mangyshlak
eight tidal gauges (Fig. 1). Several experiments with different       Bay, and (4) Kizlyar Bay. The second anticlockwise-rotating
values of the bed roughness length were performed. The best           amphidrome is formed in the Northern Caspian. Medvedev
tide reproduction accuracy at the eight sites was obtained for        et al. (2019) showed that the numerical modelling results are
z0 = 0.01 m, which is used in Eq. (3) to determine the bot-           not very reliable in the Northern Caspian due to the shallow
tom friction coefficient, Cb . Figure 2 presents a comparison         depths, with about 20 % of this part of the Caspian Sea being
of the amplitudes (H ) and phase lags (G) of the tidal con-           less than 1 m deep (Baidin and Kosarev, 1986). Other diurnal
stituents calculated from the results of numerical modelling          tidal constituents have a spatial distribution similar to that of
with those based on observations. The error in the calcula-           K1 . The amplitudes of these constituents are up to 0.5 cm for
tions of the amplitude of the M2 harmonic at Baku, Svinoy             O1 and 0.25 cm for P1 . The amplitudes of the other diurnal
island, Fort-Shevchenko, Garabogaz (called Bektash here-              tidal constituents in the Caspian Sea do not exceed 0.1 cm.
after), and Ogurchinsky island (Ogurja Ada) did not exceed               Semidiurnal tides in the Caspian Sea are determined by
0.1–0.2 cm. The corresponding errors for Kara-Bogaz-Gol               a Taylor amphidromic system with anticlockwise rotation
and Krasnovodsk were 0.3–0.4 cm. The phase lag error for              (Fig. 3b). The amphidromic point of this system is located
six of the tide gauges varied from 0 to 6◦ , while for Ogurchin-      80 km east of the Absheron Peninsula. The minimum M2 am-
sky island it reached 36◦ , and for Krasnovodsk it was 26◦ .          plitudes are located (1) east of the Absheron Peninsula, (2) in
The amplitude error of the K1 harmonic at seven of the tide           the western part of the Northern Caspian, and (3) in the east-
gauges was 0.1–0.2 cm and for Baku it was 0.4 cm. The phase           ern part of the Northern Caspian. Maximum M2 amplitudes

www.ocean-sci.net/16/209/2020/                                                                       Ocean Sci., 16, 209–219, 2020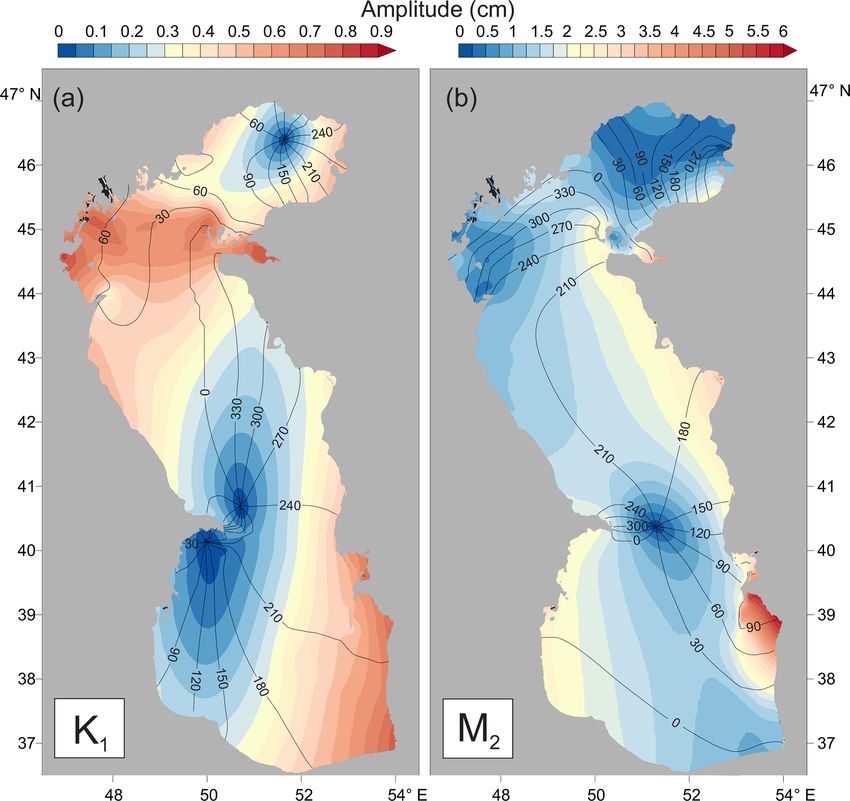
212                                                                                           I. P. Medvedev et al.: Caspian Sea tides

Table 2. Amplitudes (H ) and Greenwich phase lags (G) of the major tidal constituents, form factor (F ), and maximum tidal range (R) at the
main cities in the Caspian Sea.

      Station                  Country               M2                S2                K1               O1             F    R, cm
                                                H , cm    G, ◦   H , cm     G, ◦    H , cm    G, ◦   H , cm    G, ◦
      Bandar-e Anzali          Iran               2.12    354       0.92      354     0.24    112      0.18    102    0.14       7.6
      Rudsar                   Iran               1.83    353       0.77      353     0.26    149      0.18    139    0.17       6.6
      Tonekabon                Iran               1.64    352       0.68      352     0.33    160      0.22    153    0.23       6.0
      Chalus                   Iran               1.43    351       0.59      351     0.41    171      0.27    166    0.33       5.4
      Babolsar                 Iran               1.07    357       0.41      359     0.56    187      0.37    184    0.62       4.7
      Bandar Torkaman          Iran               1.10    360       0.42       10     0.78    197      0.53    194    0.86       5.7
      Hazar                    Turkmenistan       1.90     88       0.74       98     0.54    215      0.34    213    0.33       7.0
      Türkmenbaşy             Turkmenistan       2.27    129       0.85      140     0.60    234      0.38    230    0.31       8.2
      Garabogaz (Bektash)      Turkmenistan       2.43    167       0.99      169     0.40    253      0.27    248    0.19       8.6
      Aktau                    Kazakhstan         2.30    186       0.89      187     0.29    303      0.18    295    0.15       7.9
      Fort-Shevchenko          Kazakhstan         2.47    210       0.92      210     0.56    326      0.30    317    0.25       8.9
      Lagan                    Russia             1.16     48       0.40       67     0.77     75      0.44     69    0.78       5.8
      Makhachkala              Russia             1.22    228       0.48      244     0.53     25      0.36     23    0.52       4.9
      Kaspiysk                 Russia             1.22    229       0.48      244     0.52     24      0.36     23    0.51       4.9
      Izberbash                Russia             1.23    227       0.48      241     0.51     23      0.35     23    0.50       4.9
      Derbent                  Russia             1.27    223       0.49      235     0.48     25      0.33     26    0.46       5.0
      Sumqayit                 Azerbaijan         1.80    231       0.74      239     0.25     28      0.17     28    0.17       6.3
      Baku                     Azerbaijan         2.18      6       0.96        8     0.05    358      0.03    356    0.02       7.6
      Gobustan                 Azerbaijan         2.32      7       1.03        8     0.10     30      0.07     18    0.05       8.2
      Neftçala                 Azerbaijan         2.24      2       1.00        3     0.13     71      0.12     68    0.08       8.0
      Lankaran                 Azerbaijan         2.40      1       1.06        2     0.21     71      0.18     67    0.11       8.5
      Astara                   Azerbaijan         2.29    359       1.00      359     0.21     79      0.18     74    0.12       8.2

                                                                        are found in (1) the western part of the Southern Caspian,
                                                                        up to 2.4 cm; (2) Kazakh Bay, up to 3.2 cm; (3) Mangysh-
                                                                        lak Bay, up to 3.2 cm; and (4) the Türkmenbaşy Gulf, up to
                                                                        3.9 cm. The largest M2 amplitude of 6 cm is located in Turk-
                                                                        men Bay. Other semi-diurnal tidal constituents have a similar
                                                                        spatial distribution to M2 . The S2 amplitude in Turkmen Bay
                                                                        is 2.6 cm, N2 is 1.1 cm, and K2 is 0.7 cm. The amplitudes and
                                                                        phase lags of the major tidal constituents at selected towns
                                                                        around the Caspian Sea are presented in Table 2.

                                                                        3.2    Form factor, tidal range, and role of tidal
                                                                               oscillations in sea level variability

                                                                        The results of our analysis indicate that semi-diurnal tides
                                                                        prevail over diurnal tides in the Caspian Sea. To show this,
                                                                        we estimated the form factor as determined by the ampli-
                                                                        tude ratio of the major diurnal and semi-diurnal constituents
                                                                        (Pugh and Woodworth, 2014):
                                                                               HK1 + HO1
                                                                        F=               .                                             (4)
                                                                               HM2 + HS2
Figure 3. Tidal maps of the co-amplitudes (cm) (shaded) and co-
phase lags (degrees, UTC) (solid lines) for the (a) K1 and (b) M2       Tides have a semi-diurnal form in the eastern part of the
tidal constituents.                                                     Middle Caspian (F < 0.25), in the western part of the South-
                                                                        ern Caspian (F < 0.25), and in Turkmen Bay (F ∼ 0.14)
                                                                        (Fig. 4a). In general, a mixed mainly semi-diurnal tide

Ocean Sci., 16, 209–219, 2020                                                                        www.ocean-sci.net/16/209/2020/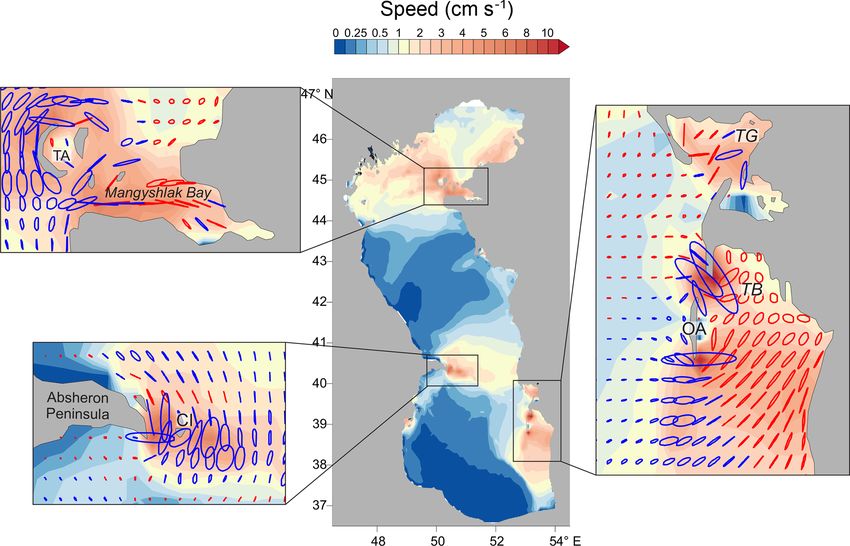
I. P. Medvedev et al.: Caspian Sea tides                                                                                          213

Figure 4. (a) Form factor and (b) the maximal tidal range in the
Caspian Sea.                                                       Figure 5. The relative contribution (in percent) of the tides to the
                                                                   total sea level variance in the Caspian Sea in the frequency band
                                                                   from 0.1 to 6 cpd.
(0.25 < F < 1.5) is observed in other areas of the Caspian Sea.
Only in the western and eastern parts of the Northern Caspian         For this study, we estimated the contribution of the gravi-
and at the semi-diurnal amphidromic point (80 km east of the       tational tides to the sea level variance based on the new nu-
Absheron Peninsula) does the tide have a mixed mainly diur-        merical modelling results. We made two numerical experi-
nal form (F > 1.5).                                                ments: (1) with the tides alone and (2) with meteorological
   Using the results of the numerical modelling of the diurnal,    forcing alone produced by variations in the wind and air pres-
semi-diurnal, and shallow tidal constituents, we were able         sure fields over the Caspian Sea for 1979 from NCEP/CFSR
to predict an 18.6-year tidal time series at each grid node.       reanalysis (Saha et al., 2010). We calculated the variance
The tidal range was calculated as the maximum range of the         of tidal sea level variability (excluding the long-period con-
tidal sea level oscillations during one lunar day (∼ 25 h). The    stituents) and the variance of the meteorological sea level
tidal co-range distribution features a pattern similar to the M2   variations in the frequency band from 0.1 to 6 cpd. Then, we
amplitude distribution (Fig. 4b). The maximum tidal ranges         estimated the relative contribution (in percent) of the tides to
are found for (1) Kazakh Bay, up to 12 cm; (2) Mangysh-            the total sea level variance in the Caspian Sea.
lak Bay, up to 12 cm; (3) Türkmenbaşy Gulf, up to 13 cm;             The maximum contribution of tides to the total sea level
and (4) Turkmen Bay, up to 21 cm. The form factor and tidal        variance was found to be located in the eastern part of the
range at the main cities in the Caspian Sea are included in Ta-    Middle Caspian: up to 29 %. In Turkmen Bay, the tidal con-
ble 2. Fort-Shevchenko features the largest tidal range listed     tribution to the total variance is up to 27 %. The minimum
in Table 2. The maximum tidal range for the Caspian Sea, as        contribution is found in the Northern Caspian, where strong
a whole, is observed in Turkmen Bay (21 cm), but there are         storm surges occur; and near the Absheron Peninsula, where
no big cities in this area.                                        the amphidromic points of the diurnal and semi-diurnal tides
   Medvedev et al. (2017) estimated the role of tidal oscilla-     are located. The results of this analysis show that tides are a
tions in the overall sea level variability in the Caspian Sea      significant component of the overall sea level variability of
by calculating the relative contribution of the tides (gravita-    the Caspian Sea in the mesoscale. Consequently, knowledge
tional and radiational) to the total sea level variance in the     of the tidal characteristics is important for understanding the
frequency band from 0.5 to 6 cpd (cycles per day) for 11 tide      hydrodynamics of the sea.
gauges. The maximum contribution was observed at Bektash
(27 %). At Aladga, which has the greatest range of 21 cm, the
tidal contribution to the sea level variance was 22.5 %. The
smallest relative contribution of the tides was found on the
western coast: 7.6 % at Makhachkala and 11.7 % at Baku.

www.ocean-sci.net/16/209/2020/                                                                     Ocean Sci., 16, 209–219, 2020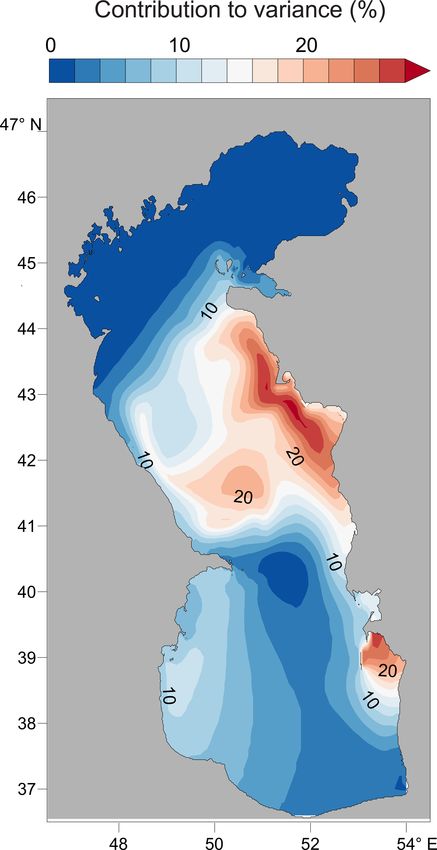
214                                                                                          I. P. Medvedev et al.: Caspian Sea tides

Figure 6. Semi-major axis speed magnitudes (cm s−1 ) for the M2 tidal currents. Blue ellipses indicate clockwise circulation, red ellipses
anticlockwise circulation. Other designations: TA is the Tyulen’i archipelago, CI is the Chilov (Zhiloy) island, TG is Türkmenbaşy Gulf, TB
is Turkmen Bay, OA is the Ogurja Ada.

3.3   Tidal currents                                                    1.8. The highest speed of the total tidal currents is observed
                                                                        mainly in the following straits: (1) Mangyshlak Bay near the
Tidal dynamics are characterised not only by sea level os-              Tyulen’i archipelago, up to 11.5 cm s−1 ; (2) Absheron Strait,
cillations but also by periodic currents. The spatial structure         which separates the Absheron Peninsula from the Chilov is-
of the amplitudes of the semi-major axes of tidal currents              land, up to 13 cm s−1 ; and (3) in the straits to the north and
(Fig. 6) differs from the pattern of the tidal sea level ampli-         south of Ogurja Ada, up to 22 and 19 cm s−1 .
tude distribution. The largest M2 current speeds (semi-major
axis) are found in (1) Mangyshlak Bay near the Tyulen’i                 3.4    Numerical experiments with varying MSL
archipelago, up to 6.5 cm s−1 ; (2) Absheron Strait, which
separates the Absheron Peninsula from the Chilov island, up             Interannual variability in the MSL is one of the main fea-
to 7.5 cm s−1 ; and (3) in the straits to the north and south of        tures of interest in the hydrological regime of the Caspian
Ogurja Ada, up to 12.5 and 11.7 cm s−1 . The M2 ellipse pa-             Sea (Bolgov et al., 2007) (Fig. 7). The mean depth of the
rameters (semi-major and semi-minor axes amplitudes, the                Northern Caspian is about 5–6 m. As a result, changes of the
direction of maximum current speed, phase lags) change                  Caspian MSL by 2–3 m (as observed, for example between
depending on local topographic features. For the highest                1977 and 1994) lead to significant changes in the hydrody-
speeds, the rotation of the ellipse occurs in a clockwise direc-        namics of the Northern Caspian as well as in coastal waters
tion. In straits and in shallow waters (for example, in Turk-           of the Middle Caspian and Southern Caspian. MSL varia-
men Bay), the semi-minor axis approaches zero and the tidal             tions lead to changes in the area and volume of the sea, and
currents are nearly rectilinear. The spatial pattern of the S2          they result in changes in the frequency-selective properties
tidal currents in the Caspian Sea has the same structure as             of both the entire Caspian Sea and its individual parts. As
that for the M2 constituent; the amplification areas and the            a consequence, the spatial characteristics of natural oscilla-
ellipse parameters remain the same, only the S2 semi-major              tions of the basin (seiches) and the tidal pattern should also
axis is half of that of M2 . Since M2 and S2 have the high-             be expected to change.
est current speeds in the Caspian Sea, the spatial pattern of              For the present study, we conducted numerical experi-
the maximum total tidal currents, calculated from time se-              ments with tidal simulations using different MSL values of
ries computed for 18.6 years, also repeats the pattern of the           the Caspian Sea ranging from −25 to −30 m with respect
M2 constituent. On average, the maximum total tidal current             to the BHS. This corresponds to the natural range of MSL
speed in the Caspian Sea exceeds the M2 speed by a factor of            changes in the Caspian Sea under climatic conditions typical

Ocean Sci., 16, 209–219, 2020                                                                         www.ocean-sci.net/16/209/2020/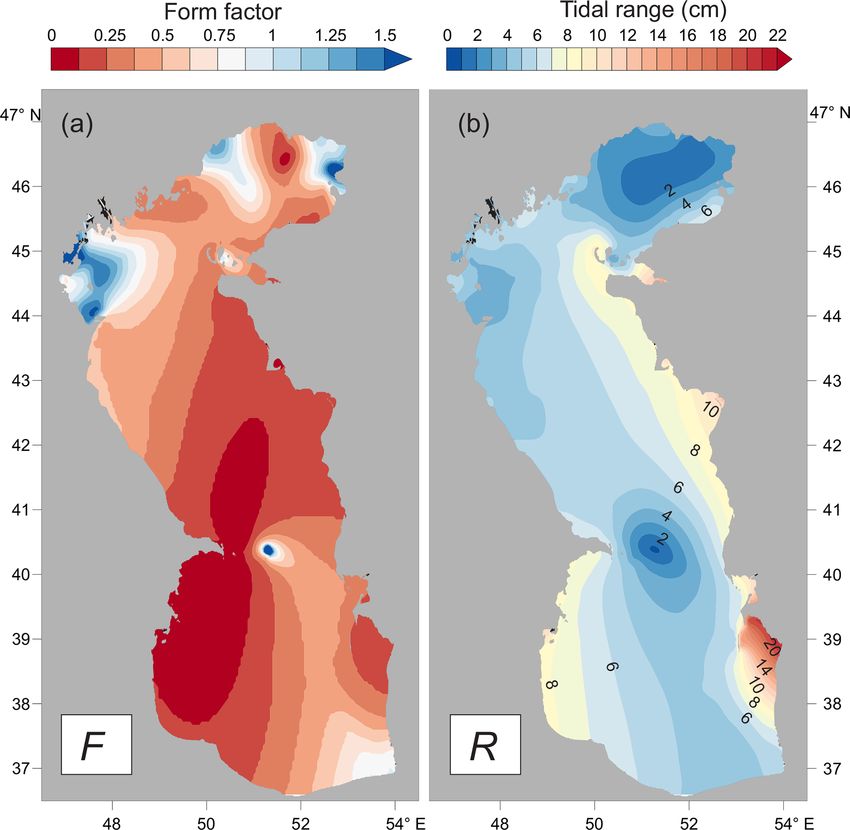
I. P. Medvedev et al.: Caspian Sea tides                                                                                            215

Figure 7. Changes in the mean sea level (MSL) of the Caspian Sea
at Makhachkala and the bathymetry of the sea for MSL values of
−25, −27, and −29 m with respect to the BHS. Numbers on the
contours indicate the depths of the shallowest areas below MSL in
each case. Orange areas became dry as a result of the assumed MSL
changes below −25 m.

for the sub-Atlantic climatic interval of the Holocene epoch
(Bolgov et al., 2007). The results of these experiments al-
low us to identify changes in the Caspian Sea tidal patterns        Figure 8. Tidal maps for the amplitude of the M2 constituent (a, b,
throughout the 19th and 20th centuries. The numerical re-           c), K1 (d, e, f), and tidal range (g, h, i) with different MSL values
sults reveal that MSL changes over these two centuries led          for the Caspian Sea: −25 m (a, d, g), −27 m (b, e, h), −29 m (c, f,
to a significant restructuring of the spatial structure of the      i).
natural sea level oscillations over the entire sea and its indi-
vidual parts (specifically, the Middle Caspian and Southern
Caspian).                                                              The most interesting and complex modification of the tidal
   The spatial structures of the semi-diurnal and diurnal tides     pattern occurs on the east coast of the sea. In the Türkmen-
in the Caspian Sea are modified by changes in the MSL               başy Gulf, the amplitude decreases from 4.4 cm with a MSL
(Fig. 8). The M2 amphidromic point shifts eastward by about         of −25 m to 3.1 cm for a MSL of −29 m. The reverse picture
10 km with a decrease in the MSL from −25 to −29 m, lead-           is observed in Turkmen Bay, where the amplitude increases
ing to a general displacement of the area with amplitudes of        from 3.5 to 6.5 cm. Turkmen Bay is a shallow semi-enclosed
1.5–2 cm also to the east. As a result, the M2 amplitude de-        bay, with Ogurja Ada situated on its western border. This is-
creases by 0.2–0.3 cm (up to 10 %–20 % of amplitude) along          land is a narrow sandy spit approximately 42 km long and
almost the entire eastern shore of the Middle Caspian. In the       1–1.5 km wide. The island’s height currently does not ex-
Southern Caspian, the tidal amphidrome also shifts to the east      ceed 3–5 m (Badyukova, 2015). Thus, when the MSL of the
and the tidal amplitudes increase along the western coast. An       Caspian Sea is −25 m, a significant part of the island is sub-
area of amplification of the semi-diurnal tides with ampli-         merged. Results of our numerical experiments show that the
tudes of up to 6.5 cm is formed in Mangyshlak Bay (North-           presence of the island creates a western boundary in Turk-
ern Caspian) with the MSL of −25 m. When the MSL drops              men Bay. The formation of this boundary leads to a change
to −28 m, the semi-diurnal amplitude in this bay decreases          in the frequency response of the bay and, as a consequence,
to 3.2 cm.                                                          to an increase in the amplitude of the semi-diurnal tides.

www.ocean-sci.net/16/209/2020/                                                                       Ocean Sci., 16, 209–219, 2020
216 I. P. Medvedev et al.: Caspian Sea tides
More pronounced modifications occur in the diurnal tide radiational and are formed under the influence of sea-breeze
pattern with the MSL changes. For a MSL of −25 m with re- winds (Medvedev et al., 2017).
spect to the BHS, there is a more noticeable separation of the An unexpected result was obtained for the eastern part
amphidrome near the Absheron Peninsula into two separate of the Southern Caspian. With a high MSL (for example,
systems to the north-east and south of the peninsula. The am- −25 m) a significant part of the territory of Ogurja Ada is
plitude of the diurnal tide on the western coast of the South- below the mean water level. As a result, it is easier for tidal
ern Caspian is 0.1–0.15 cm higher (up to 50 % in amplitude) waves to penetrate Turkmen Bay. With a low MSL (for ex-
for a MSL of −29 m than for a MSL of −25 m. On the east- ample, −29 m), the area and length of the island increase
ern coast of the Southern Caspian, the K1 amplitude varies significantly, and the island becomes an effective boundary
weakly with the MSL changes (by 10 %). However, the K1 to the west, reflecting the tidal waves that penetrate Turkmen
phase lags are modified. This is caused by the influence of Bay. According to Badyukova (2015), the island’s height cur-
Ogurja Ada at low MSL. rently does not exceed 3–5 m (MSL of −27.5 m with re-
Strong modifications of the diurnal tidal pattern due to spect to the BHS). According to elevation data derived from
MSL changes occur along the transition between Northern the Shuttle Radar Topography Mission (SRTM; Farr et al.,
Caspian and Middle Caspian. For a MSL of −25 m, the 2007), the island’s maximum height is also 5–8 m. We used
largest amplitudes are located near the Tyulen’i archipelago the GEBCO database to create our numerical grid for the
(up to 0.7–0.8 cm) and in Mangyshlak Bay (up to 1 cm). model, with a maximum elevation of the island of 2 m at a
With decreasing MSL, large amplitudes extend farther west. MSL of −28 m. Thus, in the experiments assuming a MSL
For a MSL of −29 m, maximum amplitudes of up to 1.1 cm of −25 m, the island was completely submerged. However,
are already reached at the western coast of the Northern according to historical records in 1835, when the MSL of
Caspian (near the Tyulen’i island). These changes are proba- the Caspian Sea was −25.5 m, the central elevated part of
bly caused by a strong modification of the water depth of the the island was in fact not flooded by the sea (the maximum
shallow Northern Caspian and, as a result, of the frequency height being about 3.5 m). Therefore, there is some mod-
(resonant) properties of this subbasin. elling uncertainty about this aspect. According to Badyukova
The change in the spatial structure of the tidal range (2015), the island actually represents preserved fragments of
with changes in MSL is similar to that for the M2 ampli- a coastal delta plain which was built on transgressive coastal
tude pattern. The maximum tidal range of 22 cm is found in bars and subsequently merged into one island. A comparison
Mangyshlak Bay for a MSL of −25 m. At this MSL, the tidal of the island’s coordinates in 1850 with 2013 (Badyukova,
range in Turkmen Bay is 13 cm and in Türkmenbaşy Gulf 2015) shows that the island has gradually moved eastward
it is 15.5 cm. When the MSL decreases, the tidal range in and has changed its geometrical configuration due to the re-
Mangyshlak Bay decreases, while that in Turkmen Bay in- distribution of deposits and erosion. The greatest contribu-
creases. For a MSL of −29 m, the tidal range in Turkmen tion to this process originates from aeolian redistribution.
Bay becomes 23 cm, whereas it is only 14 cm in Mangyshlak According to Nikiforov (1964), for each 1 m of the beach
Bay. 5 kg of sand is carried inland every hour for a wind speed of
The changes in tidal characteristics can be very significant 4.9 km s−1 .
at individual sites. Figure 9 shows tidal vector diagrams that Numerical experiments were conducted with forcing pro-
display the M2 model amplitude and phase lag for differ- duced by synthetic wind fields in order to assess changes in
ent sites for different MSL scenarios for the Caspian Sea. natural oscillations (seiches) with a change in the MSL. The
The amplitude and phase lag changes are relatively small at magnitude and direction of the generated wind fields was var-
Makhachkala, Baku, and Bektash. However, the M2 phase ied randomly every 6 h. A spectral analysis of the simulated
lag for Ogurja Ada changes by about 100◦ and the M2 am- wind sea level variability showed that a decrease in the MSL
plitude doubles: from 2.5 cm for a MSL of −25 m to 5 cm for leads to a change in the period and Q factor of the natural os-
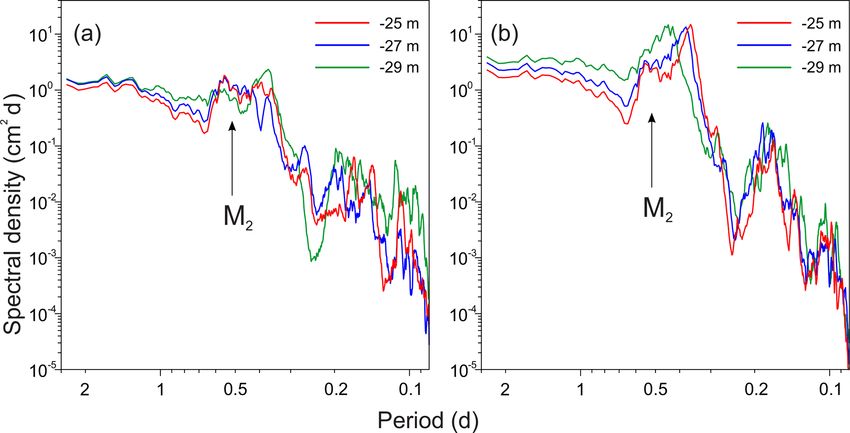
a MSL of −30 m. cillations of Türkmenbaşy Gulf and Turkmen Bay. When the
MSL of the Caspian Sea decreases, the Q factor of seiches in
Türkmenbaşy Gulf, which have a period of about 12 h (i.e.
4 Discussion around the M2 tidal period), significantly decreases. For a
MSL of −29 m, this spectral peak does not exceed the spec-
The results of the numerical tidal modelling in this study are tral noise level (Fig. 10a).
in good agreement with the results of a harmonic analysis of In Turkmen Bay, a decrease in MSL from −26 to −29 m
tide gauge data of the Caspian Sea (Medvedev et al., 2017). causes the spectral peak of the main seiche mode to mi-
Medvedev et al. (2017) demonstrated that a diurnal peak is grate towards lower frequencies. Thus, the period of this
absent in the sea level spectra on the western coast of the seiche mode approaches the period of the M2 tidal con-
Southern Caspian (Baku, Svinoy island), which is confirmed stituent (Fig. 10b). This is due to the progressive elongation
here by the result of the numerical simulation of the K1 am- of Ogurja island, which represents the western boundary of
plitude (Fig. 3a). Diurnal tides in the Southern Caspian are the bay. The closeness of the period of natural oscillations
Ocean Sci., 16, 209–219, 2020 www.ocean-sci.net/16/209/2020/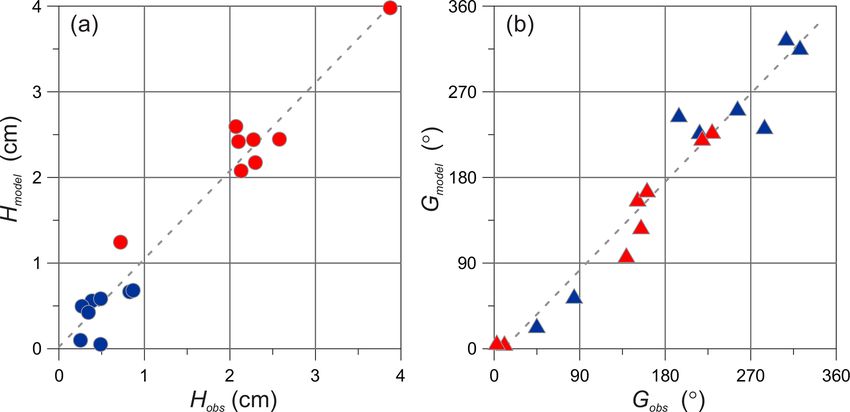
I. P. Medvedev et al.: Caspian Sea tides                                                                                             217

Figure 9. Changes in the amplitude (cm) and phase lag (degrees) of the M2 tidal constituent at four sites with different values of the MSL
based on numerical modelling results.

Figure 10. Sea level spectra for (a) Türkmenbaşy Gulf and (b) Turkmen Bay at different MSL values for the Caspian Sea.

www.ocean-sci.net/16/209/2020/                                                                         Ocean Sci., 16, 209–219, 2020
218                                                                                      I. P. Medvedev et al.: Caspian Sea tides

(seiches) to the tidal period (12.42 h) affects the structure        Author contributions. The concept of the study was jointly devel-
of the tidal oscillations. The “sensitivity” of the tides to the     oped by IM and EK. IM did the numerical simulations, analysis,
changes in the MSL is determined by the proximity or dis-            visualisation, and article writing. EK prepared the numerical grids
tance from the natural period.                                       and participated in the analyses and the interpretation of the re-
                                                                     sults. IF adapted the numerical Princeton Ocean Model (POM) to
                                                                     the Caspian Sea and participated in the verification stage. IM pre-
5   Conclusions                                                      pared the paper with contributions from EK and IF.

In this numerical modelling study, we have investigated the
tidal dynamics of the Caspian Sea. The numerical simula-             Competing interests. The authors declare that they have no conflict
tions were forced by the direct action of the tidal potential.       of interest.
The main objective of the study was to map the tidal charac-
teristics of the Caspian Sea. For the first time, it has been pos-
sible to construct detailed co-tidal maps of the sea level and       Special issue statement. This article is part of the special
current ellipses for the major tidal constituents using a nu-        issue “Developments in the science and history of tides
                                                                     (OS/ACP/HGSS/NPG/SE inter-journal SI)”. It is not associ-
merical hydrodynamic model taking into account data from
                                                                     ated with a conference.
long-term sea level observations. The results of the numeri-
cal simulations indicate that maximum tidal amplitudes are
located in the south-eastern part of the sea. The contribution
                                                                     Acknowledgements. The authors would like to thank
of the tides to the overall sea level variance in the frequency      Richard Thomson, Philip Woodworth, Rosanna Neuhausler,
band from 0.1 to 6 cpd is up to 29 % in the eastern part of the      and two anonymous reviewers for their very interesting comments
Middle Caspian and up to 27 % in Turkmen Bay. We have                and helpful suggestions during the preparation of the paper.
shown that tidal currents can reach more than 20 cm s−1 in
certain areas (for example, in straits), which is comparable to
the magnitude of persistent currents due to the hydrological         Financial support. This research has been supported by the state
regime (Tuzhilkin and Kosarev, 2005). Our results indicate           assignment of IO RAS (grant no. 0149-2019-0005) and the Russian
that the role of tides in the hydrodynamics of isolated (non-        Foundation for Basic Research (grant no. 18-05-01018).
tidal) seas might have been previously underestimated.
   Our numerical experiments demonstrate that the spatial
features of the tides are sensitive to changes in the MSL.           Review statement. This paper was edited by Philip Woodworth and
Modifications to the tidal pattern are caused by changes in          reviewed by two anonymous referees.
the bathymetry and geometry of the coastline of shallow ar-
eas of the sea, including the Northern Caspian, which results
in significant changes in the frequency response of the basin.
This is also confirmed by changes in the natural oscillation         References
(seiche) structure of the Caspian Sea.
   In recent decades, significant progress has been achieved         Badyukova, E. N.: Comparative analysis of the structure and gene-
in the improvement of global barotropic tide models. This              sis of the Northern Caspian Sea islands and the island Ogurchin-
progress has been supported by satellite altimetry. Stammer            sky off the coast of Turkmenistan, IGCP 610 Third Plenary Con-
et al. (2014) presented a detailed comparison of the main              ference and Field Trip “From the Caspian to Mediterranean:
modern global barotropic tide models. Most of these mod-               Environmental Change and Human Response during the Qua-
els (FES14, EOT11a, TPXO9, GOT4.10, OSU12, DTU10,                      ternary”, edited by: Gilbert, A., Yanko-Hombach, V., and Yan-
HAMTide) do not include the Caspian Sea.                               ina, T., 22–30 September 2015, Astrakhan, Russia, Proceedings,
                                                                       MSU, Moscow, 18–20, 2015.
   We believe that our findings concerning tidal dynamics
                                                                     Baidin, S. S. and Kosarev, A. N. The Caspian Sea: Hydrology and
can help to better understand the diurnal and semi-diurnal             hydrochemistry, Nauka, Moscow, 262 pp., 1986.
variability in sea level and currents in the Caspian Sea. In         Bolgov, M. V., Krasnozhon, G. F., and Lyubushin, A. A.:
addition, we suggest that our findings should be taken into            The Caspian Sea: Extreme hydrological events, edited by:
account when future global tide models are constructed.                Khublatyan, M. G., Nauka, Moscow, 381 pp., 2007.
                                                                     Defant, A.: Physical Oceanography (Vol. II), Pergamon Press, Ox-
                                                                       ford, 598 pp., 1961.
Data availability. The model output data are published               Farr, T. G., Rosen, P. A., Caro, E., Crippen, R., Duren, R.,
at the public data repositories of the Shirshov Insti-                 Hensley, S., Kobrick, M., Paller, M., Rodriguez, E., Roth,
tute of Oceanology, Russian Academy of Sciences;                       L., Seal, D., Shaffer, S., Shimada, J., Umland, J., Werner,
https://doi.org/10.29006/datasets.2020.cst.1 (Medvedev et al.,         M., Oskin, M., Burbank, D., and Alsdorf, D.: The Shut-
2020).                                                                 tle Radar Topography Mission, Rev. Geophys., 45, RG2004,
                                                                       https://doi.org/10.1029/2005RG000183, 2007.

Ocean Sci., 16, 209–219, 2020                                                                     www.ocean-sci.net/16/209/2020/
I. P. Medvedev et al.: Caspian Sea tides 219 German, V. K.: Spectral analysis of water level oscillations in the Nikiforov, L. G.: On the question of coastal bar formation, Oceanol- Azov, Black, and Caspian seas within the range from one cycle ogy, 4, 654–658, 1964. over few hours until one cycle over few days, Tr. Gos. Okeanogr. Pugh, D. T. and Woodworth, P. L.: Sea-level science: Understand- Inst., 103, 52–73, 1970. ing tides, surges, tsunamis and mean sea-level changes, Cam- Hall, J. K.: Bathymetric compilations of the seas around Israel I: bridge University Press, Cambridge, ISBN 9781107028197, 408 The Caspian and Black Seas, Geological Survey of Israel, Cur- pp., 2014. rent Research, 13, 105–108, 2002. Saha, S., Moorthi, S., Pan, H. L., Wu, X. R., Wang, J. D., Nadiga, Kantha, L. H. and Clayson, C. A.: Numerical models of oceans S., Tripp, P., Kistler, R., Woollen, J., Behringer, D., Liu, H. and oceanic processes, International Geophysics Series, 66, Aca- X., Stokes, D., Grumbine, R., Gayno, G., Wang, J., Hou, Y. demic Press, San Diego, 940 pp., 2000. T., Chuang, H. Y., Juang, H. M. H., Sela, J., Iredell, M., Kosarev, A. N. and Tsyganov, V. F.: Some statistical characteris- Treadon, R., Kleist, D., Van Delst, P., Keyser, D., Derber, J., tics of the water level oscillations in the Caspian Sea, Meteorol. Ek, M., Meng, J., Wei, H. L., Yang, R. Q., Lord, S., Van den Gidrol., 2, 49–56, 1972. Dool, H., Kumar, A., Wang, W. Q., Long, C., Chelliah, M., Levyant, A. S., Rabinovich, A. B., and Rabinovich, B. I.: Calcu- Xue, Y., Huang, B. Y., Schemm, J. K., Ebisuzaki, W., Lin, lation of the free-form seiches oscillations in the Caspian Sea, R., Xie, P. P., Chen, M. Y., Zhou, S. T., Higgins, W., Zou, C. Oceanology, 33, 588–598, 1994. Z., Liu, Q. H., Chen, Y., Han, Y., Cucurull, L., Reynolds, R. Malinovsky, N. V.: The tides in the Caspian Sea, Meteorol. Vestn., W., Rutledge, G., and Goldberg, M.: The NCEP Climate Fore- 5, 116–117, 1926. cast System Reanalysis, B. Am. Meteorol. Soc., 91, 1015–1057, Medvedev, I. P.: Tides in the Black Sea: Observations and https://doi.org/10.1175/2010BAMS3001.1, 2010. Numerical Modelling, Pure Appl. Geophys., 175, 1951, Spidchenko, A. N.: The tides in the Caspian Sea, Meteorol. Gidrol., https://doi.org/10.1007/s00024-018-1878-x, 2018. 5, 98–100, 1973. Medvedev, I. P., Rabinovich, A. B., and Kulikov, E. A.: Tidal Stammer, D., Ray, R. D., Andersen, O. B., Arbic, B. K., Bosch, oscillations in the Baltic Sea, Oceanology, 53, 526–538, W., Carrièe, L., Cheng, Y., Chinn, D. S., Dushaw, B. D., Egbert, https://doi.org/10.1134/S0001437013050123, 2013. G. D., Erofeeva, S. Y., Fok, H. S., Green, J. A. M., Griffiths, S., Medvedev, I. P., Rabinovich, A. B., and Kulikov, E. A.: Tides in King, M. A., Lapin, V., Lemoine, F. G., Luthcke, S. B., Lyard, three enclosed basins: the Baltic, Black and Caspian seas, Front. F., Morison, J., Müller, M., Padman, L., Richman, J. G., Shriver, Mar. Sci., 3, 1–7, https://doi.org/10.3389/fmars.2016.00046, J. F., Shum, C. K., Taguchi, E., and Yi, Y.: Accuracy assessment 2016. of global barotropic ocean tide models, Rev. Geophys., 52, 243– Medvedev, I. P., Kulikov, E. A., and Rabinovich, A. B.: Tidal 282, https://doi.org/10.1002/2014RG000450, 2014. oscillations in the Caspian Sea, Oceanology, 57, 360–375, Tuzhilkin, V. S. and Kosarev, A. N.: Thermohaline structure and https://doi.org/10.1134/S0001437017020138, 2017. general circulation of the Caspian Sea waters, in: The Caspian Medvedev, I. P., Kulikov, E. A., Fine, I. V., and Kulikov, Sea Environment, The Handbook of Environmental Chemistry, A. E.: Numerical modelling of sea level oscillations in edited by: Kostianoy, A. G. and Kosarev, A. N., vol. 5P, Springer, the Caspian Sea, Russ. Meteorol. Hydro.+, 44, 529–539, Berlin, Heidelberg, 33–57, https://doi.org/10.1007/698_5_003, https://doi.org/10.3103/S1068373919080041, 2019. 2005. Medvedev, I. P., Kulikov, E. A., and Fine, I. V.: The Caspian Sea Wahr, J.: Body tides on an elliptical, rotating, elastic and tides data, https://doi.org/10.29006/datasets.2020.cst.1, 2020. oceanless Earth, Geophys. J. Roy. Astr. S., 6, 677–703, Mellor, G. L.: Users guide for a three-dimensional, primitive equa- https://doi.org/10.1111/j.1365-246X.1981.tb02690.x, 1981. tion, numerical ocean model. Program in Atmospheric and Oceanic Sciences, Princeton, Princeton University, NJ, 08544- 0710, 56 pp., 2004. Munk, W. H. and Cartwright, D. E.: Tidal spectroscopy and prediction, Philos. T. Roy. Soc. Lond. A, 259, 533–581, https://doi.org/10.1098/rsta.1966.0024, 1966. www.ocean-sci.net/16/209/2020/ Ocean Sci., 16, 209–219, 2020
You can also read